Market Wrap: Stocks, Bonds, Commodities
Wall Street followed world shares to a higher close on Wednesday and the benchmark US Treasury yield dipped to a one-month low after Federal Reserve Chair Jerome Powell reassured investors that while inflation is not quite tamed rate cuts can be expected this year.
The Dow Jones Industrial Average rose 75.86 points to 38,661.05, the S&P 500 gain 0.51% to 5,104.76 and the Nasdaq Composite add 91.96 points to 16,031.54.
MSCI’s index of Asia-Pacific stocks outside Japan is advance 0.31% to 646.86 levels. The Australian index was higher by 0.39% to 7,763.70. Japanese Nikkei Index drop 1.31% today.
European stocks were mixed on Thursday, with the Stoxx Europe 50 Index rose 0.14% to 4,922.35, Germany’s DAX drop 0.25% to 17,681.25, and France’s CAC decline 0.09% to 7,947.64 and U.K.’s FTSE 100 subtract 0.25% to 7,660.84.
Benchmark 10-year U.S. Treasury fell as demand for safe assets ascend again, today 10-year bond yields negative 0.05% to 4.1040.
Oil prices climbed about 2 percent on Wednesday on a smaller-than-expected build-up in US crude inventories, a big withdrawal from distillate and gasoline stockpiles and remarks by the Federal Reserve chief that he still expects US interest rate cuts this year.
Spot Brent crude oil drop 0.54% to $82.52 per barrel. US West Texas Intermediate crude is down 0.49% to $78.75 a barrel.
The yellow metal gold is advance 0.34% to 2,164.75 dollars per ounce.
Market Wrap: Forex
A strong U.S. dollar will maintain the status quo in the near term, as markets brace for a risk the Federal Reserve’s first interest rate cut gets delayed to the second half of this year, according to a Reuters poll of foreign exchange strategists.
Today, the U.S. dollar index measures the Greenback against a trade-weighted basket of six major currencies, which slipped 0.13% to 103.182.
The Euro US Dollar (EUR/USD) is a widely traded pair that is down 0.01% today. This left the pair trading around $1.08960.
The Japanese yen was negative against the U.S. dollar on Thursday. Today USD/JPY is slipped 0.94% to the 147.960 level.
Another commodity-related currency positive against the U.S dollar, AUD/USD rose 0.54% to 0.65990, and NZD/USD surged 0.45% to 0.61560 level.
EUR/USD Intraday: Trend on the upside
Our pivot point is at 1.08970
Preferable Price Action: Take buy positions above pivot level with targets at 1.09140 & 1.09250 in extension.
Alternative Price Action: Below pivot looks for a further downside to 1.08820 & 1.08680.
Comment: RSI is above 50 levels and Pairs above 55MA.
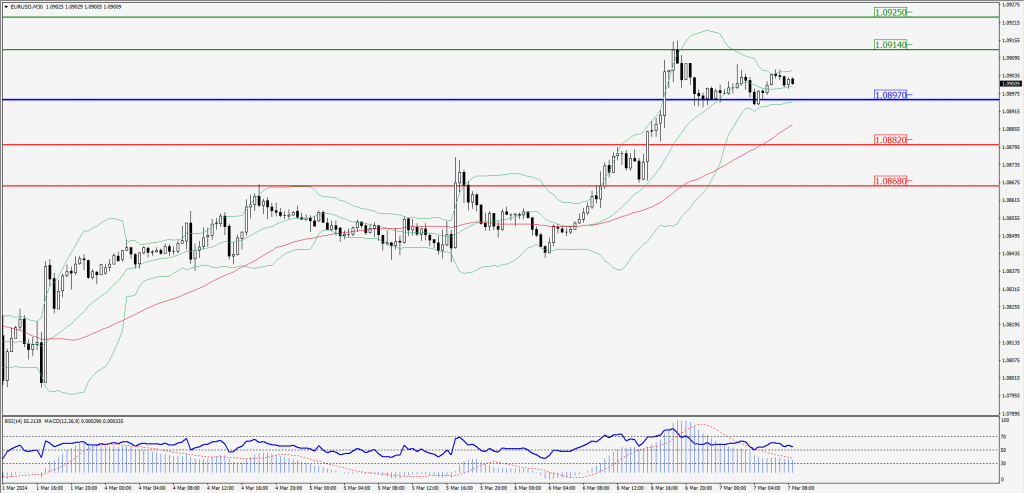
Green Lines Indicate Resistance Levels – Red Lines Indicate Support Levels
Light Blue is a Pivot Point – Black represents the price when the report was produced
GBP/USD Intraday: Trend on the upside
Our pivot point is at 1.27310
Preferable Price Action: Buy positions above pivot with targets at 1.27560 & 1.27720 in extension.
Alternative Price Action: The price below pivot would call for further downside to 1.27060 & 1.26890.
Comment: RSI is above 50 levels and Pairs above its 20MA & 55MA.
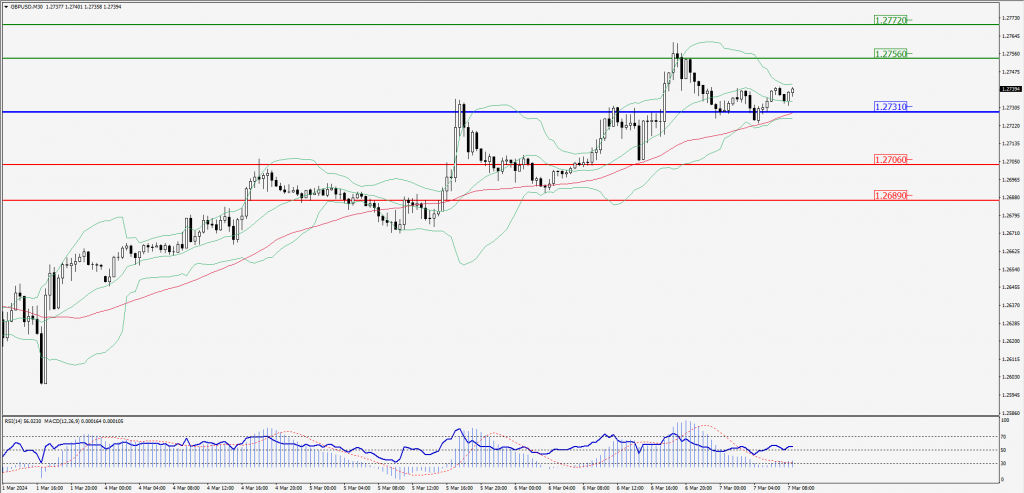
Green Lines Indicate Resistance Levels – Red Lines Indicate Support Levels
Light Blue is a Pivot Point – Black represents the price when the report was produced
USD/JPY Intraday: Major trend on the downside
Our pivot point is at 148.370
Preferable Price Action: Sell position below pivot with the target at 147.800 and 147.410 in extension.
Alternative Price Action: The upside breakout of the pivot would call for 149.910 and 148.290.
Comment: MACD is below 50 level and Pairs below its 20MA & 55MA.
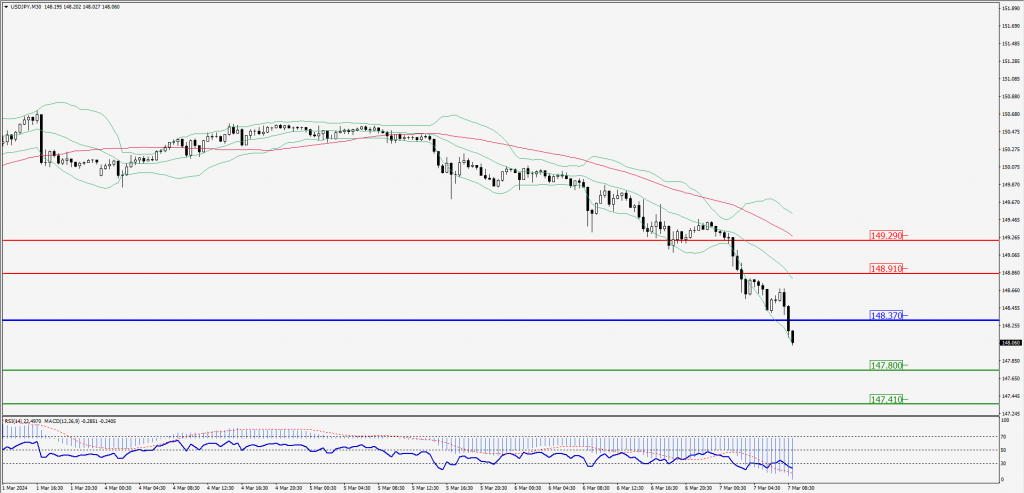
Green Lines Indicate Resistance Levels – Red Lines Indicate Support Levels
Light Blue is a Pivot Point – Black represents the price when the report was produced
AUD/USD Intraday: Trend in the upside
Our pivot point is at 0.65800
Preferable Price Action: Buy positions above pivot with targets at 0.65980 & 0.66120 in extension.
Alternative Price Action: Below pivot looks for a further downside with 0.65620 & 0.65490 as targets.
Comment: RSI is above 50 levels and Pairs above its 20MA & 55MA.
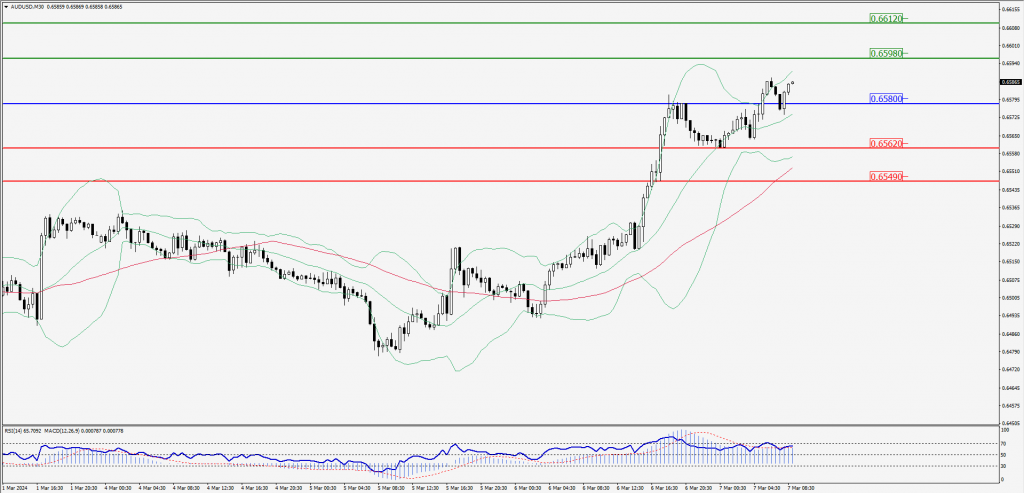
Green Lines Indicate Resistance Levels – Red Lines Indicate Support Levels
Light Blue is a Pivot Point – Black represents the price when the report was produced
CRUDEOIL Intraday: In a consolidation zone
Our pivot point is at 78.51
Preferable Price Action: Above pivot buy oil with 78.94 & 79.26 as targets.
Alternative Price Action: Sell crude below pivot with targets at 78.10 and 77.76 in extension.
Comment: MACD is flat territory and Pairs above 55MA.
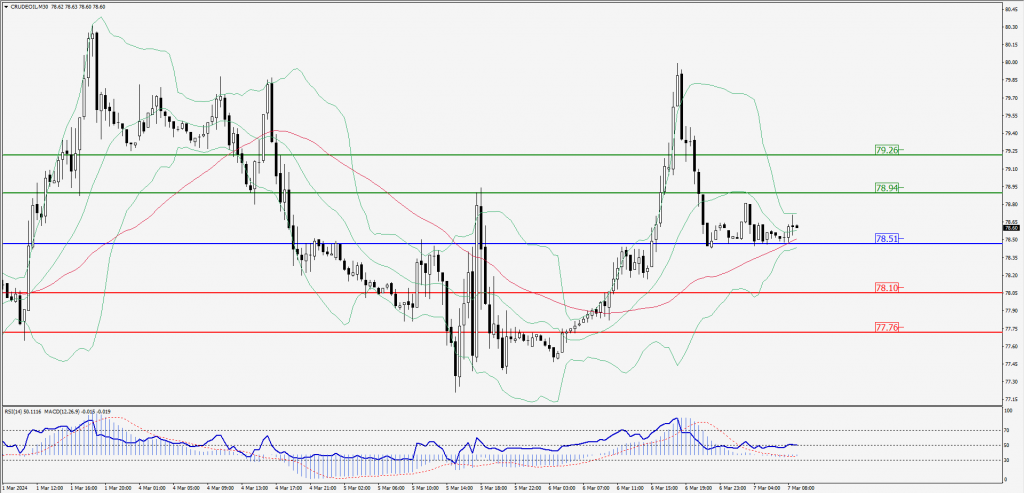
Green Lines Indicate Resistance Levels – Red Lines Indicate Support Levels
Light Blue is a Pivot Point – Black represents the price when the report was produced
XAU/USD Intraday: Trend on the upside
Our pivot point is 2150.00
Preferable Price Action: Further upside to 2171.10 and 2185.20.
Alternative Price Action: If the price gives a downside breakout of a pivot, then the price extends to 2126.80 and 2112.50.
Comment: MACD is above 50 level and Pairs above its 20MA & 55MA.
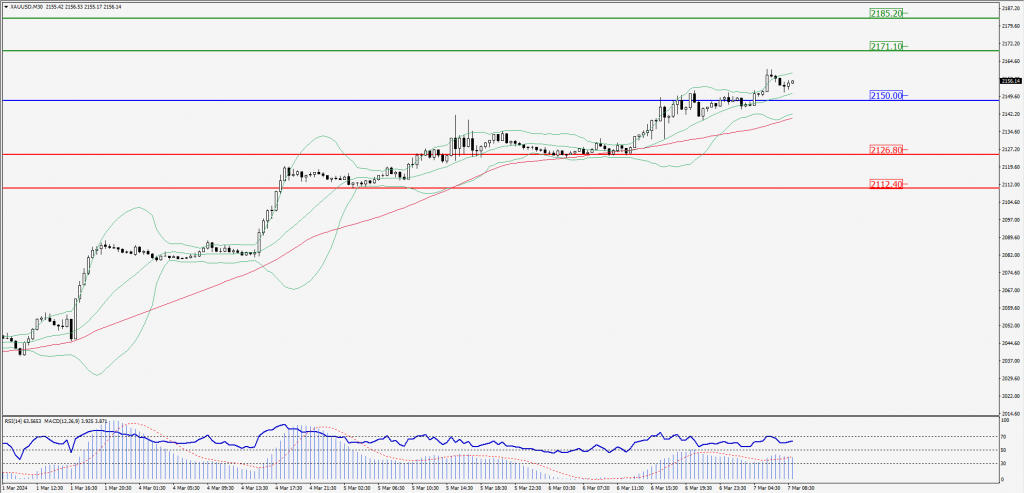
Green Lines Indicate Resistance Levels – Red Lines Indicate Support Levels
Light Blue is a Pivot Point – Black represents the price when the report was produced
Dow Jones Intraday: Resistance level at 38,643.70
Our pivot point is 38,643.70
Preferable Price Action: Take sell positions below the pivot with targets at 38,523.20 & 38,444.10.
Alternative Price Action: Above 38,643.70 looks for further upside to 38,766.40 & 38,859.20.
Comment: RSI is below 50 levels and Pairs below its 20MA & 55MA.
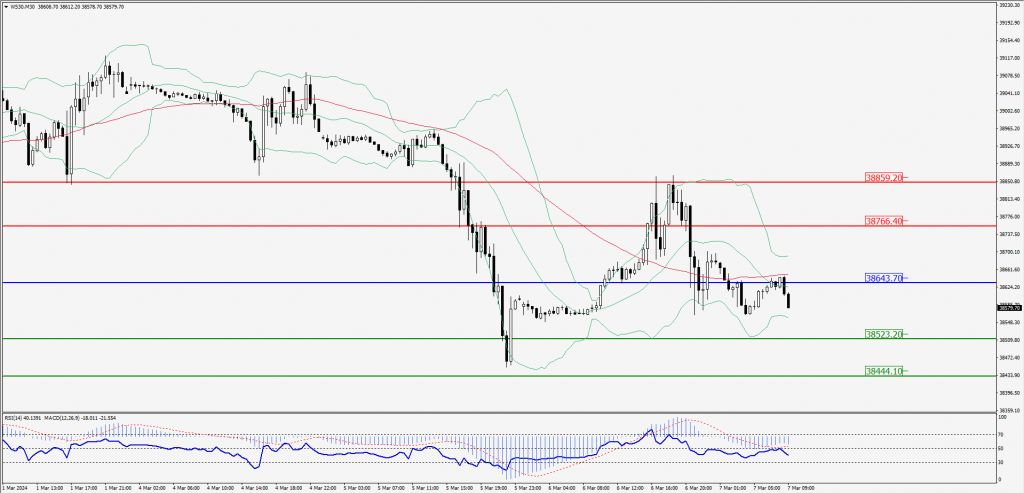
Green Lines Indicate Resistance Levels – Red Lines Indicate Support Levels
Light Blue is a Pivot Point – Black represents the price when the report was produced