Market Wrap: Stocks, Bonds, Commodities
The S&P 500 and Nasdaq closed lower on Friday after touching record highs during the session, with high-flying chip stocks going reverse and a mixed labour market report showing more new jobs than expected with a rising unemployment rate.
The Dow Jones Industrial Average fell 68.66 points to 38,722.69, the S&P 500 lose 0.65% to 5,123.69 and the Nasdaq Composite subtract 188.26 points to 16,085.11.
MSCI’s index of Asia-Pacific stocks outside Japan is advance 0.36% to 655.08 levels. The Australian index was lower by 1.82% to 7,704.20. Japanese Nikkei Index drop 2.11% today.
European stocks were negative on Monday, with the Stoxx Europe 50 Index fell 0.74% to 4,925.35, Germany’s DAX drop 0.72% to 17,681.25, and France’s CAC decline 0.34% to 7999.57 and U.K.’s FTSE 100 subtract 0.16% to 7,645.60.
Benchmark 10-year U.S. Treasury fell as demand for safe assets ascend again, today 10-year bond yields negative 0.42% to 4.071.
Oil prices extended last week’s losses on Monday on concern about slow demand in China, although lingering geopolitical risk surrounding the Middle East and Russia limited the decline.
Spot Brent crude oil Ascend 0.27% to $82.28 per barrel. US West Texas Intermediate crude is up 0.21% to $78.17 a barrel.
The yellow metal gold is decline 0.09% to 2,183.75 dollars per ounce.
Market Wrap: Forex
The dollar traded modestly weaker against most major peers on Friday, and was on pace for its worst weekly showing against the euro this year after mixed data kept an anticipated June interest rate cut from the Federal Reserve on the table.
Today, the U.S. dollar index measures the Greenback against a trade-weighted basket of six major currencies, which slipped 0.04% to 102.299.
The Euro US Dollar (EUR/USD) is a widely traded pair that is up 0.05% today. This left the pair trading around $1.09430.
The Japanese yen was negative against the U.S. dollar on Monday. Today USD/JPY is slipped 0.25% to the 146.700 level.
Another commodity-related currency mixed against the U.S dollar, AUD/USD fell 0.18% to 0.66140, and NZD/USD surged 0.02% to 0.61740 level.
EUR/USD Intraday: Resistance level at 1.09480
Our pivot point is at 1.09480
Preferable Price Action: Take sell positions below pivot level with targets at 1.09280 & 1.09140 in extension.
Alternative Price Action: Above pivot looks for a further upside to 1.09660 & 1.09810.
Comment: RSI is at 50 levels.
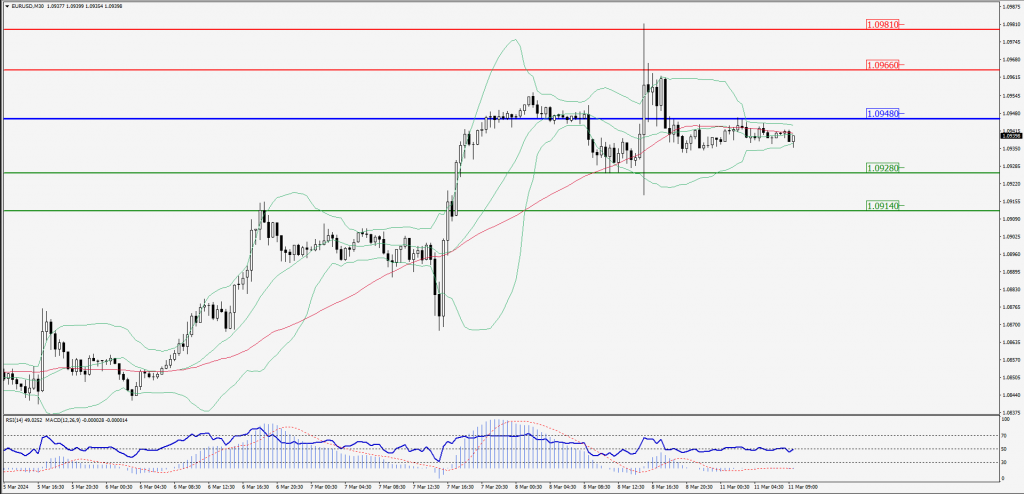
Green Lines Indicate Resistance Levels – Red Lines Indicate Support Levels
Light Blue is a Pivot Point – Black represents the price when the report was produced
GBP/USD Intraday: Trend on the upside
Our pivot point is at 1.28440
Preferable Price Action: Buy positions above pivot with targets at 1.28710 & 1.28910 in extension.
Alternative Price Action: The price below pivot would call for further downside to 1.28160 & 1.27920.
Comment: RSI is above 50 levels and Pairs above 55MA.
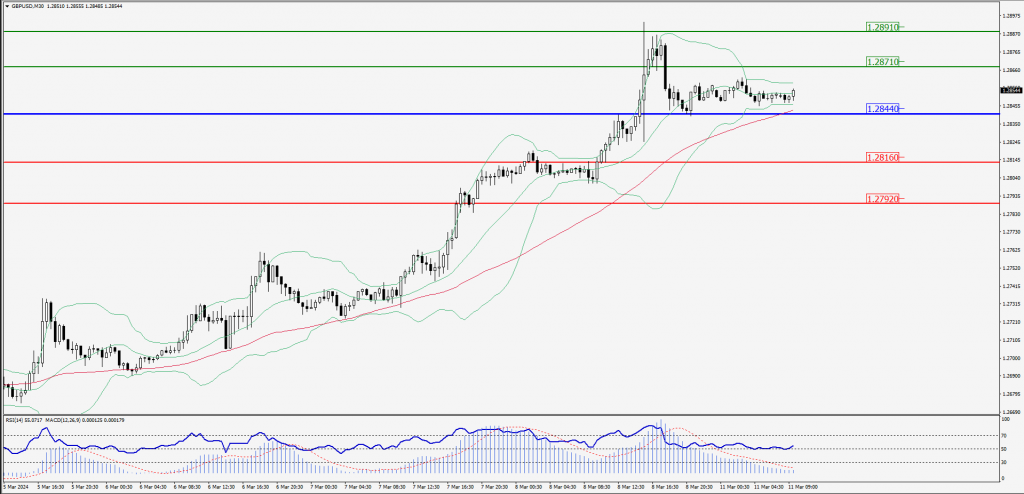
Green Lines Indicate Resistance Levels – Red Lines Indicate Support Levels
Light Blue is a Pivot Point – Black represents the price when the report was produced
USD/JPY Intraday: Resistance level at 147.150
Our pivot point is at 147.150
Preferable Price Action: Sell position below pivot with the target at 146.590 and 146.240 in extension.
Alternative Price Action: The upside breakout of the pivot would call for 147.780 and 148.220.
Comment: MACD is below 50 level and Pairs below 55MA.
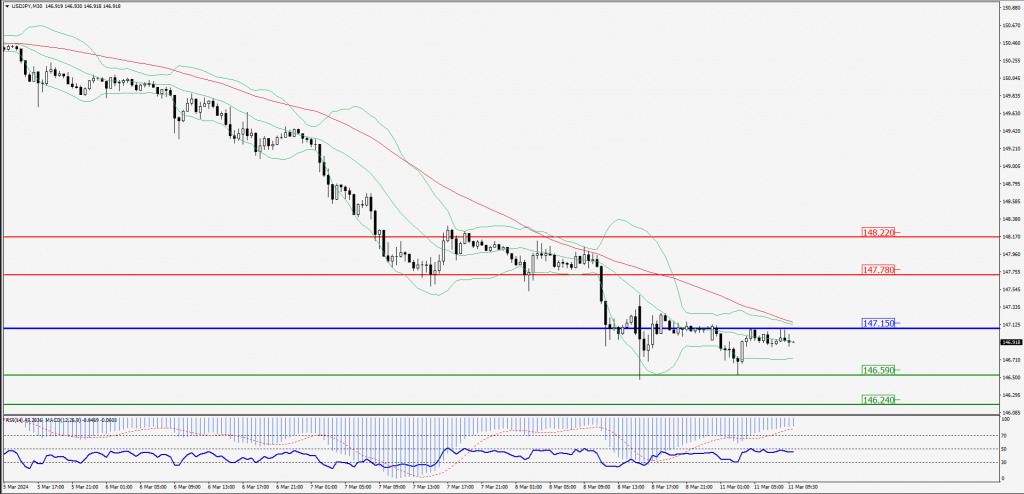
Green Lines Indicate Resistance Levels – Red Lines Indicate Support Levels
Light Blue is a Pivot Point – Black represents the price when the report was produced
AUD/USD Intraday: Trend on the downside
Our pivot point is at 0.66270
Preferable Price Action: Sell positions below pivot with targets at 0.66050 & 0.65890 in extension.
Alternative Price Action: Above pivot looks for a further upside with 0.66470 & 0.66640 as targets.
Comment: RSI is below 50 levels and Pairs below 55MA.
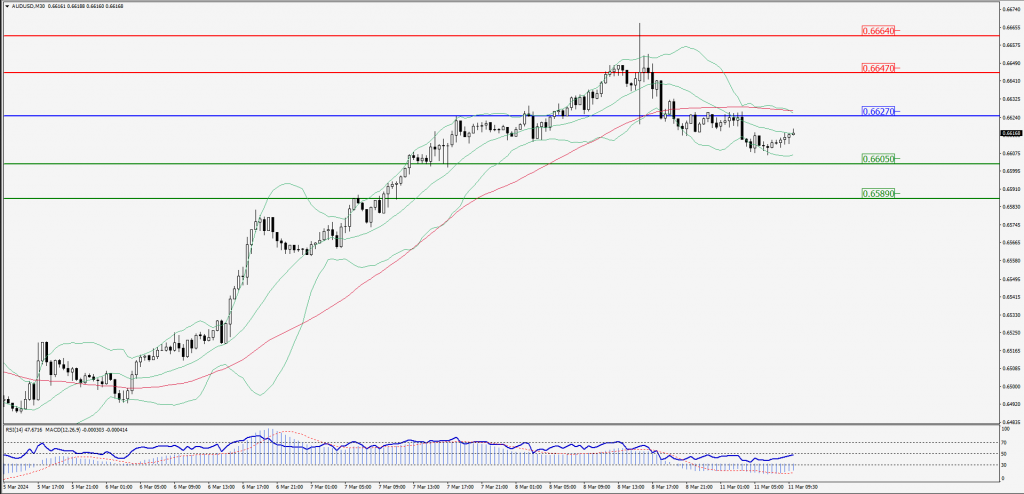
Green Lines Indicate Resistance Levels – Red Lines Indicate Support Levels
Light Blue is a Pivot Point – Black represents the price when the report was produced
CRUDEOIL Intraday: In a consolidation zone
Our pivot point is at 77.24
Preferable Price Action: Above pivot buy oil with 77.81 & 78.22 as targets.
Alternative Price Action: Sell crude below pivot with targets at 76.71 and 76.30 in extension.
Comment: MACD is positive territory and Pairs above 20MA.
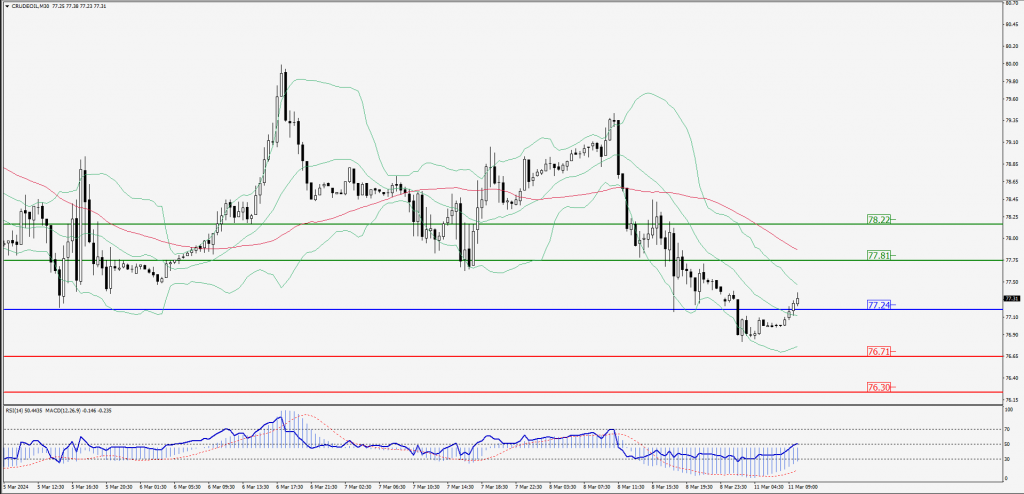
Green Lines Indicate Resistance Levels – Red Lines Indicate Support Levels
Light Blue is a Pivot Point – Black represents the price when the report was produced
XAU/USD Intraday: Trend on the upside
Our pivot point is 2175.60
Preferable Price Action: Further upside to 2186.60 and 2194.70.
Alternative Price Action: If the price gives a downside breakout of a pivot, then the price extends to 2164.10 and 2155.50.
Comment: MACD is above 50 level and Pairs above 55MA.
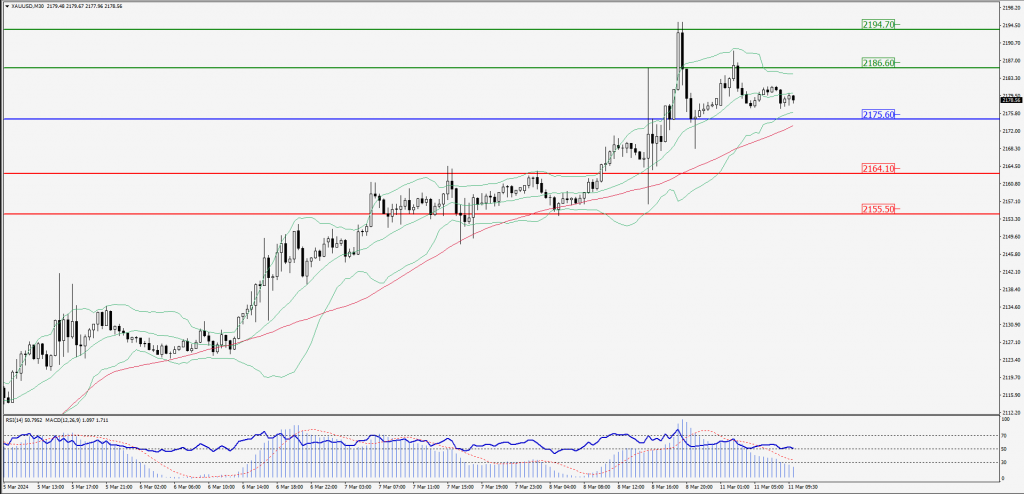
Green Lines Indicate Resistance Levels – Red Lines Indicate Support Levels
Light Blue is a Pivot Point – Black represents the price when the report was produced
Dow Jones Intraday: Trend on the downside
Our pivot point is 38,711.10
Preferable Price Action: Take sell positions below the pivot with targets at 38,638.30 & 38,584.40.
Alternative Price Action: Above 38,711.10 looks for further upside to 38,783.60 & 38,836.50.
Comment: RSI is below 50 levels and Pairs below 55MA.
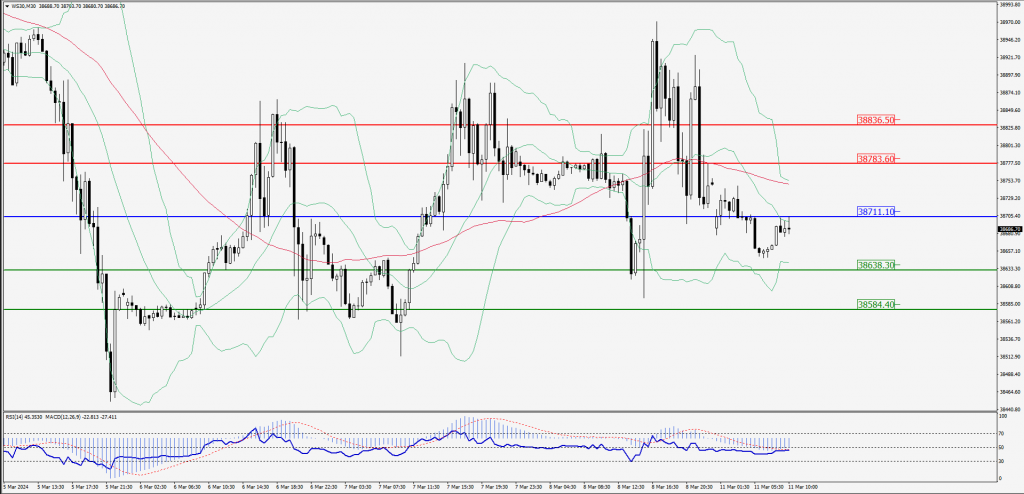
Green Lines Indicate Resistance Levels – Red Lines Indicate Support Levels
Light Blue is a Pivot Point – Black represents the price when the report was produced