Market Wrap: Stocks, Bonds, Commodities
Wall Street stocks closed lower on Wednesday, unable to sustain a late-day surge, after data showing strong US labor demand again suggested the Federal Reserve will keep interest rates higher for longer.
The Dow Jones Industrial Average fell 42.45 points to 30,273.87, the S&P 500 lose 7.65 points to 3,783.28 and the Nasdaq Composite subtract 27.77 points to 11,148.64.
MSCI’s index of Asia-Pacific stocks outside Japan is ascend 0.30% to 579.11 levels. Australian index higher 0.03% to 6,817.50. Japanese Nikkei Index ascend 0.70% to 27,311.30.
European stocks were positive on Thursday, with the Stoxx Europe 50 Index rose 0.37% to 3,459.75, Germany’s DAX ascend 0.43% to 12,570.20, and France’s CAC up 0.19% to 5,996.85, and U.K.’s FTSE 100 slipped 0.05% to 7,058.85.
Benchmark 10-year U.S. Treasury fell as demand for safe assets ascend again, today 10-year bond yields a positive 0.64% to 3.7830.
Oil prices edged up in early Asian trade on Thursday after OPEC+ agreed to further tighten global crude supply with a deal to slash oil production by about 2 million barrel per day.
Spot Brent crude oil add 0.32% to $93.69 per barrel. US West Texas Intermediate crude is up 0.31% to $87.98 a barrel.
The yellow metal gold is advance 0.28% to 1,725.45 dollars per ounce.
Market Wrap: Forex
The dollar rose in early trade in Europe on Thursday, after a top Federal Reserve official warned that the U.S. central bank isn’t close to ending its cycle of interest rate hikes yet.
Today, the U.S. dollar index measures the Greenback against a trade-weighted basket of six major currencies, which is rose 0.16% to 111.180.
The Euro US Dollar (EUR/USD) is a widely traded pair that is up 0.01% today. This left the pair trading around $0.98830.
The Japanese yen was positive against the U.S. dollar on Thursday as the stock up. Today USD/JPY is ascend 0.02% to 144.660 level.
Another commodity-related currency positive against the U.S dollar, AUD/USD surged 0.02% to 0.64890, and NZD/USD add 0.14 to 0.57440 level.
EUR/USD Intraday: Trend on the upside
Our pivot point is at 0.98930
Preferable Price Action: Take buy positions above pivot level with targets at 0.99750 & 1.00440 in extension.
Alternative Price Action: Below pivot looks for a further downside to 0.98180 & 0.97600.
Comment: RSI above 50 levels and Pairs above 55MA.
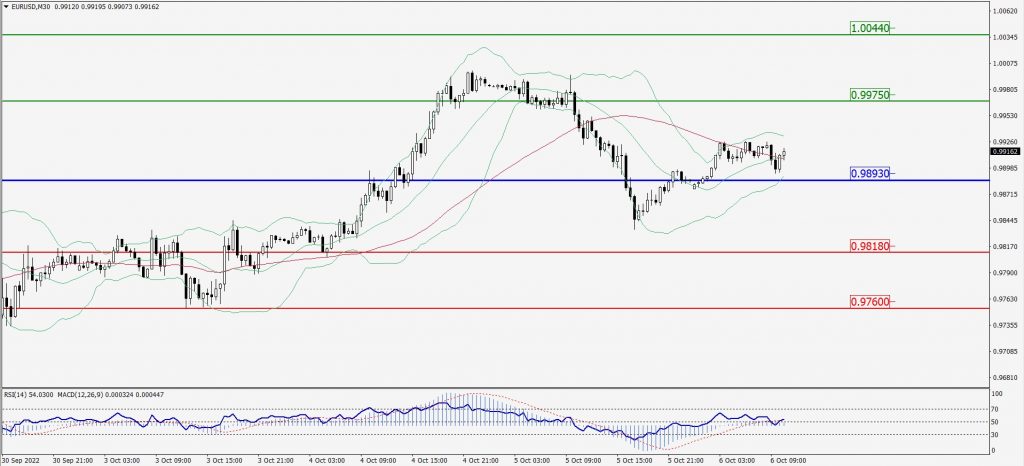
Green Lines Indicate Resistance Levels – Red Lines Indicate Support Levels
Light Blue is a Pivot Point – Black represents the price when the report was produced
GBP/USD Intraday: In a consolidation zone
Our pivot point is at 1.13230
Preferable Price Action: Buy positions above pivot with targets at 1.14780 & 1.16120 in extension.
Alternative Price Action: The price below pivot would call for further downside to 1.11960 & 1.10950.
Comment: RSI at 50 levels.
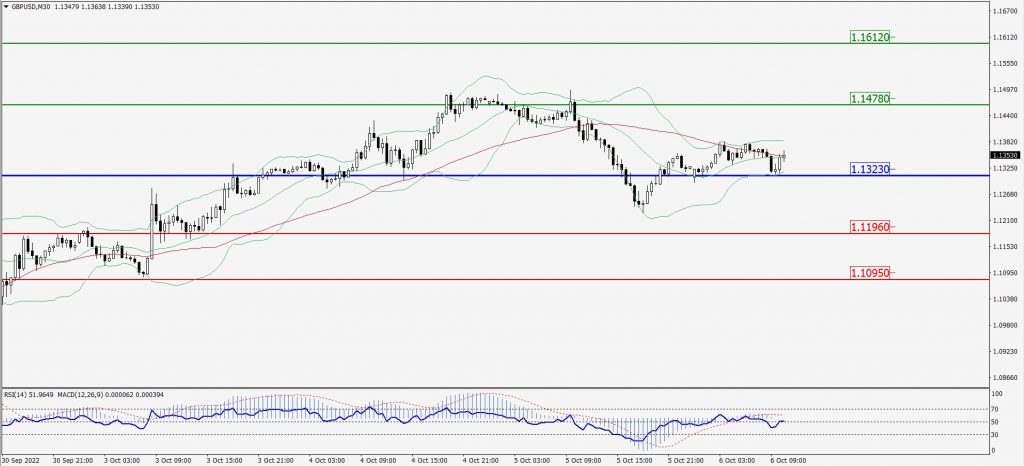
Green Lines Indicate Resistance Levels – Red Lines Indicate Support Levels
Light Blue is a Pivot Point – Black represents the price when the report was produced
USD/JPY Intraday: Trend on the upside
Our pivot point is at 144.510
Preferable Price Action: Buy position above pivot with the target at 144.920 and 145.230 in extension.
Alternative Price Action: The downside breakout of the pivot would call for 144.110 and 143.830.
Comment: MACD is flat territory and Pairs above 55MA.
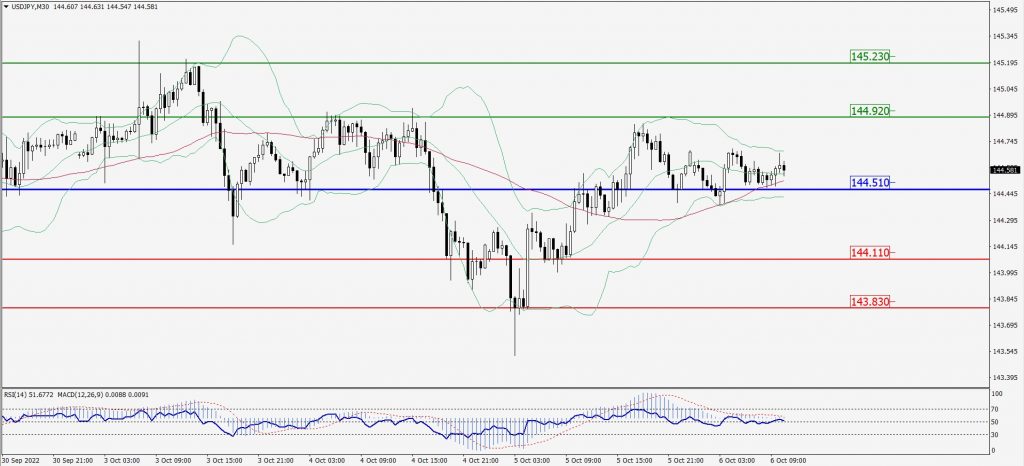
Green Lines Indicate Resistance Levels – Red Lines Indicate Support Levels
Light Blue is a Pivot Point – Black represents the price when the report was produced
AUD/USD Intraday: Trend on the downside
Our pivot point is at 0.65220
Preferable Price Action: Sell Positions below pivot with targets at 0.64710 & 0.64350 in extension.
Alternative Price Action: Above pivot looks for a further upside with 0.65720 & 0.66110 as targets.
Comment: RSI below 50 levels and Pairs below 20MA.
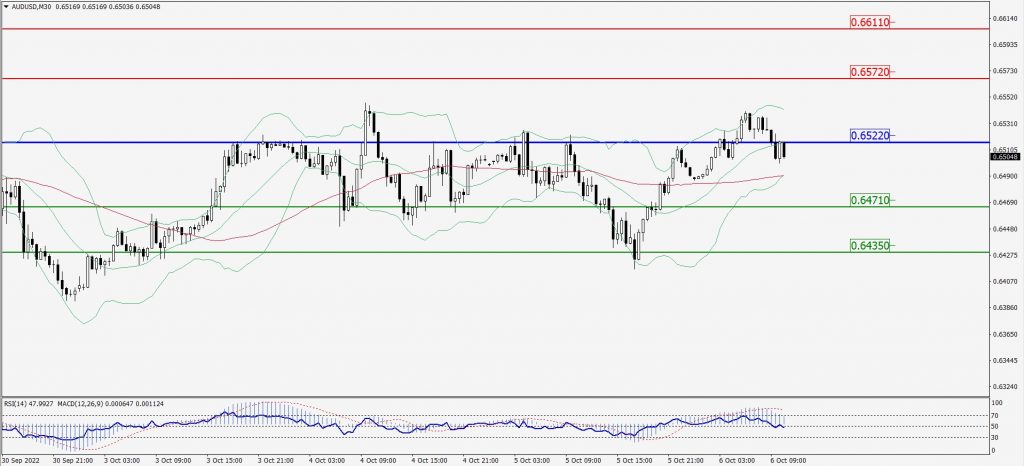
Green Lines Indicate Resistance Levels – Red Lines Indicate Support Levels
Light Blue is a Pivot Point – Black represents the price when the report was produced
CRUDEOIL Intraday: Support level at 86.79
Our pivot point is at 86.79
Preferable Price Action: Above pivots buy oil with 89.88 & 92.04 as targets.
Alternative Price Action: Sell crude below pivot with targets at 83.87 and 81.66 in extension.
Comment: MACD is in the positive territory and Pairs above its 20MA & 55MA.
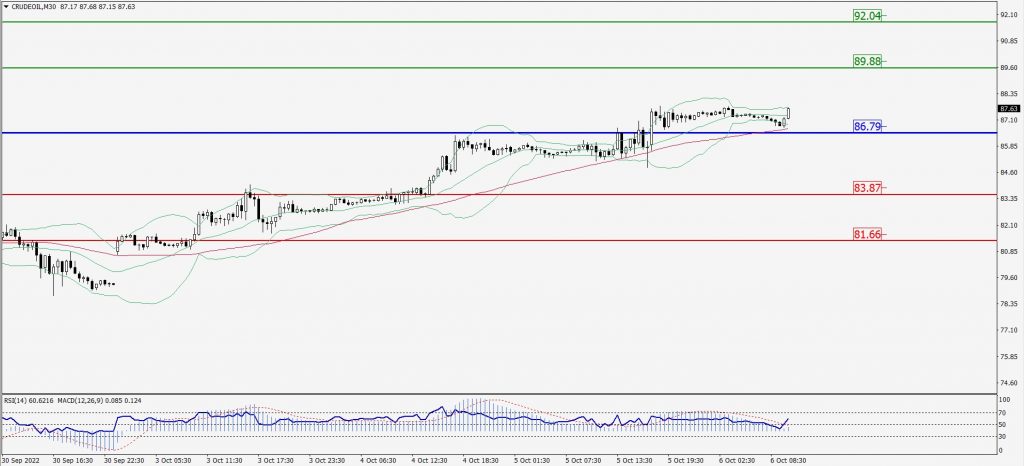
Green Lines Indicate Resistance Levels – Red Lines Indicate Support Levels
Light Blue is a Pivot Point – Black represents the price when the report was produced
XAU/USD Intraday: Trend on the upside
Our pivot point is 1719.90
Preferable Price Action: Further upside to 1748.40 and 1767.10
Alternative Price Action: If the price gives a downside breakout of a pivot, then the price extends to 1694.60 and 1676.60.
Comment: MACD is positive territory and Pairs above its 20MA & 55MA.
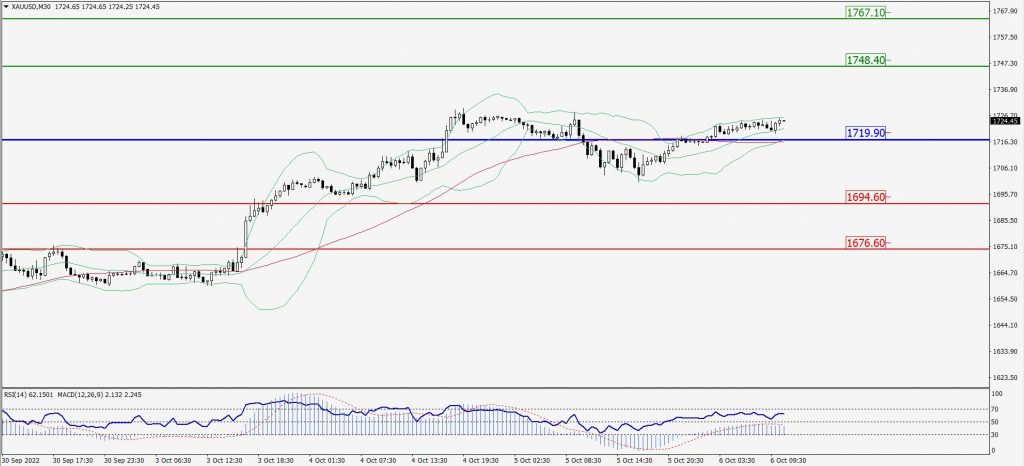
Green Lines Indicate Resistance Levels – Red Lines Indicate Support Levels
Light Blue is a Pivot Point – Black represents the price when the report was produced
Dow Jones Intraday: Resistance level at 30,469.00
Our pivot point is 30,469.00
Preferable Price Action: Take sell positions below pivot with targets at 30,061.00 & 29,750.00.
Alternative Price Action: Above 30,469.00 looks for further upside to 30,793.00 & 31,117.00.
Comment: RSI below 50 levels and Pairs below 20MA.
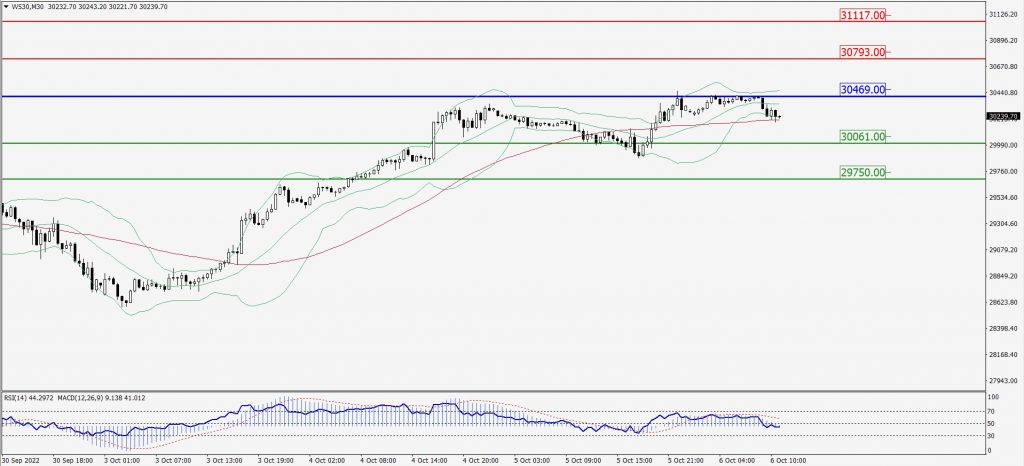
Green Lines Indicate Resistance Levels – Red Lines Indicate Support Levels
Light Blue is a Pivot Point – Black represents the price when the report was produced