Market Wrap: Stocks, Bonds, Commodities
Wall Street stocks closed sharply lower on Tuesday, while bitcoin and gold scaled all-time highs as market participants eyed upcoming economic data and central bank actions.
The Dow Jones Industrial Average fell 404.64 points to 38,585.19, the S&P 500 lose 1.02% to 5,078.65 and the Nasdaq Composite subtract 267.92 points to 15,939.59.
MSCI’s index of Asia-Pacific stocks outside Japan is advance 0.71% to 645.16 levels. The Australian index was higher by 0.12% to 7,733.50. Japanese Nikkei Index ascend 0.06% today.
European stocks were positive on Wednesday, with the Stoxx Europe 50 Index rose 0.38% to 4,911.45, Germany’s DAX ascend 0.18% to 17,725.45, and France’s CAC advance 0.12% to 7,942.49 and U.K.’s FTSE 100 add 0.34% to 7,672.67.
Benchmark 10-year U.S. Treasury fell as deman for safe assets ascend again, today 10-year bond yields positive 0.56% to 4.1590.
Oil prices fell slightly in Asian trade on Wednesday amid persistent concerns over slowing demand this year, although steady production cuts by the OPEC+ and little de-escalation in the Israel-Hamas war heralded tighter supplies.
Spot Brent crude oil ascend 0.73% to $82.64 per barrel. US West Texas Intermediate crude is up 1.01% to $78.95 a barrel.
The yellow metal gold is decline 0.30% to 2,135.45 dollars per ounce.
Market Wrap: Forex
The U.S. dollar was a touch softer on Wednesday, as traders kept their powder dry ahead of the first leg of congressional testimony from Federal Reserve Chair Jerome Powell and the European Central Bank’s policy announcement on Thursday.
Today, the U.S. dollar index measures the Greenback against a trade-weighted basket of six major currencies, which slipped 0.17% to 103.572.
The Euro US Dollar (EUR/USD) is a widely traded pair that is up 0.20% today. This left the pair trading around $1.08760.
The Japanese yen was negative against the U.S. dollar on Wednesday. Today USD/JPY is slipped 0.20% to the 149.750 level.
Another commodity-related currency positive against the U.S dollar, AUD/USD rose 0.32% to 0.65230, and NZD/USD surged 0.26% to 0.61010 level.
EUR/USD Intraday: Trend on the upside
Our pivot point is at 1.08560
Preferable Price Action: Take buy positions above pivot level with targets at 1.08670 & 1.08750 in extension.
Alternative Price Action: Below pivot looks for a further downside to 1.08450 & 1.08370.
Comment: RSI is above 50 levels and Pairs above its 55MA & 20MA.
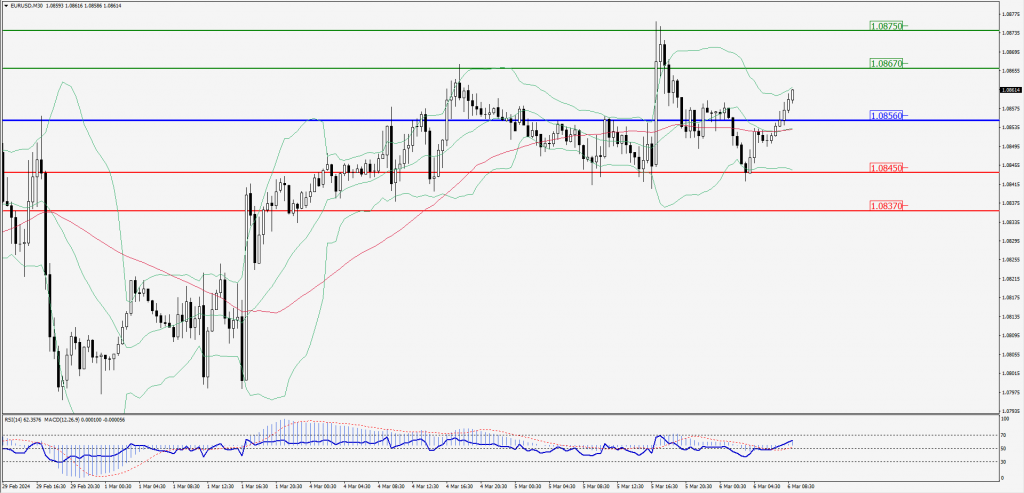
Green Lines Indicate Resistance Levels – Red Lines Indicate Support Levels
Light Blue is a Pivot Point – Black represents the price when the report was produced
GBP/USD Intraday: Trend on the upside
Our pivot point is at 1.27000
Preferable Price Action: Buy positions above pivot with targets at 1.27180 & 1.27300 in extension.
Alternative Price Action: The price below pivot would call for further downside to 1.26800 & 1.26670.
Comment: RSI is above 50 levels and Pairs above its 20MA & 55MA.
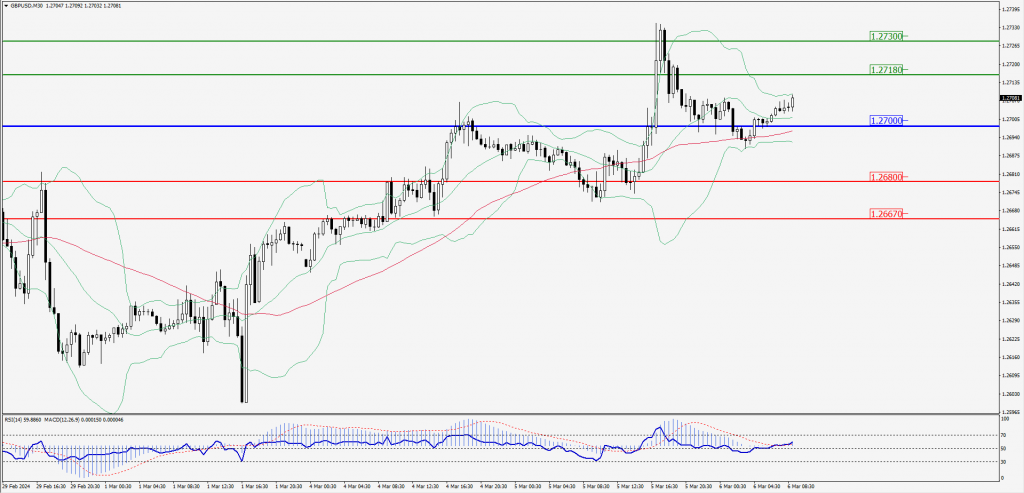
Green Lines Indicate Resistance Levels – Red Lines Indicate Support Levels
Light Blue is a Pivot Point – Black represents the price when the report was produced
USD/JPY Intraday: Major trend on the downside
Our pivot point is at 149.640
Preferable Price Action: Sell position below pivot with the target at 149.450 and 149.310 in extension.
Alternative Price Action: The upside breakout of the pivot would call for 149.840 and 149.990.
Comment: MACD is below 50 level and Pairs below its 20MA & 55MA.

Green Lines Indicate Resistance Levels – Red Lines Indicate Support Levels
Light Blue is a Pivot Point – Black represents the price when the report was produced
AUD/USD Intraday: Trend in the upside
Our pivot point is at 0.65200
Preferable Price Action: Buy positions above pivot with targets at 0.65300 & 0.65370 in extension.
Alternative Price Action: Below pivot looks for a further downside with 0.65100 & 0.65030 as targets.
Comment: RSI is above 50 levels and Pairs above its 20MA & 55MA.
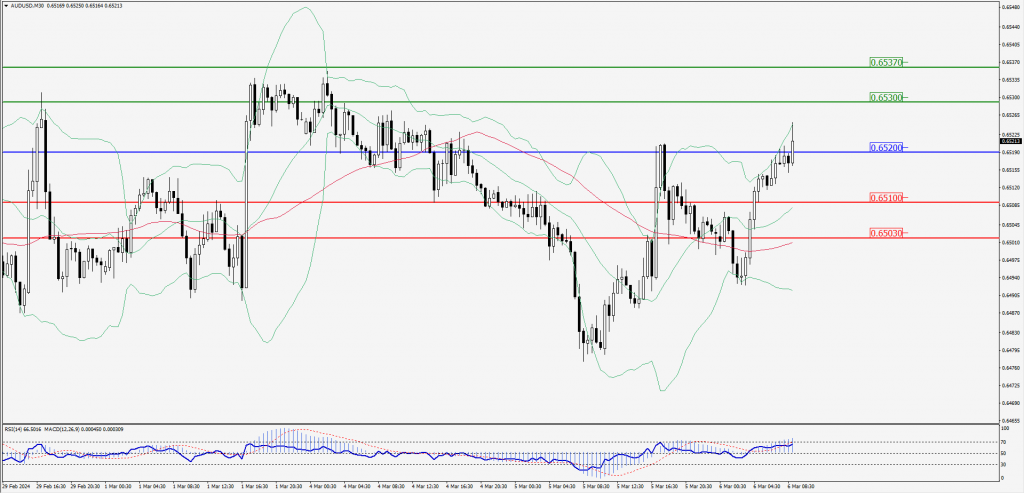
Green Lines Indicate Resistance Levels – Red Lines Indicate Support Levels
Light Blue is a Pivot Point – Black represents the price when the report was produced
CRUDEOIL Intraday: Support level at 77.72
Our pivot point is at 77.72
Preferable Price Action: Above pivot buy oil with 78.33 & 78.70 as targets.
Alternative Price Action: Sell crude below pivot with targets at 77.06 and 76.70 in extension.
Comment: MACD is positive territory and Pairs above 20AM.
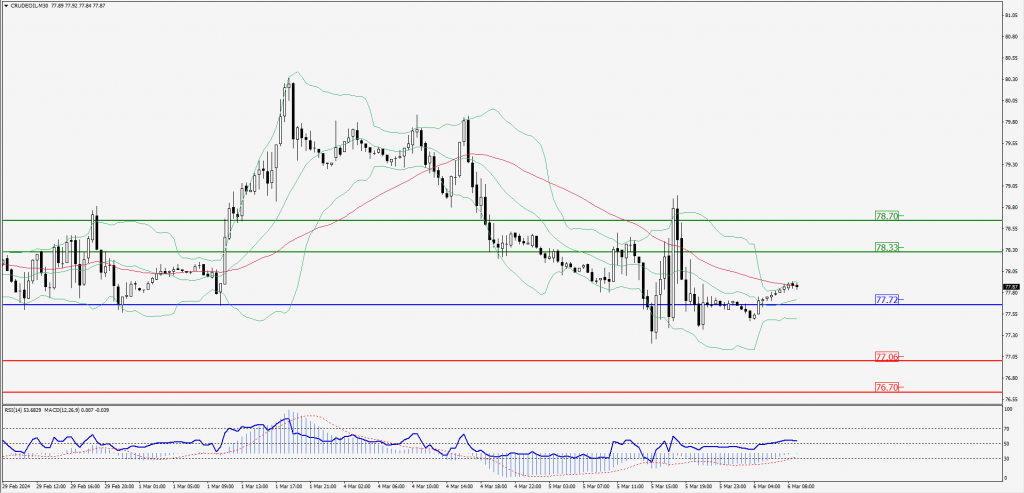
Green Lines Indicate Resistance Levels – Red Lines Indicate Support Levels
Light Blue is a Pivot Point – Black represents the price when the report was produced
XAU/USD Intraday: Trend on the upside
Our pivot point is 2123.80
Preferable Price Action: Further upside to 2140.70 and 2152.20.
Alternative Price Action: If the price gives a downside breakout of a pivot, then the price extends to 2107.30 and 2093.30.
Comment: MACD is above 50 level and Pairs above its 20MA & 55MA.
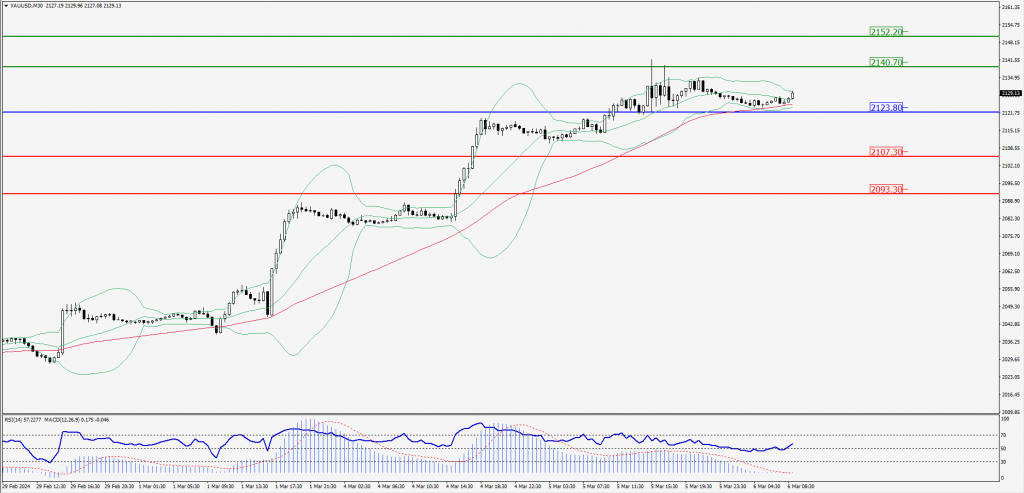
Green Lines Indicate Resistance Levels – Red Lines Indicate Support Levels
Light Blue is a Pivot Point – Black represents the price when the report was produced
Dow Jones Intraday: Trend on the downside
Our pivot point is 38,615.50
Preferable Price Action: Take sell positions below the pivot with targets at 38,516.10 & 38,444.70.
Alternative Price Action: Above 38,615.50 looks for further upside to 38,722.60 & 38,797.20.
Comment: RSI is below 50 levels and Pairs below 55MA.
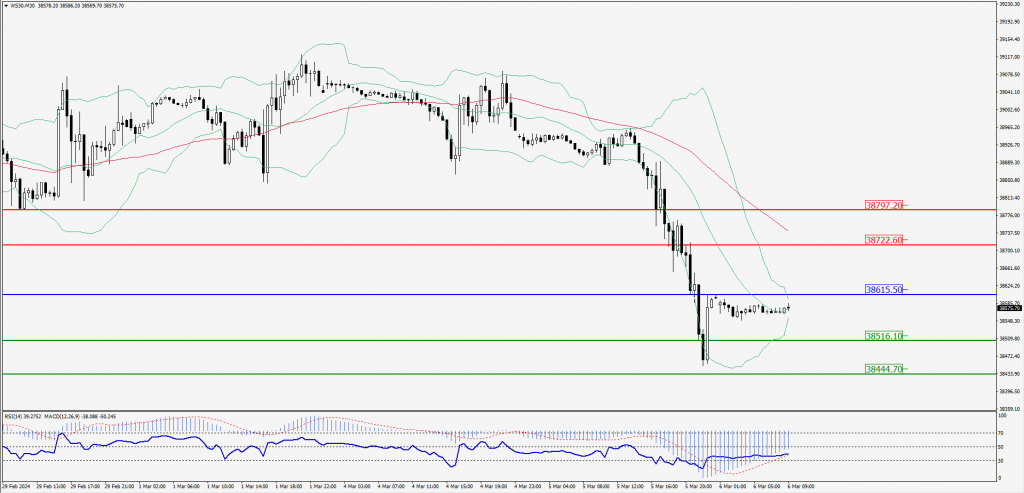
Green Lines Indicate Resistance Levels – Red Lines Indicate Support Levels
Light Blue is a Pivot Point – Black represents the price when the report was produced