Market Wrap: Stocks, Bonds, Commodities
US stocks ended lower on Monday as investors shifted gears after considering the possibility that the Federal Reserve may take longer to start cutting interest rates.
The Dow Jones Industrial Average fell 34.99 points to 33,891.02, the S&P 500 lose 0.61% to 4,111.08 and the Nasdaq Composite subtract 119.50 points to 11,887.45.
MSCI’s index of Asia-Pacific stocks outside Japan is ascend 0.13% to 661.10 levels. The Australian index was lower by 0.46% to 7,504.10. Japanese Nikkei Index fell 0.03% today.
European stocks were mixed on Tuesday, with the Stoxx Europe 50 Index gain 0.01% to 4,206.05, Germany’s DAX lose 0.25% to 15,306.65, and France’s CAC decline 0.07% to 7,131.78, and U.K.’s FTSE 100 add 0.41% to 7,868.20.
Benchmark 10-year U.S. Treasury fell as demand for safe assets ascend again, today 10-year bond yields are negative 0.04% to 3.6300.
Oil prices edged higher in choppy trading on Monday as markets weighed a return in demand from China against supply concerns and fears of slower growth in major economies curbing consumption.
Spot Brent crude oil rose 1.94% to $82.56 per barrel. US West Texas Intermediate crude is up 2.12% to $75.67 a barrel.
The yellow metal gold is advance 0.44% to 1,887.65 dollars per ounce.
Market Wrap: Forex
The dollar eased on Tuesday after its rally the previous day, but still hovered near a one-month peak as traders raised their forecasts of how high the U.S. Federal Reserve would need to raise interest rates to tame inflation.
Today, the U.S. dollar index measures the Greenback against a trade-weighted basket of six major currencies, which slipped 0.00% to 103.498.
The Euro US Dollar (EUR/USD) is a widely traded pair that is down 0.17% today. This left the pair trading around $1.07130.
The Japanese yen was negative against the U.S. dollar on Tuesday. Today USD/JPY is decline 0.55% to the 131.910 level.
Another commodity-related currency positive against the U.S dollar, AUD/USD gain 0.59% to 0.69220, and NZD/USD rose 0.18% to 0.63150 level.
EUR/USD Intraday: Trend on the downside
Our pivot point is at 1.07620
Preferable Price Action: Take short positions below pivot level with targets at 1.06870 & 1.06330 in extension.
Alternative Price Action: Above pivot looks for a further upside to 1.08310 & 1.08840.
Comment: RSI is below 50 levels and Pairs below 55MA.
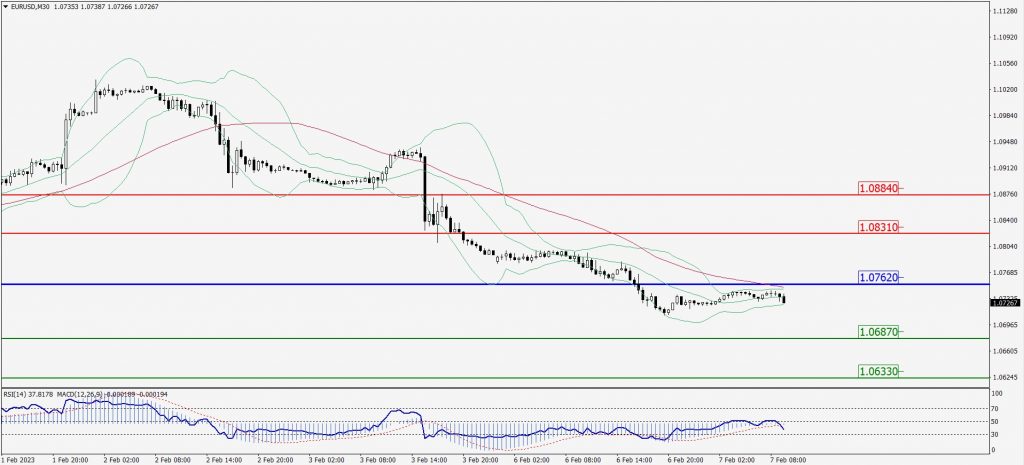
Green Lines Indicate Resistance Levels – Red Lines Indicate Support Levels
Light Blue is a Pivot Point – Black represents the price when the report was produced
GBP/USD Intraday: Resistance level at 1.20680
Our pivot point is at 1.20680
Preferable Price Action: Sell positions below pivot with targets at 1.19810 & 1.19220 in extension.
Alternative Price Action: The price above pivot would call for further upside to 1.21420 & 1.22050.
Comment: RSI is below 50 levels and Pairs below 55MA.
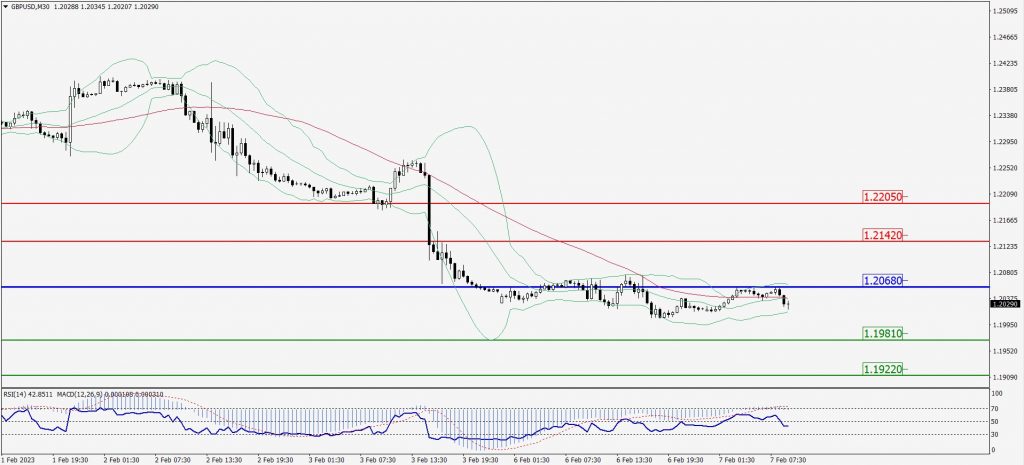
Green Lines Indicate Resistance Levels – Red Lines Indicate Support Levels
Light Blue is a Pivot Point – Black represents the price when the report was produced
USD/JPY Intraday: Trend on the downside
Our pivot point is at 132.490
Preferable Price Action: Sell position below pivot with the target at 131.650 and 131.000 in extension.
Alternative Price Action: The upside breakout of the pivot would call for 133.280 and 133.960.
Comment: MACD is below 50 level and Pairs below its 20MA & 55MA.
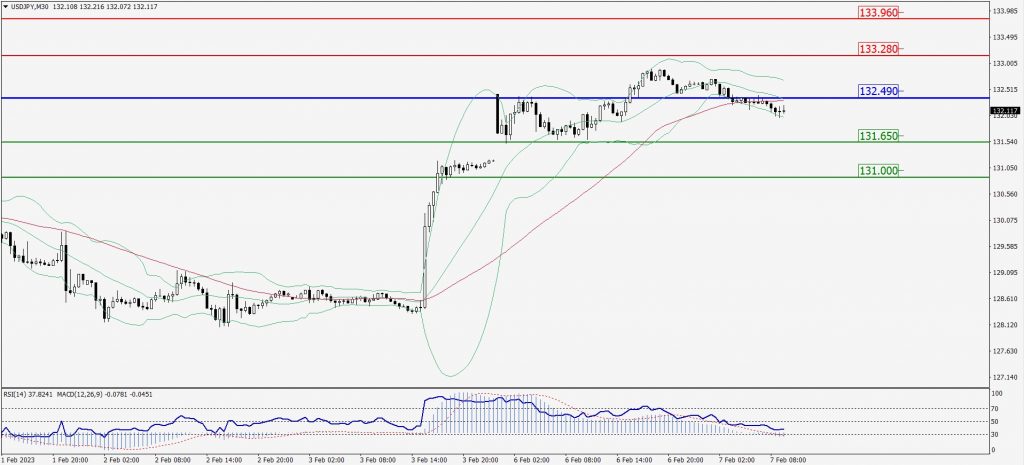
Green Lines Indicate Resistance Levels – Red Lines Indicate Support Levels
Light Blue is a Pivot Point – Black represents the price when the report was produced
AUD/USD Intraday: Trend on the upside
Our pivot point is at 0.69160
Preferable Price Action: Buy positions above pivot with targets at 0.69720 & 0.70200 in extension.
Alternative Price Action: Below pivot looks for a further downside with 0.68640 & 0.68260 as targets.
Comment: RSI is above 50 levels and pairs above its 20MA & 55MA.
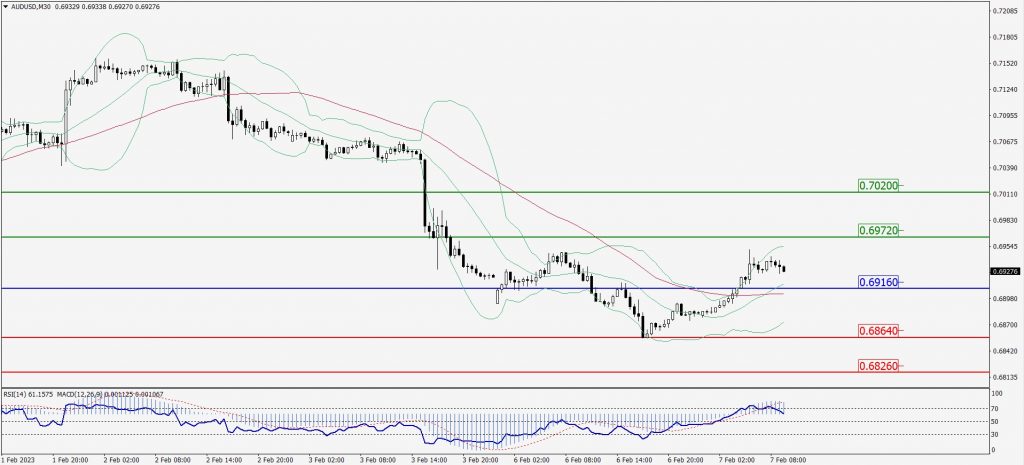
Green Lines Indicate Resistance Levels – Red Lines Indicate Support Levels
Light Blue is a Pivot Point – Black represents the price when the report was produced
CRUDEOIL Intraday: Major trend on the upside
Our pivot point is at 75.52
Preferable Price Action: Above pivot buy oil with 76.78 & 77.66 as targets.
Alternative Price Action: Sell crude below pivot with targets at 74.47 and 73.56 in extension.
Comment: MACD is positive territory and Pairs above its 20MA & 55MA.
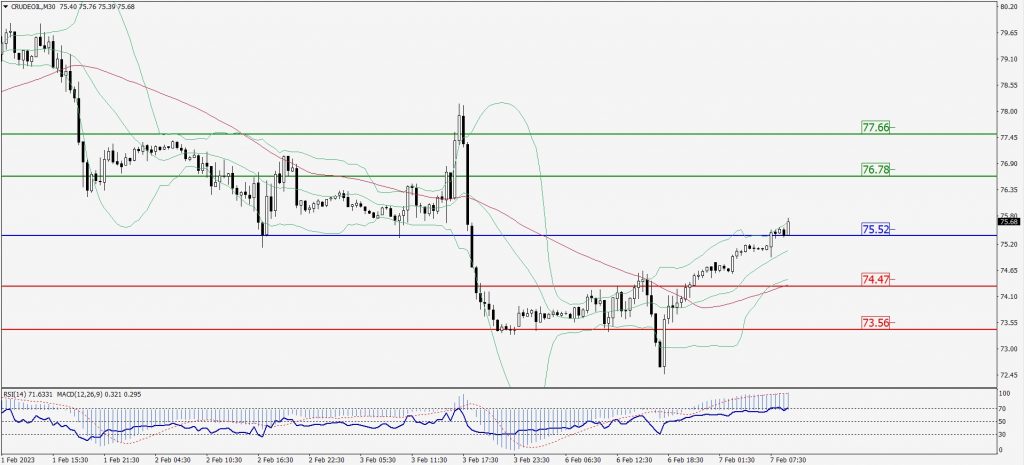
Green Lines Indicate Resistance Levels – Red Lines Indicate Support Levels
Light Blue is a Pivot Point – Black represents the price when the report was produced
XAU/USD Intraday: Support level at 1874.20
Our pivot point is 1874.20
Preferable Price Action: Further upside to 1893.60 and 1907.80
Alternative Price Action: If the price gives a downside breakout of a pivot, then the price extends to 1856.10 and 1842.90.
Comment: MACD is above 50 level and Pairs above its 20MA & 55MA.
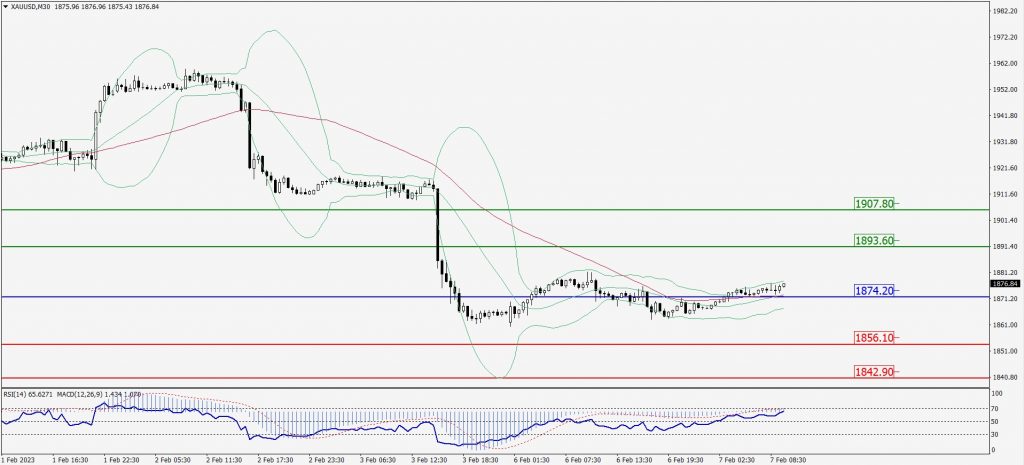
Green Lines Indicate Resistance Levels – Red Lines Indicate Support Levels
Light Blue is a Pivot Point – Black represents the price when the report was produced
Dow Jones Intraday: In a consolidation zone
Our pivot point is 33,868.00
Preferable Price Action: Take buy positions above the pivot with targets at 33,988.00 & 34,089.00.
Alternative Price Action: Below 33,868.00 looks for further downside to 33,763.00 & 33,673.00.
Comment: RSI is at 50 levels and Pairs above 55MA.
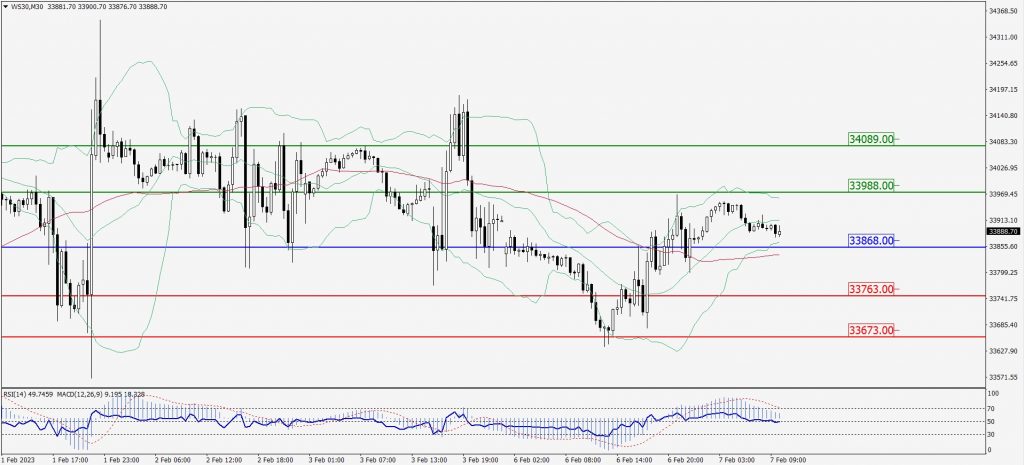
Green Lines Indicate Resistance Levels – Red Lines Indicate Support Levels
Light Blue is a Pivot Point – Black represents the price when the report was produced