Market Wrap: Stocks, Bonds, Commodities
US stocks rallied to a convincingly higher close on Tuesday, but trade was choppy as investors digested comments from Federal Reserve Chair Jerome Powell about how long the central bank might need to tame inflation.
The Dow Jones Industrial Average rose 265.67 points to 34,156.69, the S&P 500 gain 1.29% to 4,164.00 and the Nasdaq Composite add 226.34 points to 12,113.79.
MSCI’s index of Asia-Pacific stocks outside Japan is ascend 0.41% to 664.57 levels. The Australian index was higher by 0.35% to 7,530.10. Japanese Nikkei Index fell 0.29% today.
European stocks were mixed on Wednesday, with the Stoxx Europe 50 Index gain 0.09% to 4,209.31, Germany’s DAX lose 0.16% to 15,320.88, and France’s CAC decline 0.07% to 7,132.35, and U.K.’s FTSE 100 add 0.36% to 7,864.71.
Benchmark 10-year U.S. Treasury fell as demand for safe assets ascend again, today 10-year bond yields are negative 0.64% to 3.6510.
Oil prices climbed more than 3 percent on Tuesday after the head of the US central bank eased market concerns over interest rate hikes, while recovering demand in China also boosted prices.
Spot Brent crude oil rose 0.23% to $83.88 per barrel. US West Texas Intermediate crude is up 0.40% to $77.46 a barrel.
The yellow metal gold is advance 0.50% to 1,894.15 dollars per ounce.
Market Wrap: Forex
The U.S. dollar edged lower in early European trade Wednesday, retreating after a relatively dovish speech from Fed chair Jerome Powell raised hopes the central bank may soon ease monetary policy.
Today, the U.S. dollar index measures the Greenback against a trade-weighted basket of six major currencies, which slipped 0.24% to 103.040.
The Euro US Dollar (EUR/USD) is a widely traded pair that is up 0.21% today. This left the pair trading around $1.07460.
The Japanese yen was negative against the U.S. dollar on Wednesday. Today USD/JPY is decline 0.07% to the 130.970 level.
Another commodity-related currency positive against the U.S dollar, AUD/USD gain 0.35% to 0.69840, and NZD/USD rose 0.22% to 0.63360 level.
EUR/USD Intraday: Support level at 1.07200
Our pivot point is at 1.07200
Preferable Price Action: Take long positions above pivot level with targets at 1.07890 & 1.08470 in extension.
Alternative Price Action: Below pivot looks for a further downside to 1.06570 & 1.06030.
Comment: RSI is at 50 levels and Pairs above 55MA.
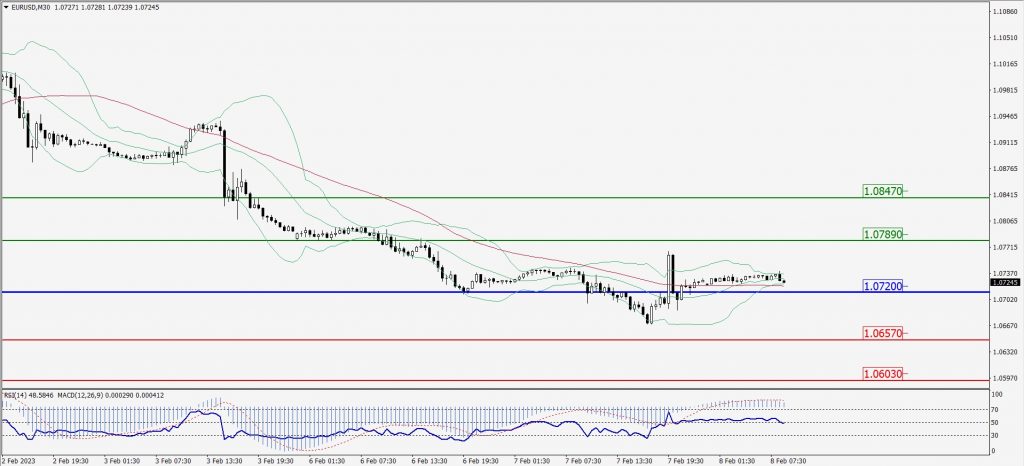
Green Lines Indicate Resistance Levels – Red Lines Indicate Support Levels
Light Blue is a Pivot Point – Black represents the price when the report was produced
GBP/USD Intraday: Resistance level at 1.20680
Our pivot point is at 1.20680
Preferable Price Action: Sell positions below pivot with targets at 1.19810 & 1.19220 in extension.
Alternative Price Action: The price above pivot would call for further upside to 1.21420 & 1.22050.
Comment: RSI is at 50 levels and Pairs below 20MA.
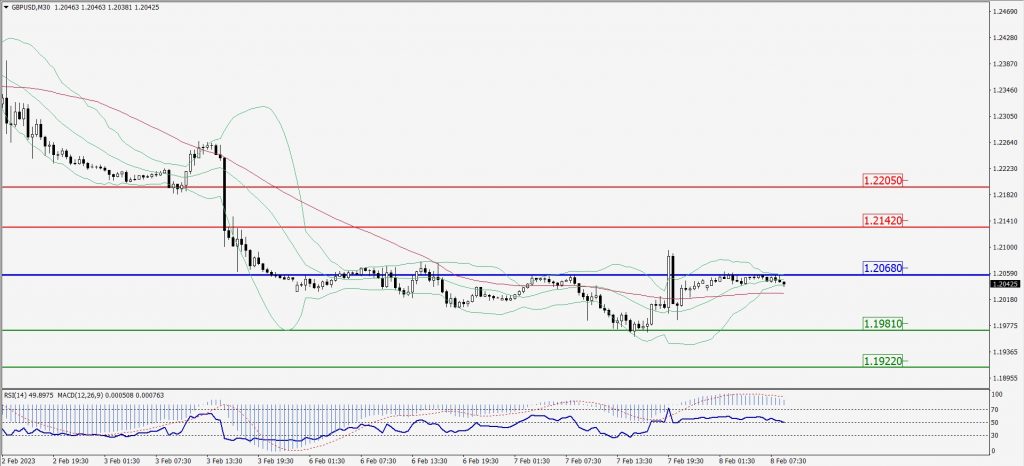
Green Lines Indicate Resistance Levels – Red Lines Indicate Support Levels
Light Blue is a Pivot Point – Black represents the price when the report was produced
USD/JPY Intraday: Trend on the upside
Our pivot point is at 131.130
Preferable Price Action: Buy position above pivot with the target at 132.090 and 132.900 in extension.
Alternative Price Action: The downside breakout of the pivot would call for 130.310 and 129.640.
Comment: MACD is above 50 level and Pairs above 20MA.
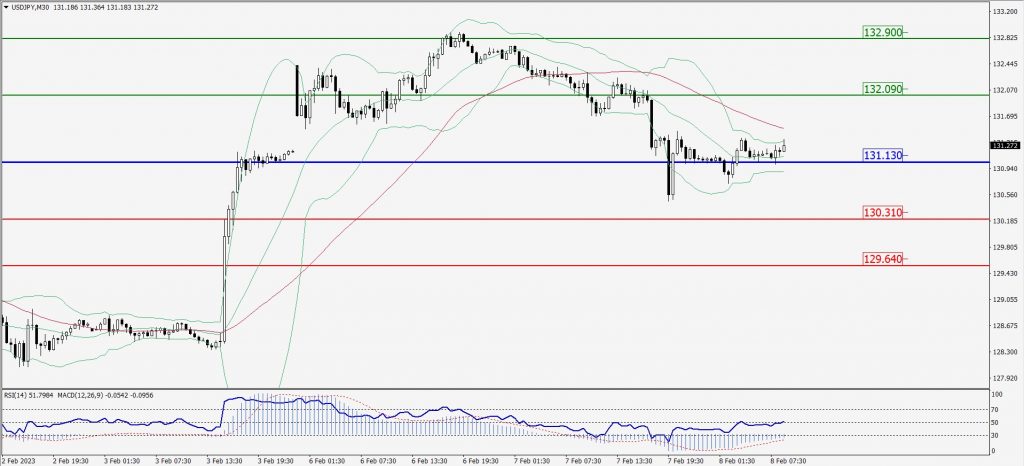
Green Lines Indicate Resistance Levels – Red Lines Indicate Support Levels
Light Blue is a Pivot Point – Black represents the price when the report was produced
AUD/USD Intraday: Trend on the upside
Our pivot point is at 0.69610
Preferable Price Action: Buy positions above pivot with targets at 0.70070 & 0.70450 in extension.
Alternative Price Action: Below pivot looks for a further downside with 0.69180 & 0.68820 as targets.
Comment: RSI is above 50 levels and pairs above its 20MA & 55MA.
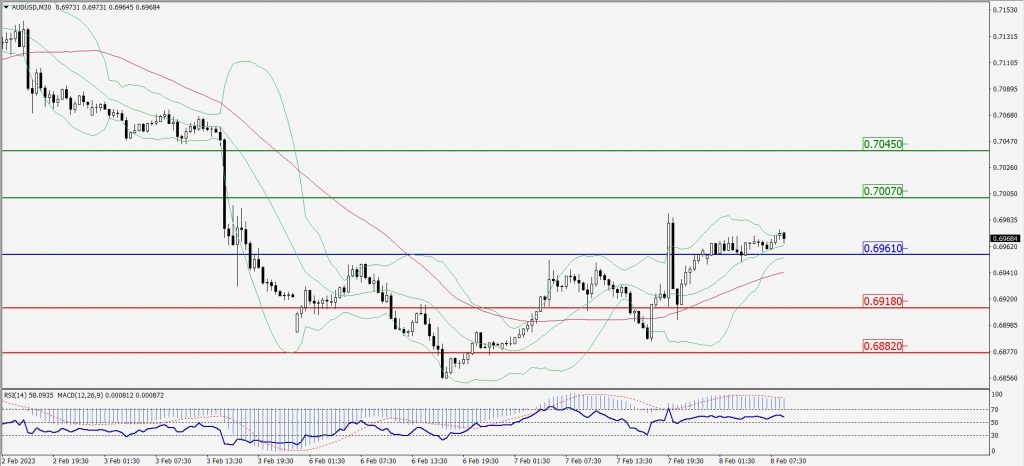
Green Lines Indicate Resistance Levels – Red Lines Indicate Support Levels
Light Blue is a Pivot Point – Black represents the price when the report was produced
CRUDEOIL Intraday: Trend on the upside
Our pivot point is at 77.11
Preferable Price Action: Above pivot buy oil with 78.14 & 78.96 as targets.
Alternative Price Action: Sell crude below pivot with targets at 76.17 and 75.38 in extension.
Comment: MACD is positive territory and Pairs above 55MA.
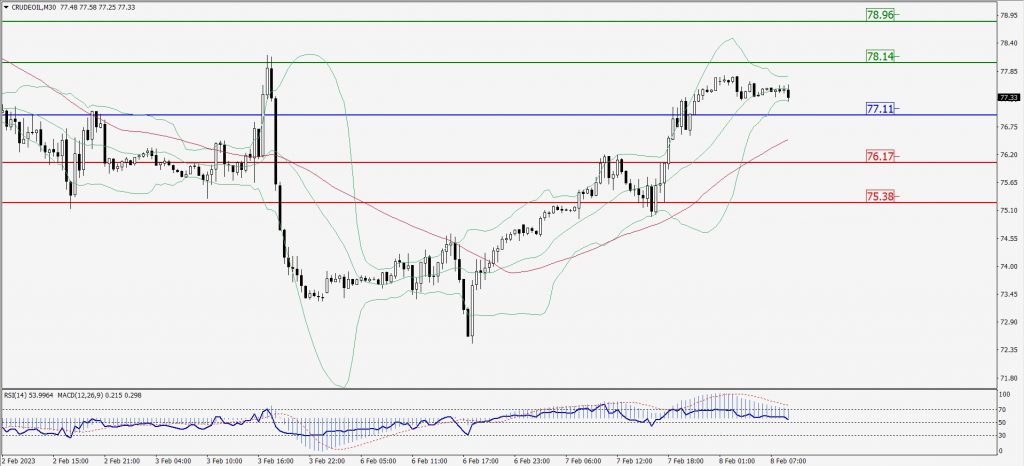 0
0
Green Lines Indicate Resistance Levels – Red Lines Indicate Support Levels
Light Blue is a Pivot Point – Black represents the price when the report was produced
XAU/USD Intraday: In a consolidation zone
Our pivot point is 1880.20
Preferable Price Action: Further downside to 1862.20 and 1848.00
Alternative Price Action: If the price gives an upside breakout of a pivot, then the price extends to 1896.10 and 1909.90.
Comment: MACD is at 50 level.
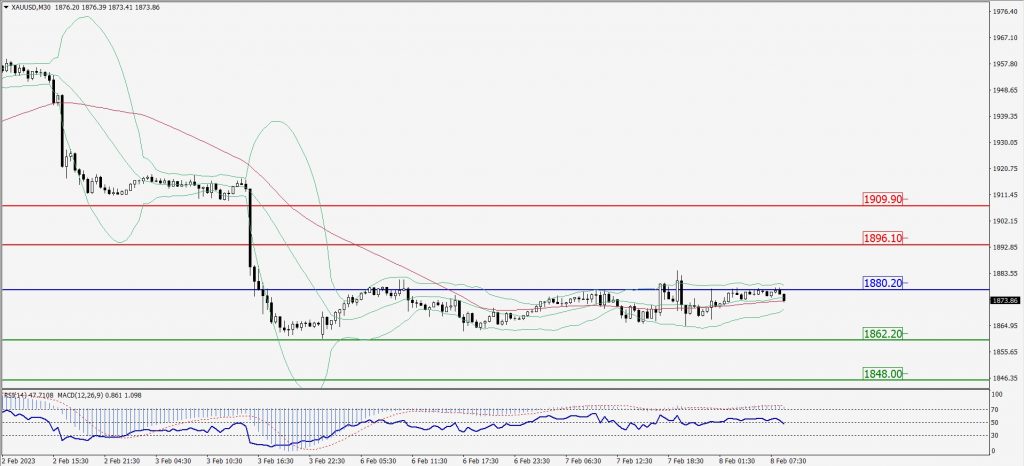
Green Lines Indicate Resistance Levels – Red Lines Indicate Support Levels
Light Blue is a Pivot Point – Black represents the price when the report was produced
Dow Jones Intraday: Trend on the upside
Our pivot point is 34,097.00
Preferable Price Action: Take buy positions above the pivot with targets at 34,187.00 & 34,250.00.
Alternative Price Action: Below 34,097.00 looks for further downside to 34,019.00 & 33,955.00.
Comment: RSI is above 50 levels and Pairs above 55MA.
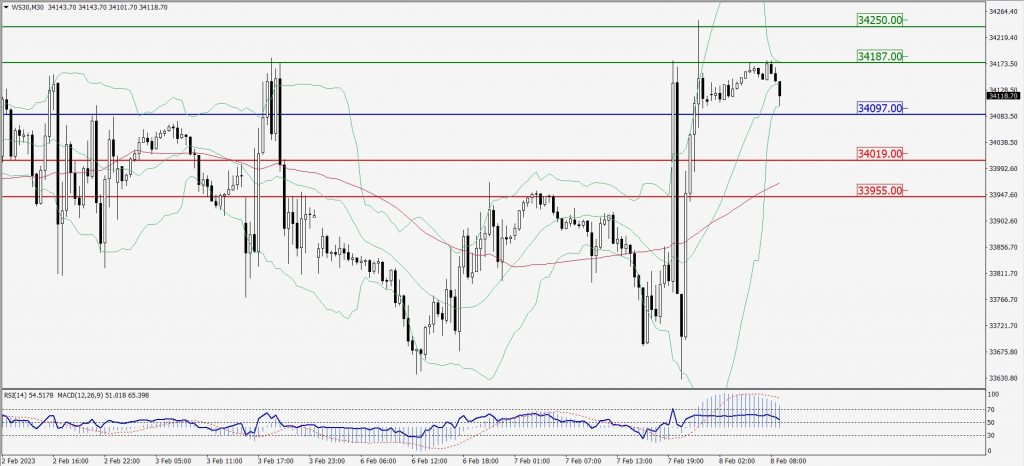
Green Lines Indicate Resistance Levels – Red Lines Indicate Support Levels
Light Blue is a Pivot Point – Black represents the price when the report was produced