Market Wrap: Stocks, Bonds, Commodities
A gauge of global stocks dropped more than 1 percent, while US Treasury yields and the dollar gained on Friday after a shockingly strong US jobs report renewed concerns the Federal Reserve may remain aggressive in its path of interest rate hikes as it tries to tame inflation.
The Dow Jones Industrial Average fell 127.93 points to 33,926.01, the S&P 500 lose 1.04% to 4,136.48 and the Nasdaq Composite subtract 193.86 points to 12,006.96.
MSCI’s index of Asia-Pacific stocks outside Japan is decline 2.38% to 660.52 levels. The Australian index was lower by 0.25% to 7,539.00. Japanese Nikkei Index rose 0.67% today.
European stocks were negative on Monday, with the Stoxx Europe 50 Index fell 0.70% to 4,228.25, Germany’s DAX lose 0.59% to 15,385.42, and France’s CAC decline 0.71% to 7,182.50, and U.K.’s FTSE 100 subtract 0.46% to 7,865.70.
Benchmark 10-year U.S. Treasury fell as demand for safe assets ascend again, today 10-year bond yields are positive 0.68% to 3.5560.
Oil prices inched up in early trade on Monday after falling around 8 percent last week to more than three-week lows as jitters over major economies outweighed signs of a demand recovery in China, the world’s top oil importer.
Spot Brent crude oil rose 0.64% to $80.45 per barrel. US West Texas Intermediate crude is up 0.42% to $73.70 a barrel.
The yellow metal gold is advance 0.70% to 1,890.05 dollars per ounce.
Market Wrap: Forex
Asian currencies sank on Monday, while the dollar rose as stronger-than-expected U.S. payrolls data brewed concerns that the Federal Reserve will be able to keep raising interest rates for longer, while worsening Sino-U.S. ties also weighed.
Today, the U.S. dollar index measures the Greenback against a trade-weighted basket of six major currencies, which surge 0.24% to 102.995.
The Euro US Dollar (EUR/USD) is a widely traded pair that is down 0.05% today. This left the pair trading around $1.07870.
The Japanese yen was negative against the U.S. dollar on Monday. Today USD/JPY is advance 0.51% to the 131.830 level.
Another commodity-related currency mix against the U.S dollar, AUD/USD gain 0.13% to 0.69270, and NZD/USD fell 0.11% to 0.63250 level.
EUR/USD Intraday: Trend on the downside
Our pivot point is at 1.08210
Preferable Price Action: Take short positions below pivot level with targets at 1.07600 & 1.07140 in extension.
Alternative Price Action: Above pivot looks for a further upside to 1.08770 & 1.09240.
Comment: RSI is below 50 levels and Pairs below 55MA.
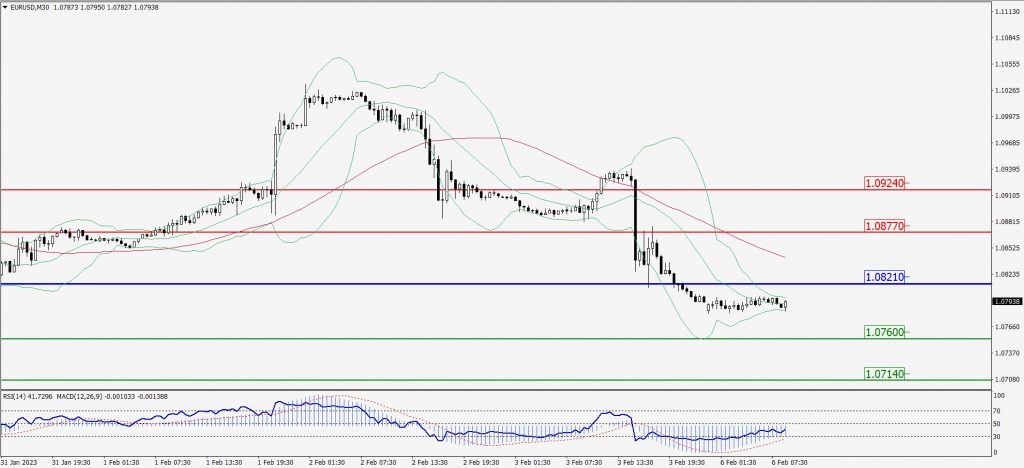
Green Lines Indicate Resistance Levels – Red Lines Indicate Support Levels
Light Blue is a Pivot Point – Black represents the price when the report was produced
GBP/USD Intraday: Trend on the downside
Our pivot point is at 1.200970
Preferable Price Action: Sell positions below pivot with targets at 1.20340 & 1.19790 in extension.
Alternative Price Action: The price above pivot would call for further upside to 1.21540 & 1.22110.
Comment: RSI is below 50 levels and Pairs below 55MA.
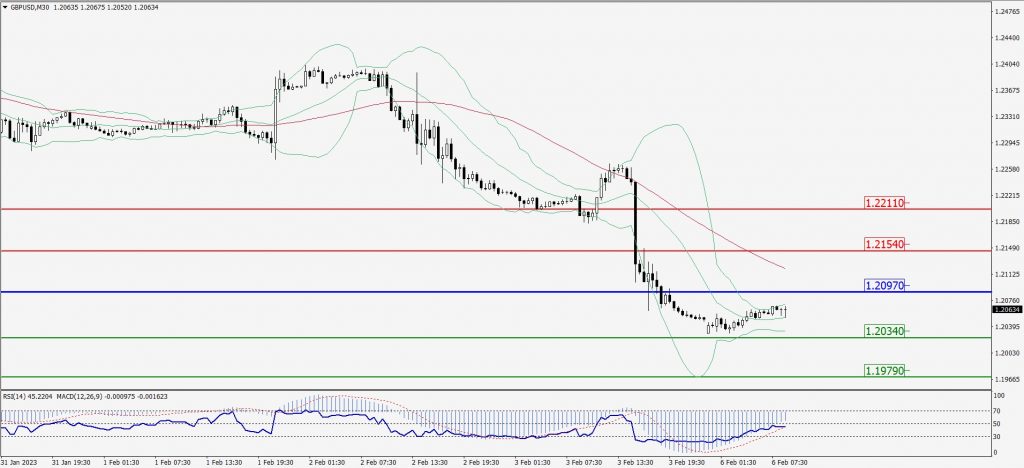
Green Lines Indicate Resistance Levels – Red Lines Indicate Support Levels
Light Blue is a Pivot Point – Black represents the price when the report was produced
USD/JPY Intraday: Major trend on the upside
Our pivot point is at 131.490
Preferable Price Action: Buy position above pivot with the target at 132.170 and 132.630 in extension.
Alternative Price Action: The downside breakout of the pivot would call for 130.880 and 130.410.
Comment: MACD is above 50 level and Pairs above 55MA.
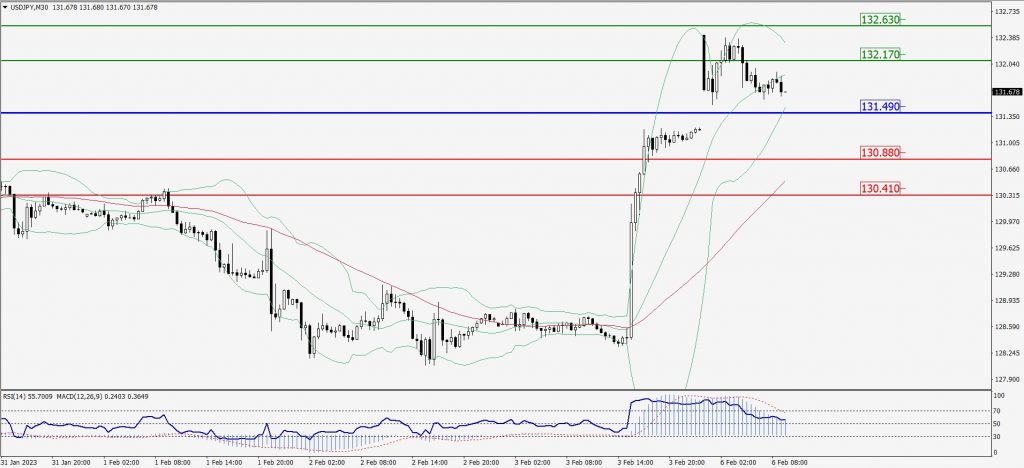
Green Lines Indicate Resistance Levels – Red Lines Indicate Support Levels
Light Blue is a Pivot Point – Black represents the price when the report was produced
AUD/USD Intraday: Resistance level at 0.69530
Our pivot point is at 0.69530
Preferable Price Action: Sell positions below pivot with targets at 0.69140 & 0.68820 in extension.
Alternative Price Action: Above pivot looks for a further upside with 0.69890 & 0.70200 as targets.
Comment: RSI is below 50 levels and pairs below 55MA.
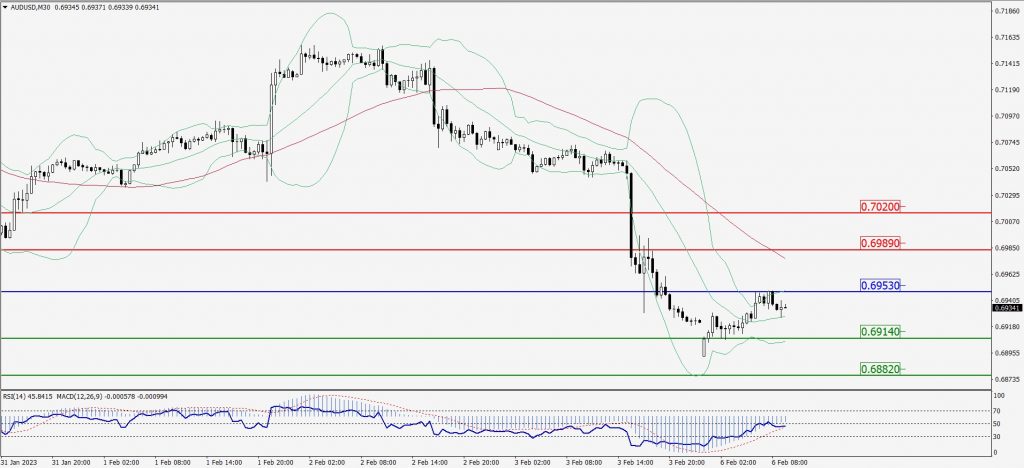
Green Lines Indicate Resistance Levels – Red Lines Indicate Support Levels
Light Blue is a Pivot Point – Black represents the price when the report was produced
CRUDEOIL Intraday: Trend on the upside
Our pivot point is at 73.93
Preferable Price Action: Above pivot buy oil with 75.08 & 76.06 as targets.
Alternative Price Action: Sell crude below pivot with targets at 73.08 and 72.26 in extension.
Comment: MACD is positive territory and Pairs above 20MA.
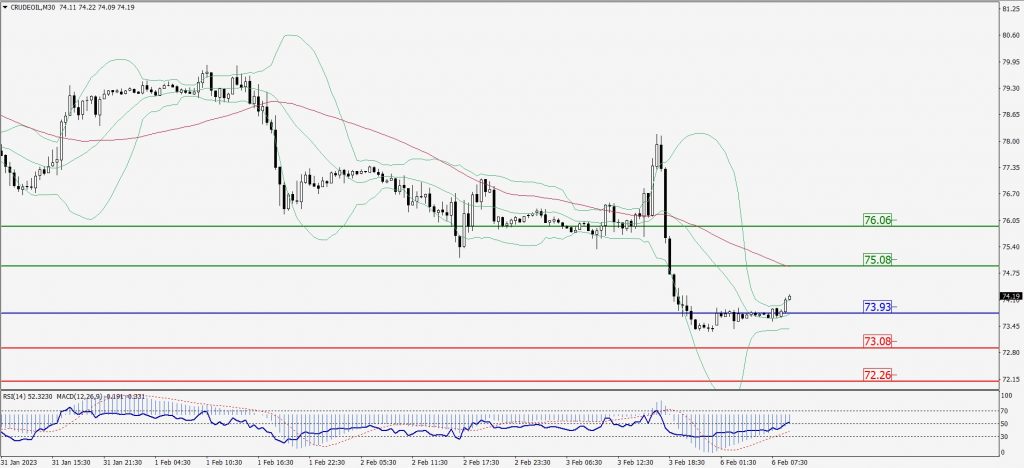
Green Lines Indicate Resistance Levels – Red Lines Indicate Support Levels
Light Blue is a Pivot Point – Black represents the price when the report was produced
XAU/USD Intraday: Trend on the downside
Our pivot point is 1881.70
Preferable Price Action: Further downside to 1864.40 and 1851.30
Alternative Price Action: If the price gives an upside breakout of a pivot, then the price extends to 1897.30 and 1912.40.
Comment: MACD is below 50 level and Pairs below 55MA.
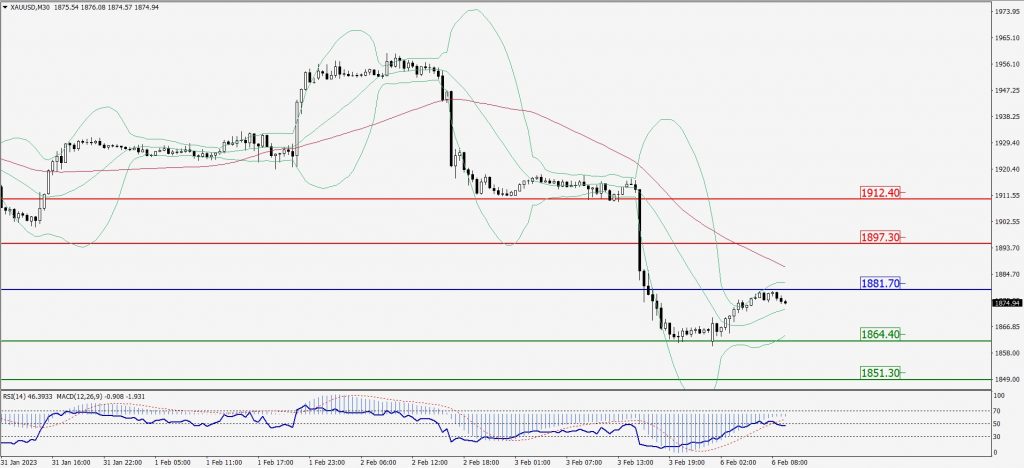
Green Lines Indicate Resistance Levels – Red Lines Indicate Support Levels
Light Blue is a Pivot Point – Black represents the price when the report was produced
Dow Jones Intraday: Trend on the downside
Our pivot point is 33,852.00
Preferable Price Action: Take sell positions below the pivot with targets at 33,722.00 & 33,621.00.
Alternative Price Action: Above 33,852.00 looks for further upside to 33,968.00 & 34,066.00.
Comment: RSI is below 50 levels and Pairs below its 20MA & 55MA.
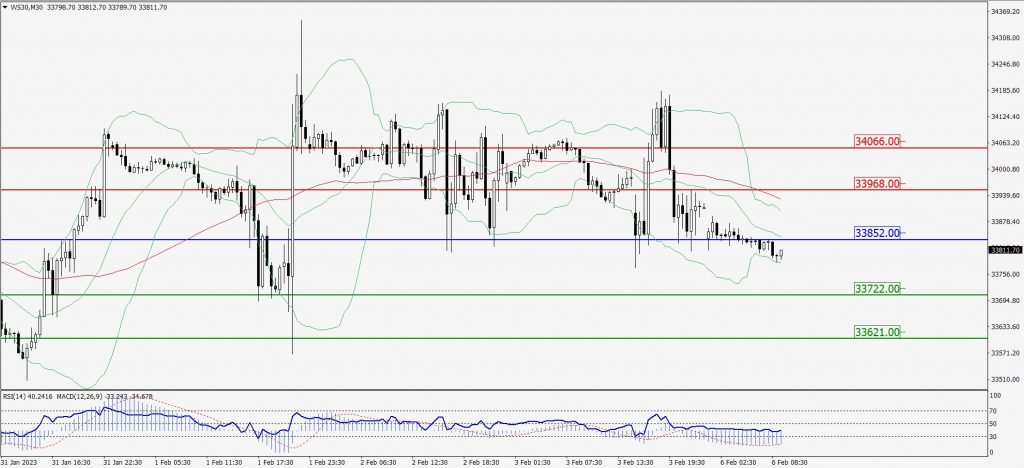
Green Lines Indicate Resistance Levels – Red Lines Indicate Support Levels
Light Blue is a Pivot Point – Black represents the price when the report was produced