Market Wrap: Stocks, Bonds, Commodities
Wall Street ended lower on Tuesday, with the S&P 500 extending its losing streak to four sessions, as skittish investors fretted over Federal Reserve rate hikes and further talk of a looming recession.
The Dow Jones Industrial Average fell 350.76 points to 33,596.34, the S&P 500 lose 1.44% to 3,941.26 and the Nasdaq Composite subtract 225.05 points to 11,014.89.
MSCI’s index of Asia-Pacific stocks outside Japan is drop 1.63% to 618.33 levels. The Australian index was lower by 0.85% to 7,229.40. Japanese Nikkei Index lose 0.72% today.
European stocks were mixed on Wednesday, with the Stoxx Europe 50 Index fell 0.04% to 3,937.55, Germany’s DAX gain 0.02% to 14,346.75, and France’s CAC advance 0.02% to 6,689.89, and U.K.’s FTSE 100 add 0.23% to 7,540.25.
Benchmark 10-year U.S. Treasury fell as demand for safe assets ascend again, today 10-year bond yields are positive 0.11% to 3.517.
US oil prices fell in frenzied trading on Tuesday to their lowest settlement levels this year, with Brent finishing below $80 per barrel for the second time in 2022, as investors fled the volatile market in an uncertain economy.
Spot Brent crude oil fell 0.40% to $79.04 per barrel. US West Texas Intermediate crude is down 0.42% to $73.95 a barrel.
The yellow metal gold is advance 0.26% to 1,787.10 dollars per ounce.
Market Wrap: Forex
The U.S. dollar climbed in early European trade Wednesday, as increased recessionary concerns hit risk sentiment, boosting this safe haven.
Today, the U.S. dollar index measures the Greenback against a trade-weighted basket of six major currencies, which slipped 0.02% to 105.520.
The Euro US Dollar (EUR/USD) is a widely traded pair that is up 0.06% today. This left the pair trading around $1.04760.
The Japanese yen was negative against the U.S. dollar on Wednesday. Today USD/JPY is ascend 0.30% to the 137.450 level.
Another commodity-related currency positive against the U.S dollar, AUD/USD rose 0.02% to 0.66950, and NZD/USD gain 0.22% to 0.63340 level.
EUR/USD Intraday: Trend on the downside
Our pivot point is at 1.04800
Preferable Price Action: Take short positions below pivot level with targets at 1.04250 & 1.03870 in extension.
Alternative Price Action: Above pivot looks for a further upside to 1.05310 & 1.05730.
Comment: RSI below 50 levels and Pairs below its 20MA & 55MA.
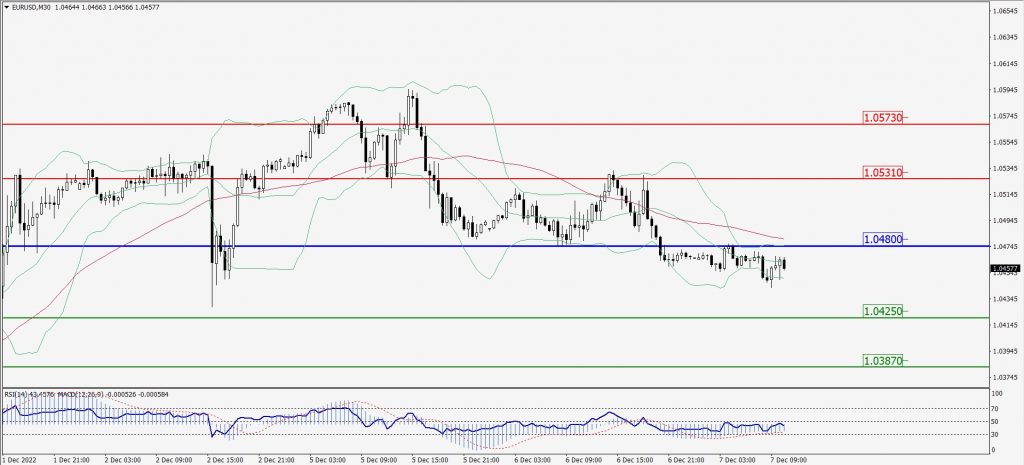
Green Lines Indicate Resistance Levels – Red Lines Indicate Support Levels
Light Blue is a Pivot Point – Black represents the price when the report was produced
GBP/USD Intraday: In a consolidation zone
Our pivot point is at 1.21690
Preferable Price Action: Sell positions below pivot with targets at 1.21000 & 1.20500 in extension.
Alternative Price Action: The price above pivot would call for further upside to 1.22320 & 1.22850.
Comment: RSI below 50 levels and Pairs below 55MA.
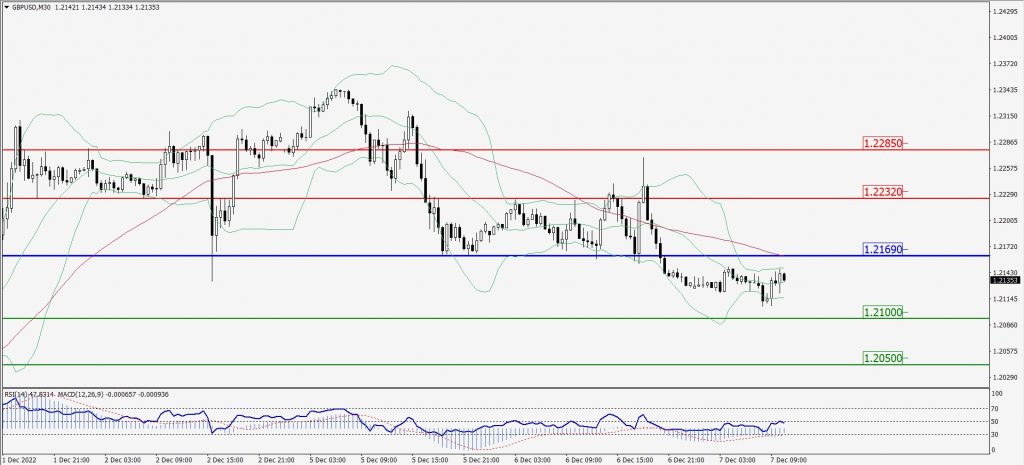
Green Lines Indicate Resistance Levels – Red Lines Indicate Support Levels
Light Blue is a Pivot Point – Black represents the price when the report was produced
USD/JPY Intraday: Trend on the upside
Our pivot point is at 137.460
Preferable Price Action: Buy position above pivot with the target at 138.430 and 139.210 in extension.
Alternative Price Action: The downside breakout of the pivot would call for 136.630 and 135.940.
Comment: MACD is positive territory and Pairs above its 20MA & 55MA.
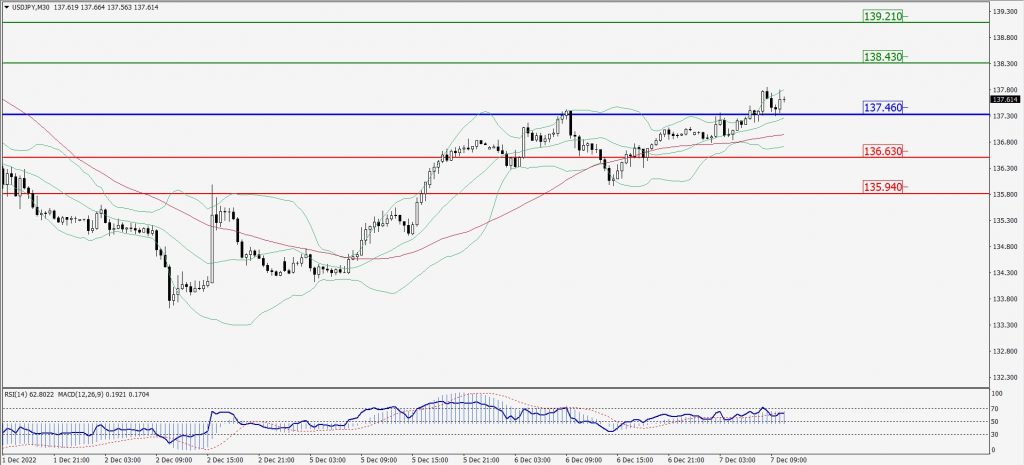
Green Lines Indicate Resistance Levels – Red Lines Indicate Support Levels
Light Blue is a Pivot Point – Black represents the price when the report was produced
AUD/USD Intraday: Resistance level at 0.67030
Our pivot point is at 0.67030
Preferable Price Action: Sell Positions below pivot with targets at 0.66510 & 0.66140 in extension.
Alternative Price Action: Above pivot looks for a further upside with 0.67500 & 0.67910 as targets.
Comment: RSI below 50 levels and Pairs below its 20MA & 55MA.
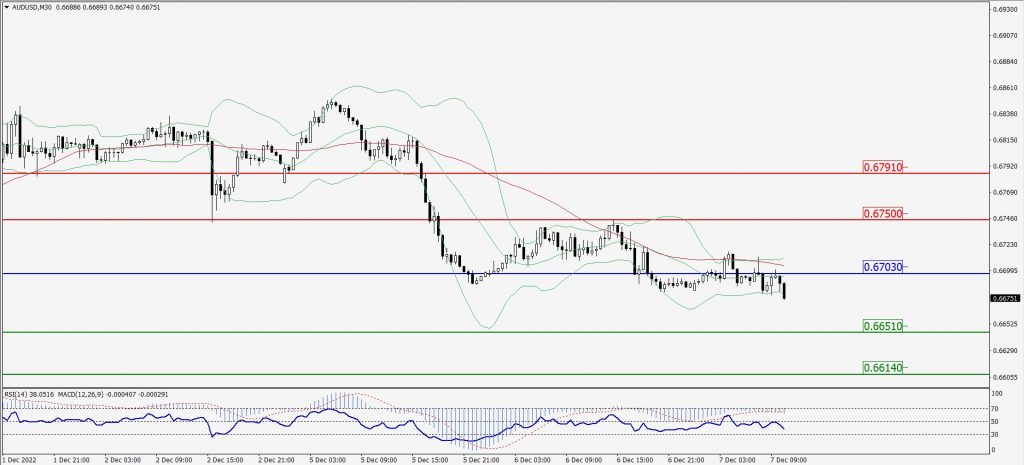
Green Lines Indicate Resistance Levels – Red Lines Indicate Support Levels
Light Blue is a Pivot Point – Black represents the price when the report was produced
CRUDEOIL Intraday: Major trend on the downside
Our pivot point is at 75.10
Preferable Price Action: Below pivots sell oil with 73.08 & 71.58 as targets.
Alternative Price Action: Buy crude above pivot with targets at 76.83 and 78.51 in extension.
Comment: MACD is in the negative territory and Pairs below its 20MA & 55MA.
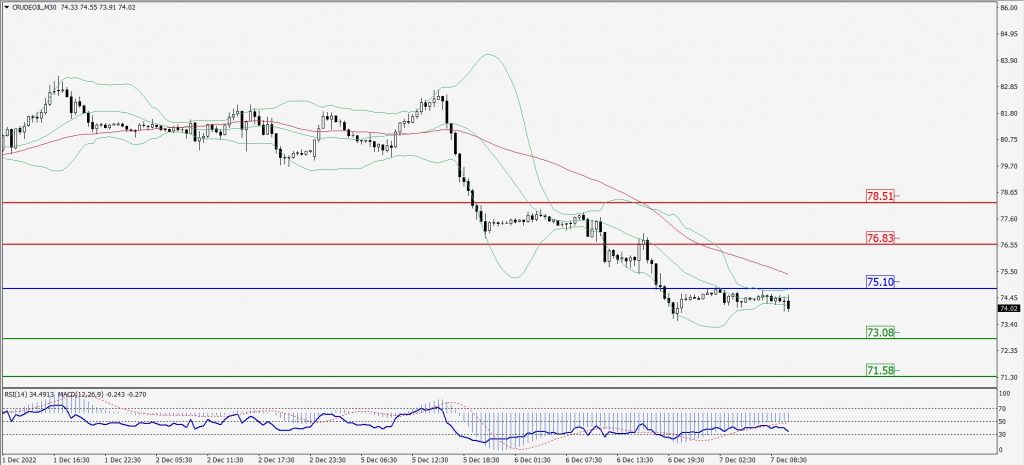
Green Lines Indicate Resistance Levels – Red Lines Indicate Support Levels
Light Blue is a Pivot Point – Black represents the price when the report was produced
XAU/USD Intraday: In a consolidation zone
Our pivot point is 1776.50
Preferable Price Action: Further downside to 1761.80 and 1752.30
Alternative Price Action: If the price gives an upside breakout of a pivot, then the price extends to 1788.90 and 1798.70.
Comment: MACD is flat territory.
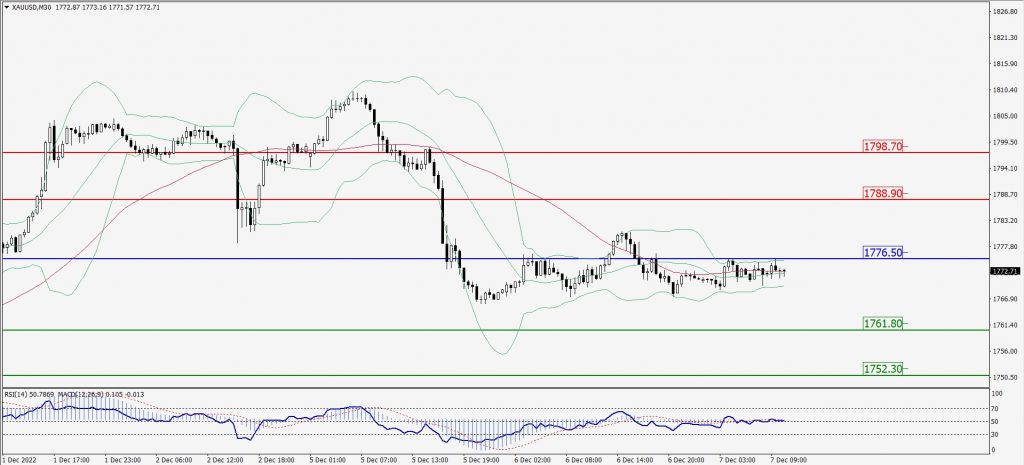
Green Lines Indicate Resistance Levels – Red Lines Indicate Support Levels
Light Blue is a Pivot Point – Black represents the price when the report was produced
Dow Jones Intraday: Trend on the downside
Our pivot point is 33,703.00
Preferable Price Action: Take sell positions below the pivot with targets at 33,482.00 & 33,318.00.
Alternative Price Action: Above 33,703.00 looks for further upside to 33,915.00 & 34,112.00.
Comment: RSI below 50 levels and Pairs below 55MA.
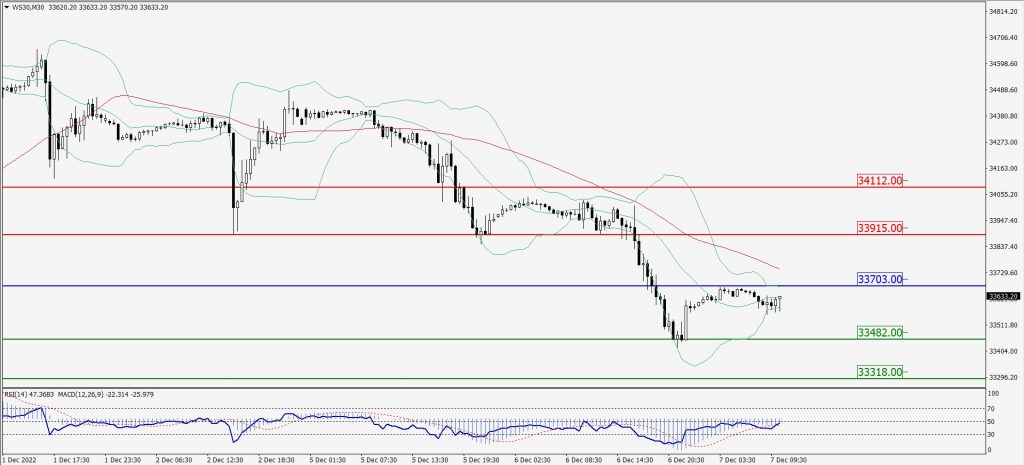
Green Lines Indicate Resistance Levels – Red Lines Indicate Support Levels
Light Blue is a Pivot Point – Black represents the price when the report was produced