Market Wrap: Stocks, Bonds, Commodities
US markets ended Monday lower, as investors spooked by better-than-expected data from the services sector re-evaluated whether the Federal Reserve could hike interest rates for longer, while shares of Tesla slid on reports of a production cut in China.
The Dow Jones Industrial Average fell 482.78 points to 33,947.10, the S&P 500 lose 1.79% to 3,998.84 and the Nasdaq Composite subtract 221.56 points to 11,239.94.
MSCI’s index of Asia-Pacific stocks outside Japan is drop 1.46% to 627.58 levels. The Australian index was lower by 0.47% to 7,291.30. Japanese Nikkei Index gain 0.24% today.
European stocks were negative on Tuesday, with the Stoxx Europe 50 Index fell 0.10% to 3,952.75, Germany’s DAX lose 0.04% to 14,445.95, and France’s CAC decline 0.02% to 6,696.94, and U.K.’s FTSE 100 subtract 0.10% to 7,560.89.
Benchmark 10-year U.S. Treasury fell as demand for safe assets ascend again, today 10-year bond yields are negative 0.10% to 3.595.
Oil prices fell over 3% on Monday, following US stock markets lower, after US service sector data raised worries that the Federal Reserve could continue its aggressive policy tightening path.
Spot Brent crude oil rose 0.90% to $83.44 per barrel. US West Texas Intermediate crude is up 0.74% to $77.50 a barrel.
The yellow metal gold is advance 0.17% to 1,784.30 dollars per ounce.
Market Wrap: Forex
The U.S. dollar held firm against major peers on Tuesday, following its biggest rally in two weeks after strong services data in the United States fuelled bets the Federal Reserve may lift interest rates more than recently projected.
Today, the U.S. dollar index measures the Greenback against a trade-weighted basket of six major currencies, which slipped 0.08% to 105.140.
The Euro US Dollar (EUR/USD) is a widely traded pair that is up 0.14% today. This left the pair trading around $1.05040.
The Japanese yen was negative against the U.S. dollar on Tuesday. Today USD/JPY is ascend 0.05% to the 136.810 level.
Another commodity-related currency positive against the U.S dollar, AUD/USD rose 0.49% to 0.67280, and NZD/USD gain 0.12% to 0.63220 level.
EUR/USD Intraday: Trend on the downside
Our pivot point is at 1.05120
Preferable Price Action: Take short positions below pivot level with targets at 1.04350 & 1.03850 in extension.
Alternative Price Action: Above pivot looks for a further upside to 1.05770 & 1.06290.
Comment: RSI below 50 levels and Pairs below its 20MA & 55MA.
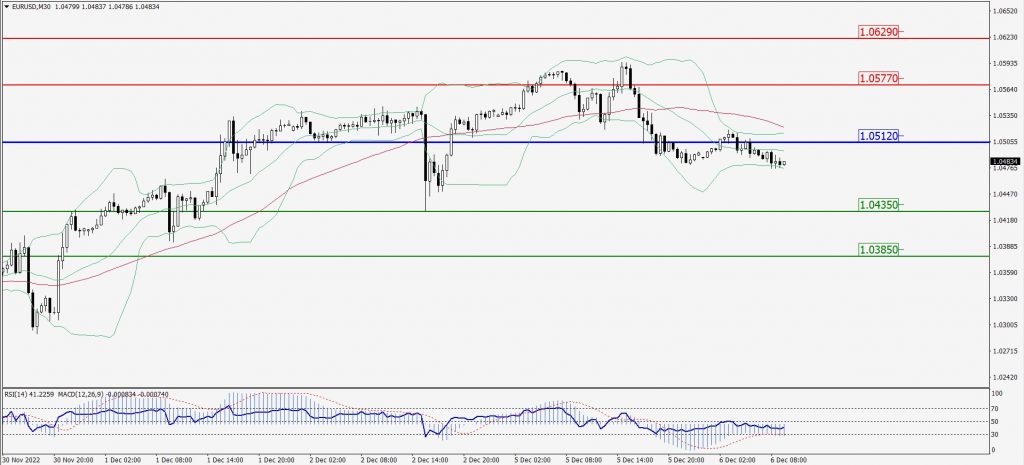
Green Lines Indicate Resistance Levels – Red Lines Indicate Support Levels
Light Blue is a Pivot Point – Black represents the price when the report was produced
GBP/USD Intraday: In a consolidation zone
Our pivot point is at 1.22330
Preferable Price Action: Sell positions below pivot with targets at 1.21260 & 1.20620 in extension.
Alternative Price Action: The price above pivot would call for further upside to 1.23110 & 1.23750.
Comment: RSI at 50 levels and Pairs below 55MA.
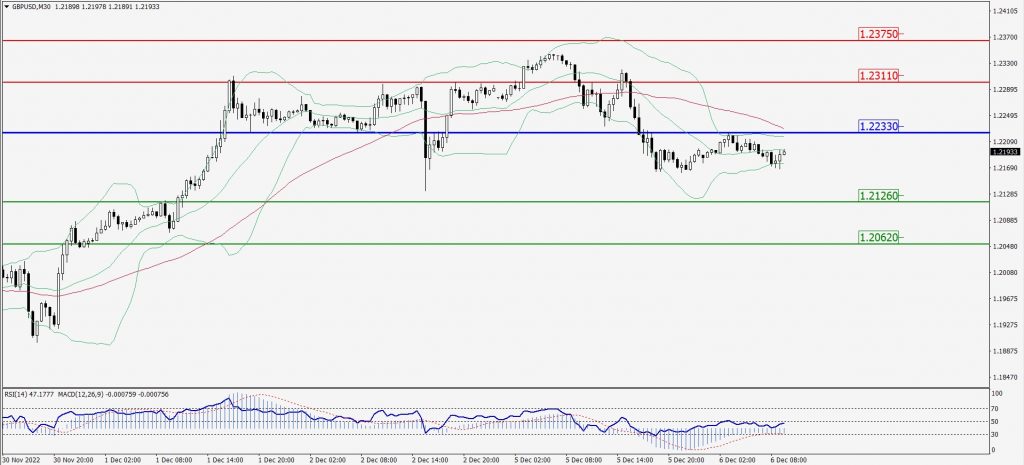
Green Lines Indicate Resistance Levels – Red Lines Indicate Support Levels
Light Blue is a Pivot Point – Black represents the price when the report was produced
USD/JPY Intraday: Trend on the upside
Our pivot point is at 136.970
Preferable Price Action: Buy position above pivot with the target at 138.210 and 139.160 in extension.
Alternative Price Action: The downside breakout of the pivot would call for 135.930 and 134.950.
Comment: MACD is positive territory and Pairs above its 20MA & 55MA.
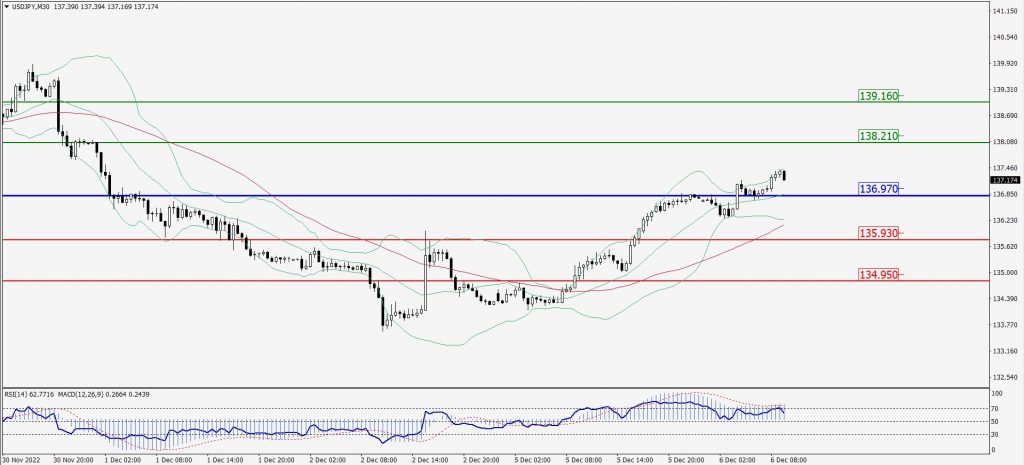
Green Lines Indicate Resistance Levels – Red Lines Indicate Support Levels
Light Blue is a Pivot Point – Black represents the price when the report was produced
AUD/USD Intraday: In a consolidation zone
Our pivot point is at 0.67370
Preferable Price Action: Sell Positions below pivot with targets at 0.66960 & 0.66670 in extension.
Alternative Price Action: Above pivot looks for a further upside with 0.67700 & 0.67990 as targets.
Comment: RSI at 50 levels and Pairs below 55MA.
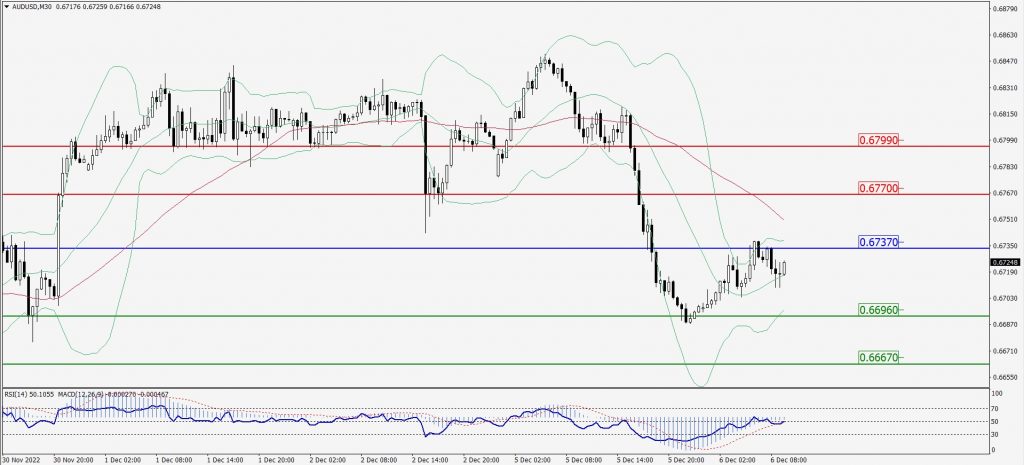
Green Lines Indicate Resistance Levels – Red Lines Indicate Support Levels
Light Blue is a Pivot Point – Black represents the price when the report was produced
CRUDEOIL Intraday: Trend on the downside
Our pivot point is at 78.32
Preferable Price Action: Below pivots sell oil with 77.07 & 76.15 as targets.
Alternative Price Action: Buy crude above pivot with targets at 79.32 and 80.34 in extension.
Comment: MACD is in the negative territory and Pairs below 55MA.
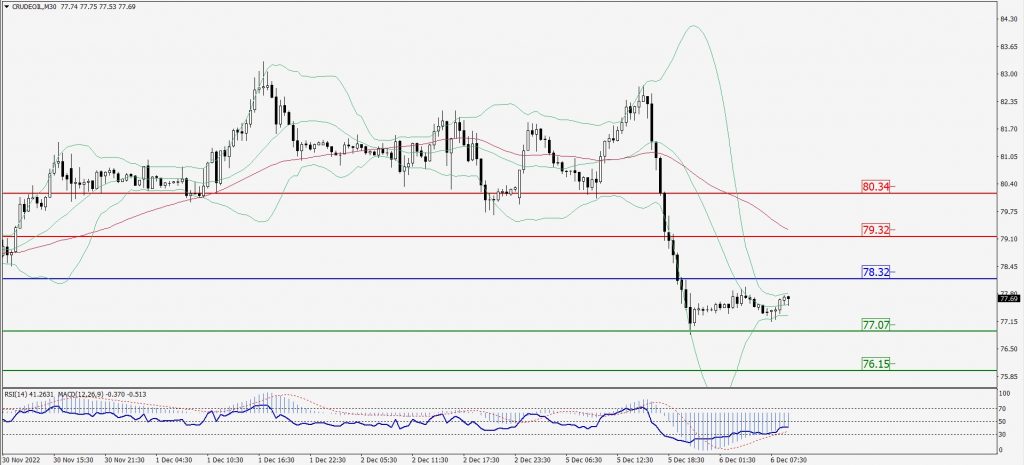
Green Lines Indicate Resistance Levels – Red Lines Indicate Support Levels
Light Blue is a Pivot Point – Black represents the price when the report was produced
XAU/USD Intraday: Resistance level at 1776.30
Our pivot point is 1776.30
Preferable Price Action: Further downside to 1764.10 and 1756.30
Alternative Price Action: If the price gives an upside breakout of a pivot, then the price extends to 1785.20 and 1792.50.
Comment: MACD is negative territory and Pairs below its 20MA & 55MA.
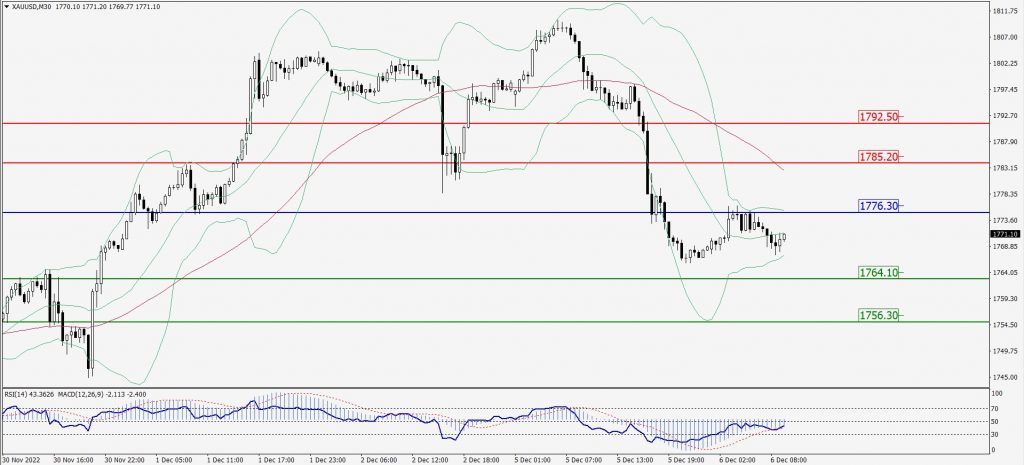
Green Lines Indicate Resistance Levels – Red Lines Indicate Support Levels
Light Blue is a Pivot Point – Black represents the price when the report was produced
Dow Jones Intraday: Trend on the downside
Our pivot point is 34,052.00
Preferable Price Action: Take sell positions below the pivot with targets at 33,872.00 & 33,731.00.
Alternative Price Action: Above 34,052.00 looks for further upside to 34,220.00 & 34,348.00.
Comment: RSI below 50 levels and Pairs below its 20MA & 55MA.
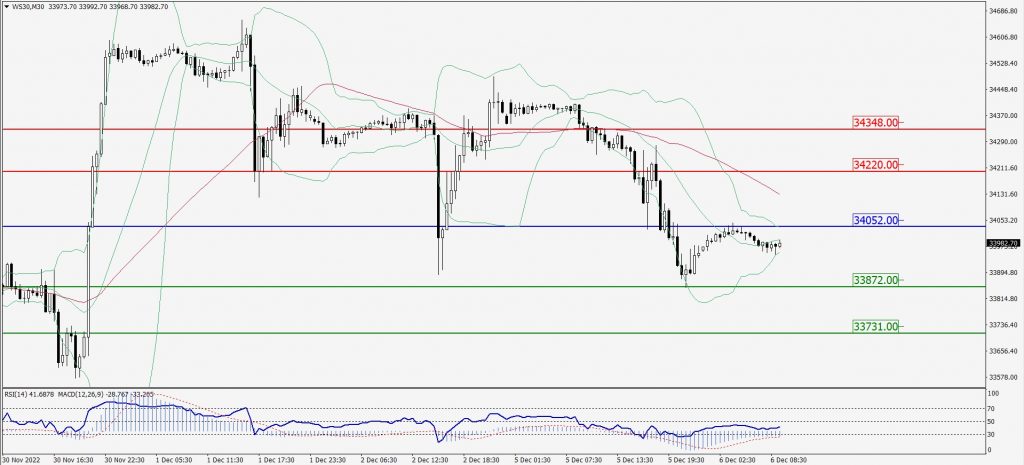
Green Lines Indicate Resistance Levels – Red Lines Indicate Support Levels
Light Blue is a Pivot Point – Black represents the price when the report was produced