Market Wrap: Stocks, Bonds, Commodities
The S&P 500 and Nasdaq closed down on Wednesday after a choppy session on Wall Street, as investors struggled to grasp a clear direction as they weighed how the Federal Reserve’s monetary policy tightening might feed through into corporate America.
The Dow Jones Industrial Average rose 1.58 points to 33,597.92, the S&P 500 lose 0.19% to 3,933.92 and the Nasdaq Composite subtract 56.34 points to 10,958.55.
MSCI’s index of Asia-Pacific stocks outside Japan is ascend 1.32% to 626.11 levels. The Australian index was lower by 0.75% to 7,175.50. Japanese Nikkei Index lose 0.40% today.
European stocks were mixed on Thursday, with the Stoxx Europe 50 Index rose 0.07% to 3,923.45, Germany’s DAX lose 0.05% to 14,255.55, and France’s CAC advance 0.14% to 6,670.16, and U.K.’s FTSE 100 add 0.01% to 7,490.15.
Benchmark 10-year U.S. Treasury fell as demand for safe assets ascend again, today 10-year bond yields are positive 1.10% to 3.446.
Oil rose after a four-day drop as investors weighed the impact of China’s moves to ease virus curbs against a looming US slowdown.
Spot Brent crude oil rose 0.98% to $77.93 per barrel. US West Texas Intermediate crude is up 1.21% to $72.88 a barrel.
The yellow metal gold is decline 0.24% to 1,793.80 dollars per ounce.
Market Wrap: Forex
The U.S. dollar clawed back some of the previous day’s declines on Thursday as investors weighed the outlook for Federal Reserve policy amid simmering fears that high interest rates could spur a recession.
Today, the U.S. dollar index measures the Greenback against a trade-weighted basket of six major currencies, which surged 0.26% to 105.330.
The Euro US Dollar (EUR/USD) is a widely traded pair that is down 0.08% today. This left the pair trading around $1.04970.
The Japanese yen was negative against the U.S. dollar on Thursday. Today USD/JPY is ascend 0.25% to the 136.930 level.
Another commodity-related currency negative against the U.S dollar, AUD/USD fell 0.04% to 0.67190, and NZD/USD lose 0.06% to 0.63470 level.
EUR/USD Intraday: Trend on the upside
Our pivot point is at 1.05130
Preferable Price Action: Take long positions above pivot level with targets at 1.05380 & 1.05630 in extension.
Alternative Price Action: Below pivot looks for a further downside to 1.04890 & 1.04650.
Comment: RSI above 50 levels and Pairs above its 20MA & 55MA.
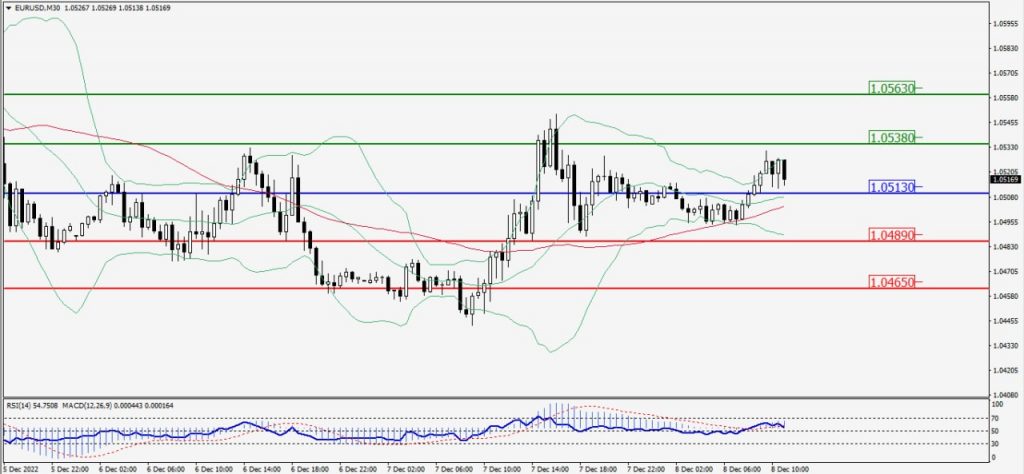
Green Lines Indicate Resistance Levels – Red Lines Indicate Support Levels
Light Blue is a Pivot Point – Black represents the price when the report was produced
GBP/USD Intraday: Trend on the downside
Our pivot point is at 1.21750
Preferable Price Action: Sell positions below pivot with targets at 1.21440 & 1.21200 in extension.
Alternative Price Action: The price above pivot would call for further upside to 1.22050 & 1.22250.
Comment: RSI below 50 levels and Pairs below its 20MA & 55MA.
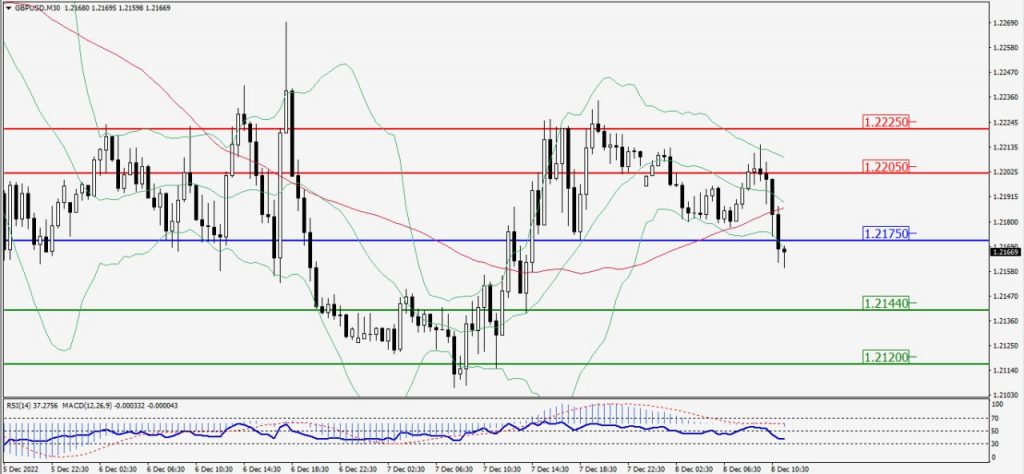
Green Lines Indicate Resistance Levels – Red Lines Indicate Support Levels
Light Blue is a Pivot Point – Black represents the price when the report was produced
USD/JPY Intraday: In a consolidation zone
Our pivot point is at 136.910
Preferable Price Action: Sell position below pivot with the target at 136.650 and 136.410 in extension.
Alternative Price Action: The upside breakout of the pivot would call for 137.190 and 137.440.
Comment: MACD is flat territory and Pairs below 55MA.
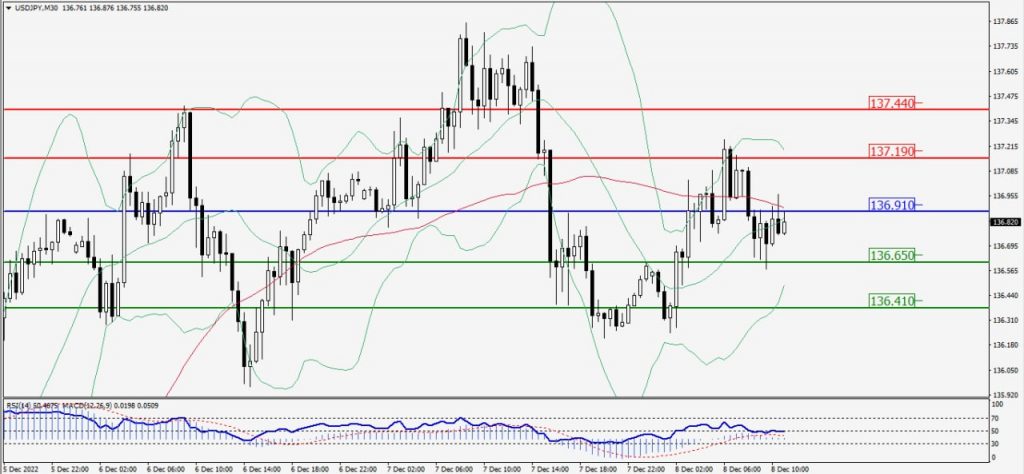
Green Lines Indicate Resistance Levels – Red Lines Indicate Support Levels
Light Blue is a Pivot Point – Black represents the price when the report was produced
AUD/USD Intraday: Support level at 0.67140
Our pivot point is at 0.67140
Preferable Price Action: Buy Positions above pivot with targets at 0.67350 & 0.67460 in extension.
Alternative Price Action: Below pivot looks for a further downside with 0.66950 & 0.66840 as targets.
Comment: RSI at 50 levels and Pairs above 55MA.
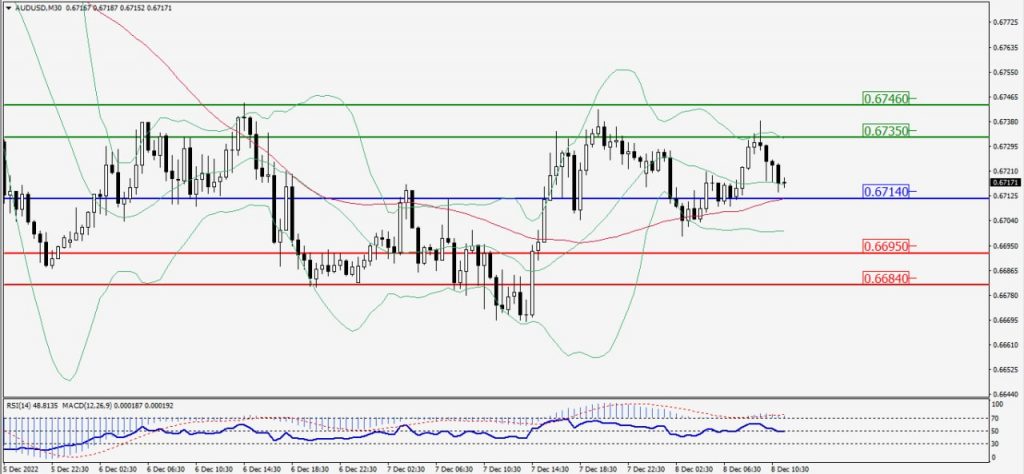
Green Lines Indicate Resistance Levels – Red Lines Indicate Support Levels
Light Blue is a Pivot Point – Black represents the price when the report was produced
CRUDEOIL Intraday: Trend on the downside
Our pivot point is at 74.11
Preferable Price Action: Below pivots sell oil with 71.46 & 69.53 as targets.
Alternative Price Action: Buy crude above pivot with targets at 76.69 and 78.72 in extension.
Comment: MACD is in the negative territory and Pairs below 55MA.
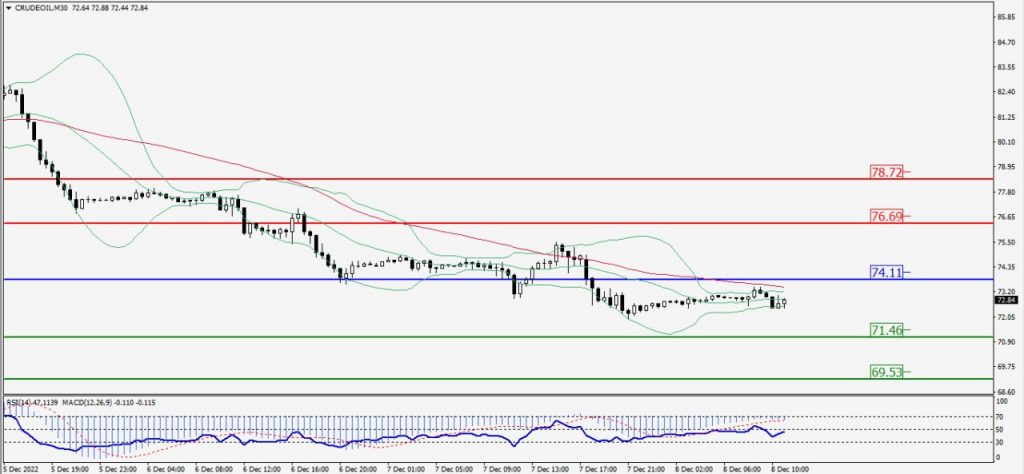
Green Lines Indicate Resistance Levels – Red Lines Indicate Support Levels
Light Blue is a Pivot Point – Black represents the price when the report was produced
XAU/USD Intraday: Trend on the upside
Our pivot point is 1784.10
Preferable Price Action: Further upside to 1788.80 and 1793.30
Alternative Price Action: If the price gives a downside breakout of a pivot, then the price extends to 1780.10 and 1775.60.
Comment: MACD is positive territory and Pairs above 55MA.
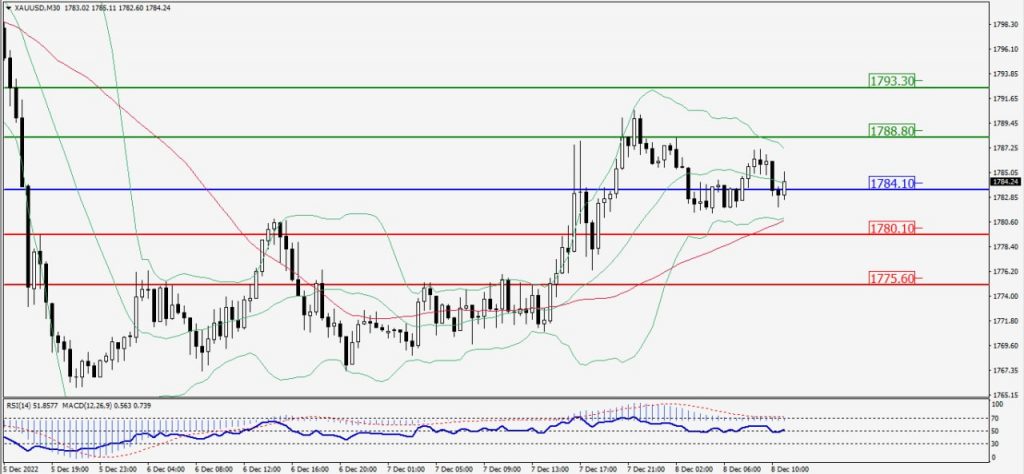
Green Lines Indicate Resistance Levels – Red Lines Indicate Support Levels
Light Blue is a Pivot Point – Black represents the price when the report was produced
Dow Jones Intraday: Support level at 33,567.00
Our pivot point is 33,567.00
Preferable Price Action: Take buy positions above the pivot with targets at 33,787.00 & 33,964.00.
Alternative Price Action: Below 33,567.00 looks for further downside to 33,333.00 & 34,161.00.
Comment: RSI above 50 levels and Pairs above its 20MA & 55MA.
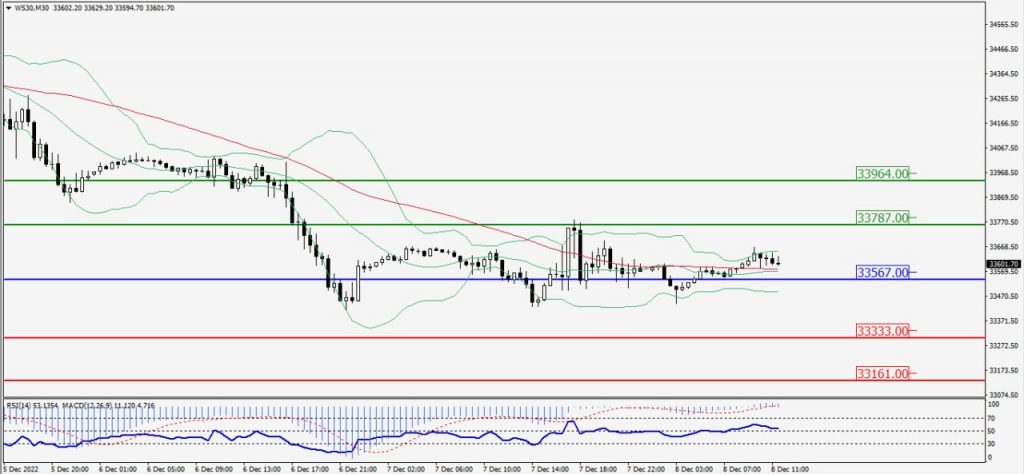
Green Lines Indicate Resistance Levels – Red Lines Indicate Support Levels
Light Blue is a Pivot Point – Black represents the price when the report was produced