Market Wrap: Stocks, Bonds, Commodities
US stocks closed out the trading week on a down note on Friday, as early gains from a jobs report that showed a labor market that may be starting to loosen gave way to worries about the European gas crisis.
The Dow Jones Industrial Average fell 337.98 points to 31,318.44, the S&P 500 lose 42.59 points to 3,924.26 and the Nasdaq Composite subtract 154.26 points to 11,630.86.
MSCI’s index of Asia-Pacific stocks outside Japan is ascend 0.19% to 621.29 levels. Australian index lower 0.38% to 6,826.50. Japanese Nikkei Index ascend 0.03% to 27,626.51.
European stocks were positive on Tuesday, with the Stoxx Europe 50 Index rose 0.07% to 3,492.55, Germany’s DAX ascend 0.19% to 12,784.40, and France’s CAC add 0.02% to 6,092.37, and U.K.’s FTSE 100 surge 0.15% to 7,298.00.
Benchmark 10-year U.S. Treasury fell as demand for safe assets ascend again, today 10-year bond yields a positive 2.38% to 3.2670.
Oil prices rose about 4 percent on Monday, extending gains as OPEC+ members agreed to a small production cut to bolster prices.
Spot Brent crude oil subtract 0.97% to $94.80 per barrel. US West Texas Intermediate crude is up 1.69% to $88.34 a barrel.
The yellow metal gold is advance 0.14% to 1,724.90 dollars per ounce.
Market Wrap: Forex
The U.S. dollar retained a positive tone Tuesday, climbing to a fresh 24-year high against the rate-sensitive Japanese yen, while the euro bounced from its lowest level since 2002 ahead of this week’s European Central Bank meeting.
Today, the U.S. dollar index measures the Greenback against a trade-weighted basket of six major currencies, which is rose 0.14% to 109.665.
The Euro US Dollar (EUR/USD) is a widely traded pair that is up 0.28% today. This left the pair trading around $0.99540.
The Japanese yen was positive against the U.S. dollar on Tuesday as the stock up. Today USD/JPY is ascend 0.86% to 141.790 level.
Another commodity-related currency negative against the U.S dollar, AUD/USD slipped 0.40% to 0.67680, and NZD/USD down 0.36 to 0.60730 level.
EUR/USD Intraday: Trend on the upside
Our pivot point is at 0.99630
Preferable Price Action: Take buy positions above pivot level with targets at 1.00140 & 1.00460 in extension.
Alternative Price Action: Below pivot looks for a further downside to 0.99160 & 0.98880.
Comment: RSI above 50 levels and Pairs above its 20MA & 55MA.
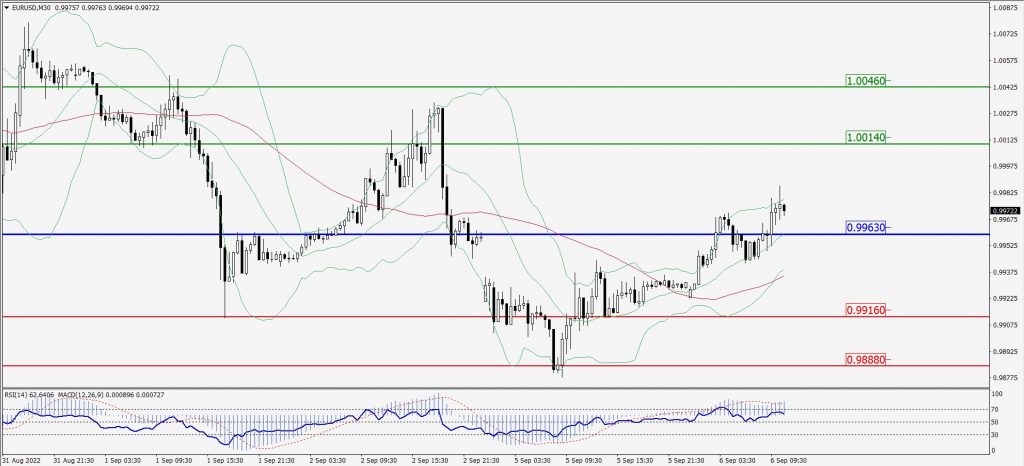
Green Lines Indicate Resistance Levels – Red Lines Indicate Support Levels
Light Blue is a Pivot Point – Black represents the price when the report was produced
GBP/USD Intraday: May trend reverse from 1.15590
Our pivot point is at 1.15590
Preferable Price Action: Buy positions above pivot with targets at 1.16250 & 1.16700 in extension.
Alternative Price Action: The price below pivot would call for further downside to 1.15050 & 1.14650.
Comment: RSI above 50 levels and Pairs above 55MA.
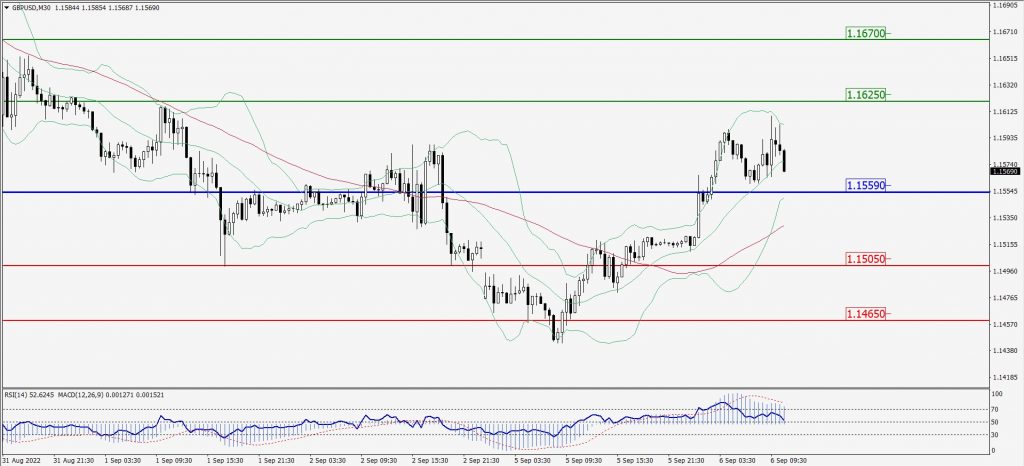
Green Lines Indicate Resistance Levels – Red Lines Indicate Support Levels
Light Blue is a Pivot Point – Black represents the price when the report was produced
USD/JPY Intraday: Major trend on the upside
Our pivot point is at 141.280
Preferable Price Action: Buy position above pivot with the target at 142.550 and 143.400 in extension.
Alternative Price Action: The downside breakout of the pivot would call for 140.290 and 139.410.
Comment: MACD is positive territory and Pairs above its 20MA & 55MA.
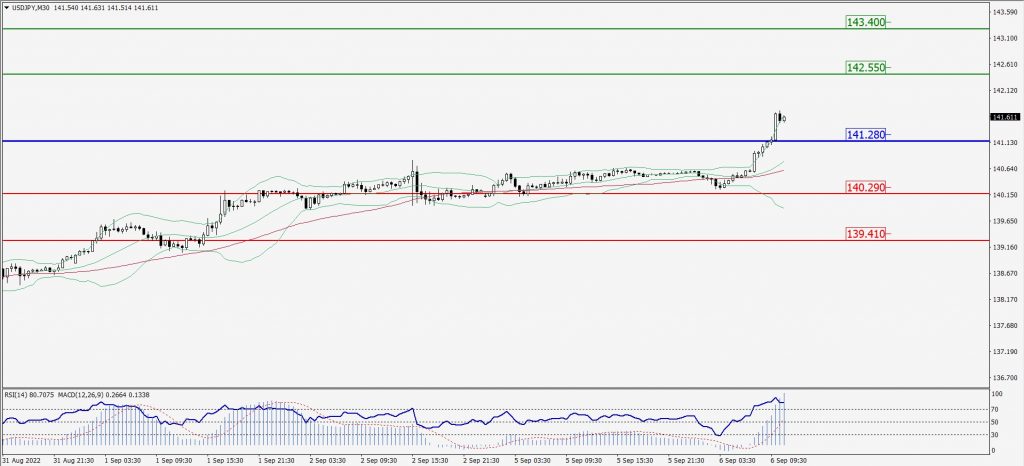
Green Lines Indicate Resistance Levels – Red Lines Indicate Support Levels
Light Blue is a Pivot Point – Black represents the price when the report was produced
AUD/USD Intraday: Trend on the downside
Our pivot point is at 0.68110
Preferable Price Action: Sell Positions below pivot with targets at 0.67450 & 0.67040 in extension.
Alternative Price Action: Above pivot looks for a further upside with 0.68670 & 0.69100 as targets.
Comment: RSI below 50 levels and Pairs below its 20MA & 55MA.
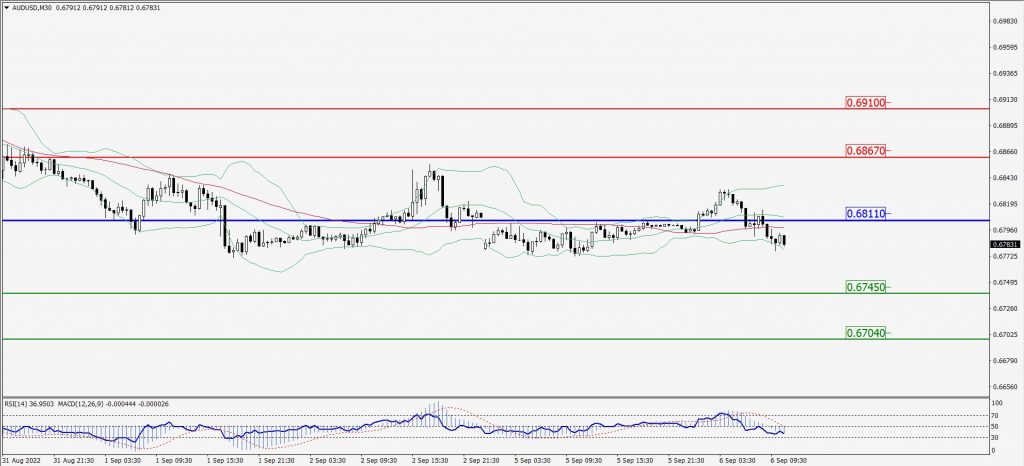
Green Lines Indicate Resistance Levels – Red Lines Indicate Support Levels
Light Blue is a Pivot Point – Black represents the price when the report was produced
CRUDEOIL Intraday: Trend on the upside
Our pivot point is at 88.56
Preferable Price Action: Above pivots buy oil with 90.14 & 91.45 as targets.
Alternative Price Action: Sell crude below pivot with targets at 87.12 and 85.90 in extension.
Comment: MACD is in the positive territory and Pairs above 20MA.
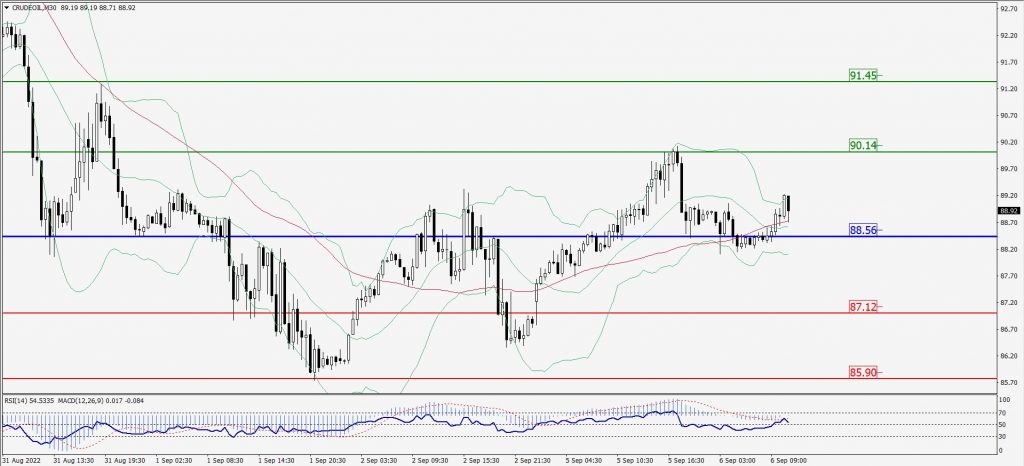
Green Lines Indicate Resistance Levels – Red Lines Indicate Support Levels
Light Blue is a Pivot Point – Black represents the price when the report was produced
XAU/USD Intraday: In a consolidation zone
Our pivot point is 1714.30
Preferable Price Action: Further upside to 1729.30 and 1740.60
Alternative Price Action: If the price gives a downside breakout of a pivot, then the price extends to 1701.50 and 1692.40.
Comment: MACD is flat territory and Pairs above 55MA.
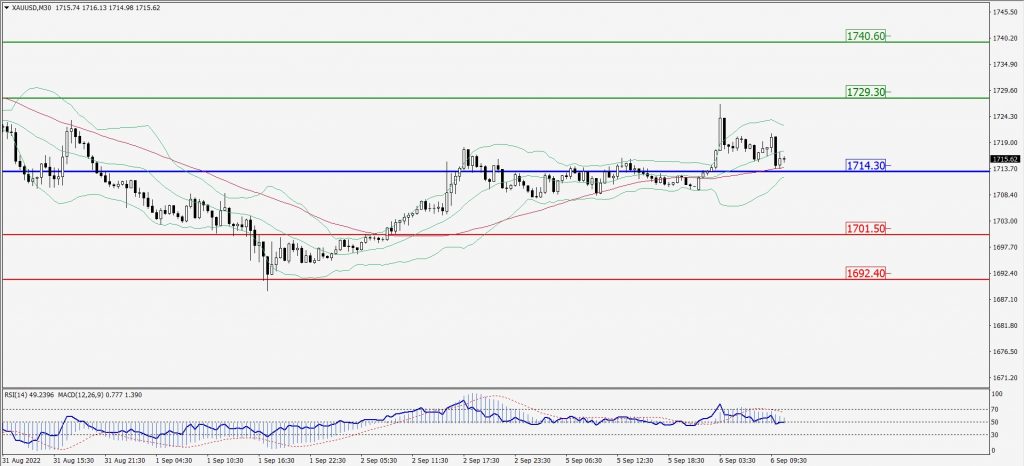
Green Lines Indicate Resistance Levels – Red Lines Indicate Support Levels
Light Blue is a Pivot Point – Black represents the price when the report was produced
Dow Jones Intraday: In a consolidation zone
Our pivot point is 31,441.00
Preferable Price Action: Take buy positions above pivot with targets at 31,714.00 & 31,904.00.
Alternative Price Action: Below 31,441.00 looks for further downside to 31,184.00 & 30,959.00.
Comment: RSI at 50 levels and Pairs above 55MA.
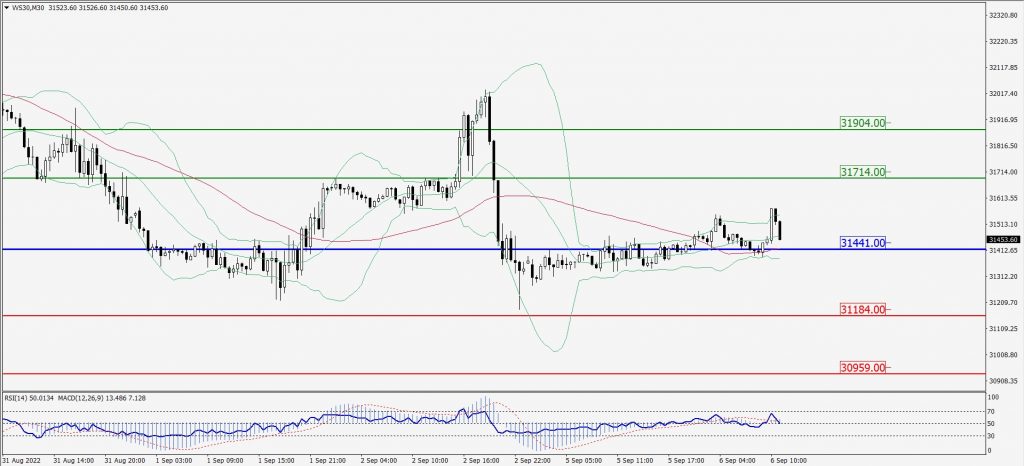
Green Lines Indicate Resistance Levels – Red Lines Indicate Support Levels
Light Blue is a Pivot Point – Black represents the price when the report was produced