Market Wrap: Stocks, Bonds, Commodities
Wall Street’s main indices closed lower on Tuesday, the first session after the US Labor Day holiday and summer vacations, as traders assessed fresh economic data in volatile trading.
The Dow Jones Industrial Average fell 173.14 points to 31,145.30, the S&P 500 lose 16.07 points to 3,908.19 and the Nasdaq Composite subtract 85.96 points to 11,544.91.
MSCI’s index of Asia-Pacific stocks outside Japan is drop 1.44% to 612.44 levels. Australian index lower 1.42% to 6,729.30. Japanese Nikkei Index drop 0.71% to 27,430.30.
European stocks were positive on Wednesday, with the Stoxx Europe 50 Index fell 0.25% to 3,492.35, Germany’s DAX drop 0.29% to 12,833.08, and France’s CAC subtract 0.24% to 6,088.28, and U.K.’s FTSE 100 slipped 0.78% to 7,242.40.
Benchmark 10-year U.S. Treasury fell as demand for safe assets ascend again, today 10-year bond yields a negative 0.64% to 3.3190.
Oil prices sank on Tuesday after a two-day rally as concern returned about weaker demand and the prospect of more interest rate hikes trumped support from OPEC+’s first output target cut since 2020.
Spot Brent crude oil subtract 0.71% to $92.17 per barrel. US West Texas Intermediate crude is down 0.69% to $86.23 a barrel.
The yellow metal gold is advance 0.08% to 1,714.45 dollars per ounce.
Market Wrap: Forex
The U.S. dollar soared in early European trade Wednesday, rising to a fresh 24-year high against the Japanese yen as traders anticipate further aggressive monetary tightening by the Federal Reserve.
Today, the U.S. dollar index measures the Greenback against a trade-weighted basket of six major currencies, which is rose 0.01% to 110.215.
The Euro US Dollar (EUR/USD) is a widely traded pair that is up 0.17% today. This left the pair trading around $0.99190.
The Japanese yen was positive against the U.S. dollar on Wednesday as the stock up. Today USD/JPY is ascend 0.87% to 144.040 level.
Another commodity-related currency negative against the U.S dollar, AUD/USD slipped 0.16% to 0.67230, and NZD/USD down 0.17 to 0.60270 level.
EUR/USD Intraday: Trend on the downside
Our pivot point is at 0.99120
Preferable Price Action: Take sell positions below pivot level with targets at 0.98690 & 0.98320 in extension.
Alternative Price Action: Above pivot looks for a further upside to 0.99540 & 0.99910.
Comment: RSI below 50 levels and Pairs below 55MA.
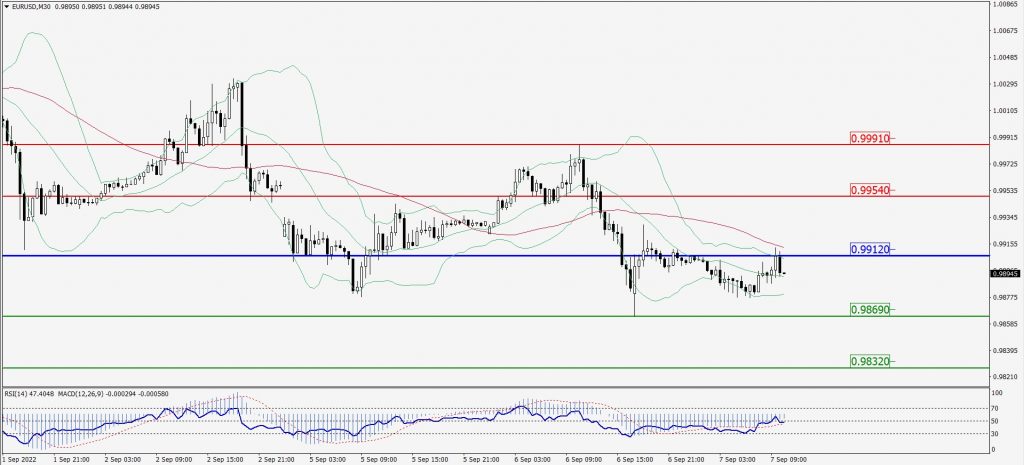
Green Lines Indicate Resistance Levels – Red Lines Indicate Support Levels
Light Blue is a Pivot Point – Black represents the price when the report was produced
GBP/USD Intraday: In a consolidation zone
Our pivot point is at 1.15160
Preferable Price Action: Sell positions below pivot with targets at 1.14640 & 1.14310 in extension.
Alternative Price Action: The price above pivot would call for further upside to 1.15600 & 1.15950.
Comment: RSI below 50 levels and Pairs below 55MA.
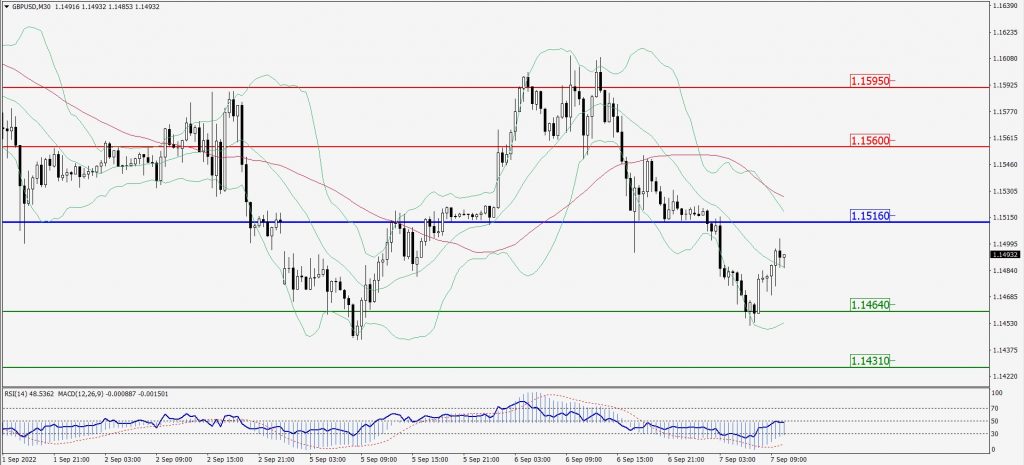
Green Lines Indicate Resistance Levels – Red Lines Indicate Support Levels
Light Blue is a Pivot Point – Black represents the price when the report was produced
USD/JPY Intraday: Major trend on the upside
Our pivot point is at 143.980
Preferable Price Action: Buy position above pivot with the target at 145.300 and 146.310 in extension.
Alternative Price Action: The downside breakout of the pivot would call for 142.820 and 141.760.
Comment: MACD is positive territory and Pairs above its 20MA & 55MA.
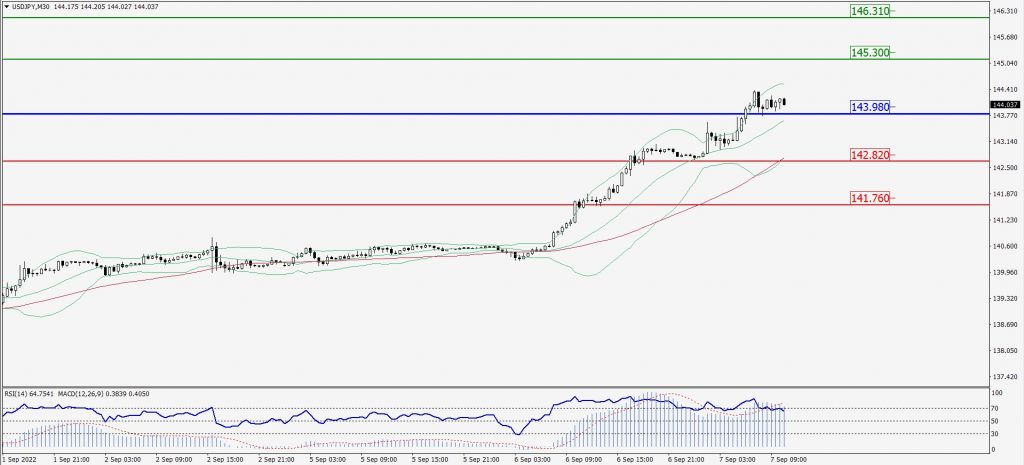
Green Lines Indicate Resistance Levels – Red Lines Indicate Support Levels
Light Blue is a Pivot Point – Black represents the price when the report was produced
AUD/USD Intraday: Trend on the downside
Our pivot point is at 0.67360
Preferable Price Action: Sell Positions below pivot with targets at 0.66840 & 0.66430 in extension.
Alternative Price Action: Above pivot looks for a further upside with 0.67860 & 0.68300 as targets.
Comment: RSI below 50 levels and Pairs below its 20MA & 55MA.
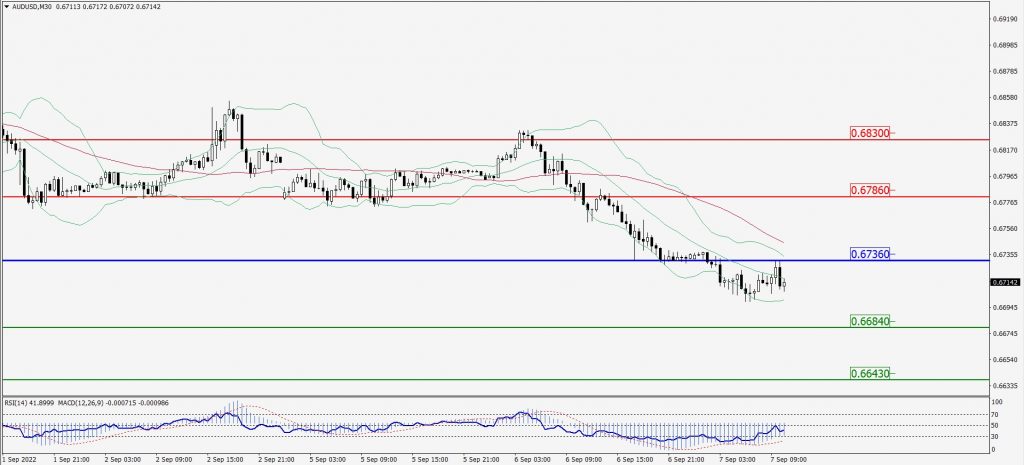
Green Lines Indicate Resistance Levels – Red Lines Indicate Support Levels
Light Blue is a Pivot Point – Black represents the price when the report was produced
CRUDEOIL Intraday: Trend on the downside
Our pivot point is at 86.20
Preferable Price Action: Below pivots sell oil with 84.26 & 82.72 as targets.
Alternative Price Action: Buy crude above pivot with targets at 87.80 and 89.09 in extension.
Comment: MACD is in the negative territory and Pairs below its 20MA & 55MA.
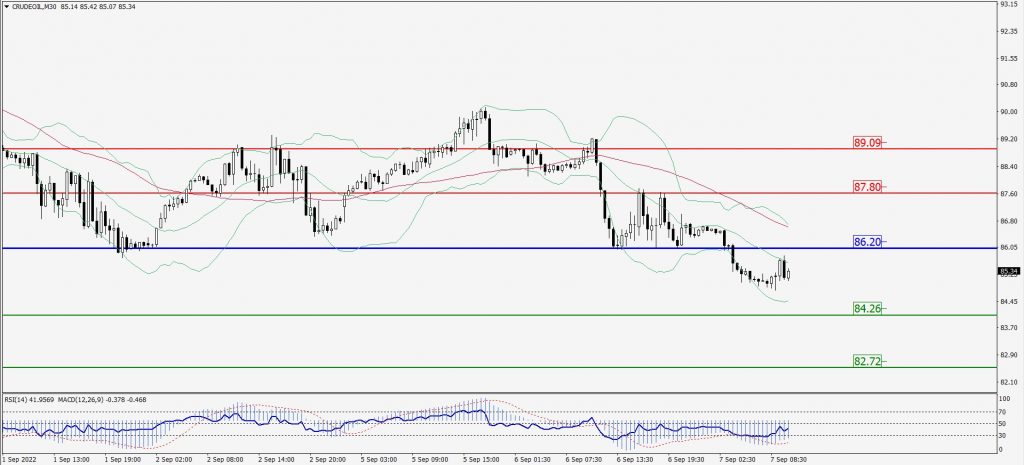
Green Lines Indicate Resistance Levels – Red Lines Indicate Support Levels
Light Blue is a Pivot Point – Black represents the price when the report was produced
XAU/USD Intraday: In a consolidation zone
Our pivot point is 1696.20
Preferable Price Action: Further upside to 1712.30 and 1723.40
Alternative Price Action: If the price gives a downside breakout of a pivot, then the price extends to 1684.40 and 1675.00.
Comment: MACD is positive territory and Pairs above 20MA.
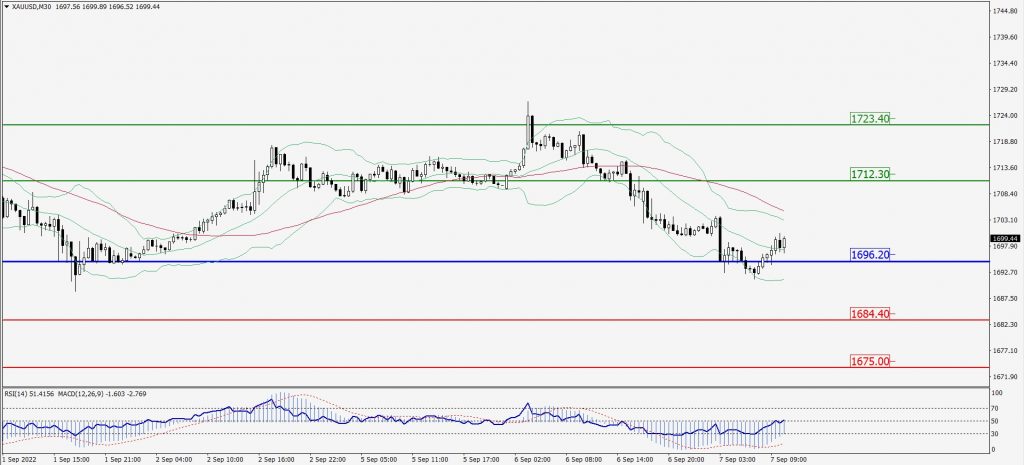
Green Lines Indicate Resistance Levels – Red Lines Indicate Support Levels
Light Blue is a Pivot Point – Black represents the price when the report was produced
Dow Jones Intraday: Resistance level at 31,266.00
Our pivot point is 31,266.00
Preferable Price Action: Take sell positions below pivot with targets at 30,896.00 & 30,592.00.
Alternative Price Action: Above 31,266.00 looks for further upside to 31,584.00 & 31,894.00.
Comment: RSI at 50 levels and Pairs below 55MA.
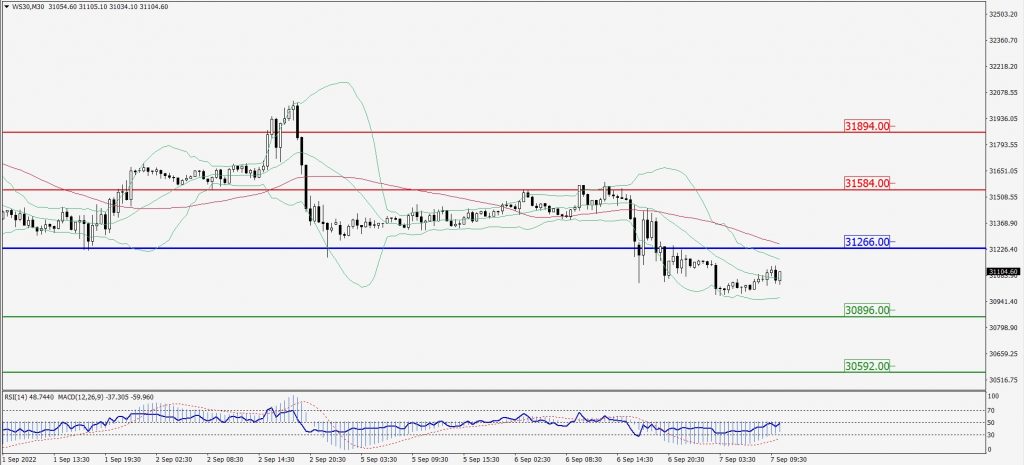
Green Lines Indicate Resistance Levels – Red Lines Indicate Support Levels
Light Blue is a Pivot Point – Black represents the price when the report was produced