Market Wrap: Stocks, Bonds, Commodities
US stocks closed out the trading week on a down note on Friday, as early gains from a jobs report that showed a labor market that may be starting to loosen gave way to worries about the European gas crisis.
The Dow Jones Industrial Average fell 337.98 points to 31,318.44, the S&P 500 lose 42.59 points to 3,924.26 and the Nasdaq Composite subtract 154.26 points to 11,630.86.
MSCI’s index of Asia-Pacific stocks outside Japan is drop 0.66% to 619.58 levels. Australian index higher 0.34% to 6,852.20. Japanese Nikkei Index drop 0.11% to 27,619.61.
European stocks were negative on Monday, with the Stoxx Europe 50 Index fell 2.63% to 3,451.05, Germany’s DAX drop 3.21% to 12,632.20, and France’s CAC subtract 2.22% to 6,031.37, and U.K.’s FTSE 100 slipped 1.18% to 7,196.10.
Benchmark 10-year U.S. Treasury fell as demand for safe assets ascend again, today 10-year bond yields a positive 0.13% to 3.1950.
Oil prices rose more than $2 a barrel on Monday, extending gains as investors eyed possible moves by OPEC+ producers to cut output and support prices at a meeting later in the day.
Spot Brent crude oil add 2.66% to $95.51 per barrel. US West Texas Intermediate crude is up 2.49% to $89.03 a barrel.
The yellow metal gold is advance 0.07% to 1,723.75 dollars per ounce.
Market Wrap: Forex
The U.S. dollar rose to a new two-decade high in early European trade Friday, while the euro slumped to its lowest level since 2002 after Russia halted the supply of gas to Europe, raising fears of energy shortages as winter approaches.
Today, the U.S. dollar index measures the Greenback against a trade-weighted basket of six major currencies, which is rose 0.37% to 109.915.
The Euro US Dollar (EUR/USD) is a widely traded pair that is down 0.29% today. This left the pair trading around $0.99220.
The Japanese yen was positive against the U.S. dollar on Monday as the stock up. Today USD/JPY is ascend 0.23% to 140.540 level.
Another commodity-related currency negative against the U.S dollar, AUD/USD slipped 0.40% to 0.67810, and NZD/USD down 0.23 to 0.60840 level.
EUR/USD Intraday: Trend on the downside
Our pivot point is at 0.99580
Preferable Price Action: Take sell positions below pivot level with targets at 0.98790 & 0.98390 in extension.
Alternative Price Action: Above pivot looks for a further upside to 1.00210 & 1.00620.
Comment: RSI below 50 levels and Pairs below 55MA.
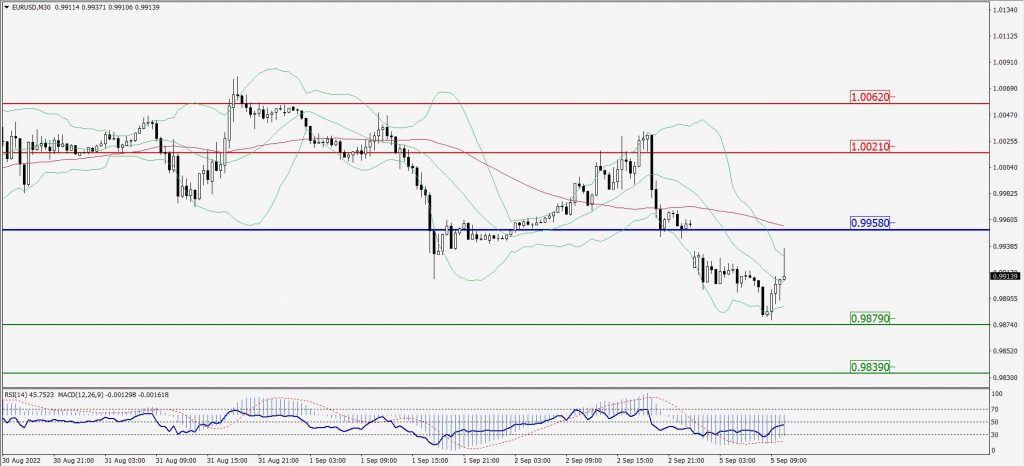
Green Lines Indicate Resistance Levels – Red Lines Indicate Support Levels
Light Blue is a Pivot Point – Black represents the price when the report was produced
GBP/USD Intraday: Trend on the downside
Our pivot point is at 1.15200
Preferable Price Action: Sell positions below pivot with targets at 1.14150 & 1.13460 in extension.
Alternative Price Action: The price above pivot would call for further upside to 1.16070 & 1.16790.
Comment: RSI below 50 levels and Pairs below 55MA.
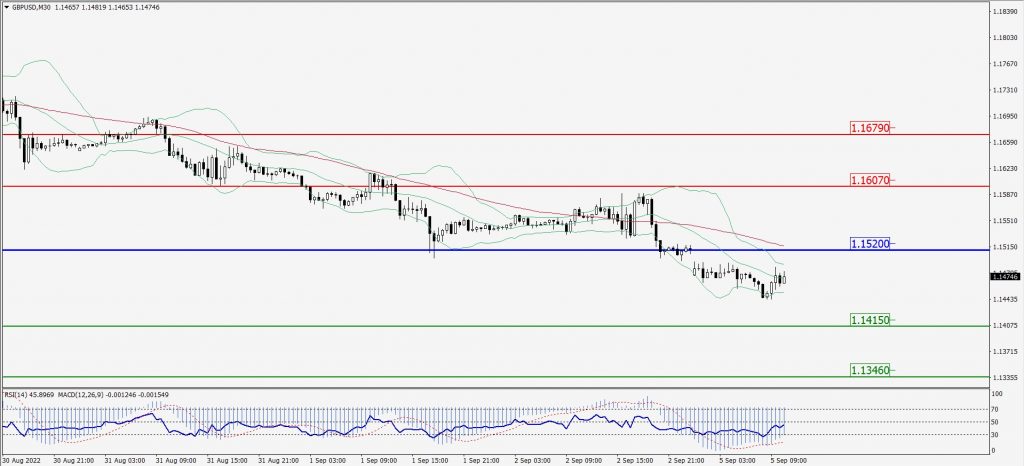
Green Lines Indicate Resistance Levels – Red Lines Indicate Support Levels
Light Blue is a Pivot Point – Black represents the price when the report was produced
USD/JPY Intraday: Major support level at 140.420
Our pivot point is at 140.420
Preferable Price Action: Buy position above pivot with the target at 141.340 and 142.020 in extension.
Alternative Price Action: The downside breakout of the pivot would call for 139.630 and 138.970.
Comment: MACD is positive territory and Pairs above its 20MA & 55MA.
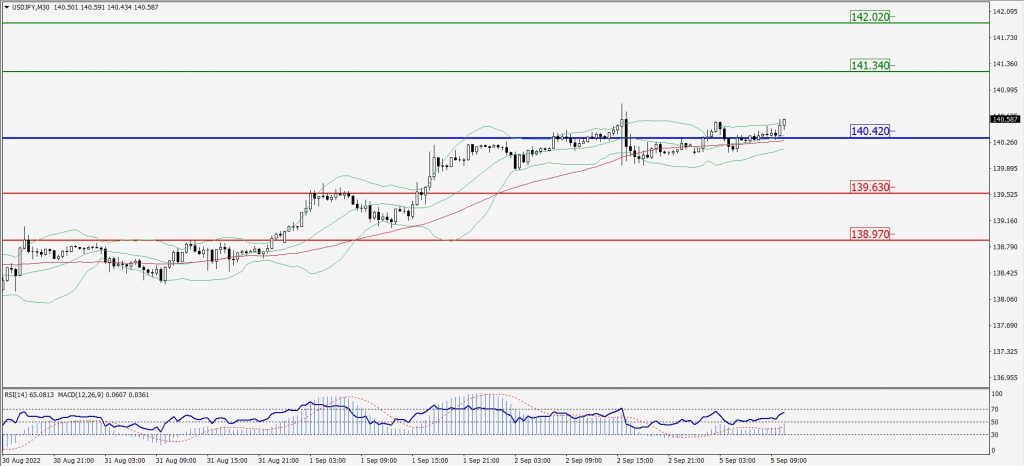
Green Lines Indicate Resistance Levels – Red Lines Indicate Support Levels
Light Blue is a Pivot Point – Black represents the price when the report was produced
AUD/USD Intraday: Resistance level 0.68110
Our pivot point is at 0.68110
Preferable Price Action: Sell Positions below pivot with targets at 0.67450 & 0.67040 in extension.
Alternative Price Action: Above pivot looks for a further upside with 0.68670 & 0.69100 as targets.
Comment: RSI below 50 levels and Pairs below its 20MA & 55MA.
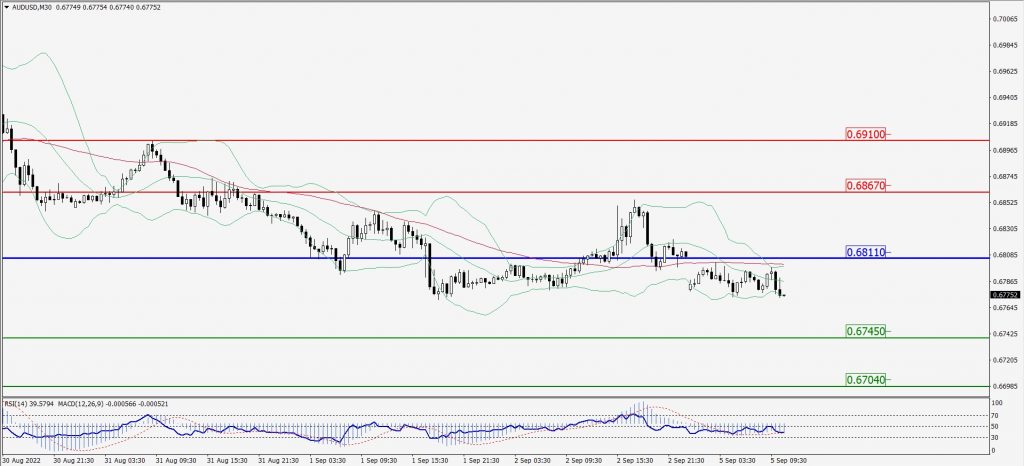
Green Lines Indicate Resistance Levels – Red Lines Indicate Support Levels
Light Blue is a Pivot Point – Black represents the price when the report was produced
CRUDEOIL Intraday: Trend on the upside
Our pivot point is at 88.13
Preferable Price Action: Above pivots buy oil with 90.74 & 92.77 as targets.
Alternative Price Action: Sell crude below pivot with targets at 85.59 and 83.69 in extension.
Comment: MACD is in the positive territory and Pairs above its 20MA & 55MA.
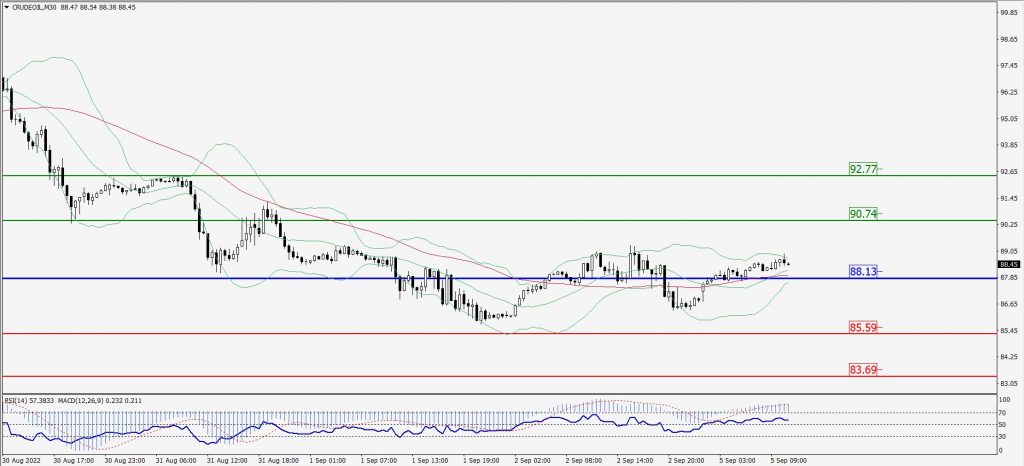
Green Lines Indicate Resistance Levels – Red Lines Indicate Support Levels
Light Blue is a Pivot Point – Black represents the price when the report was produced
XAU/USD Intraday: In a consolidation zone
Our pivot point is 1709.40
Preferable Price Action: Further upside to 1726.50 and 1740.20
Alternative Price Action: If the price gives a downside breakout of a pivot, then the price extends to 1694.10 and 1682.20.
Comment: MACD is flat territory.
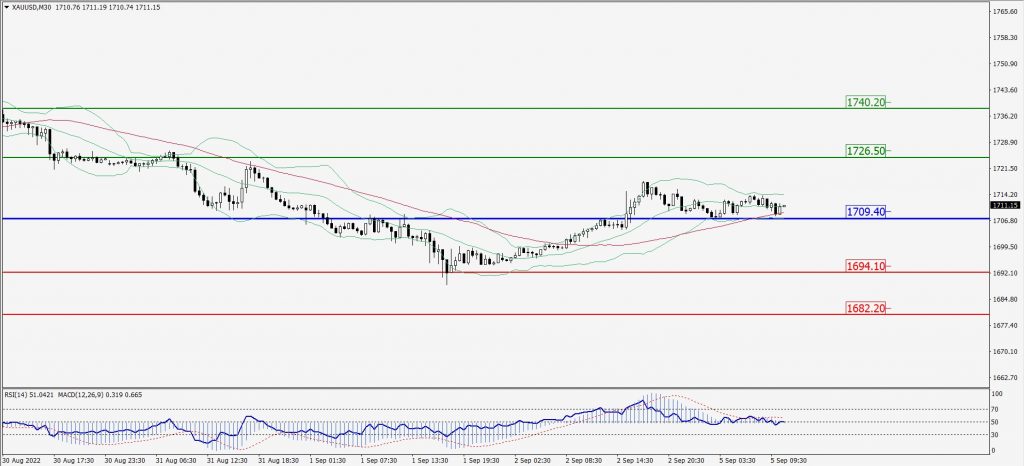
Green Lines Indicate Resistance Levels – Red Lines Indicate Support Levels
Light Blue is a Pivot Point – Black represents the price when the report was produced
Dow Jones Intraday: Trend on the downside
Our pivot point is 31,493.00
Preferable Price Action: Take sell positions below pivot with targets at 31,202.00 & 30,969.00.
Alternative Price Action: Above 31,493.00 looks for further upside to 31,754.00 & 31,967.00.
Comment: RSI below 50 levels and Pairs below its 20MA & 55MA.
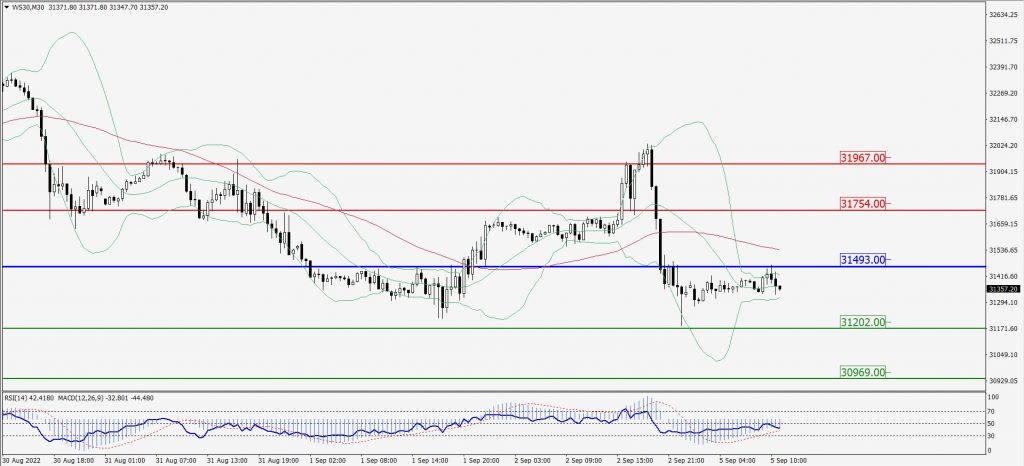
Green Lines Indicate Resistance Levels – Red Lines Indicate Support Levels
Light Blue is a Pivot Point – Black represents the price when the report was produced