Market Wrap: Stocks, Bonds, Commodities
Australia stocks were higher after the close on Wednesday, as gains in the IT, Consumer Discretionary and Financials sectors led shares higher.
The Dow Jones Industrial Average rose 825.43 points to 30,316.32, the S&P 500 gain 112.50 points to 3,790.93 and the Nasdaq Composite add 360.97 points to 11,176.41.
MSCI’s index of Asia-Pacific stocks outside Japan is ascend 2.74% to 577.93 levels. Australian index higher 1.74% to 6,815.70. Japanese Nikkei Index ascend 0.48% to 27,120.53.
European stocks were negative on Wednesday, with the Stoxx Europe 50 Index fell 0.84% to 3,455.25, Germany’s DAX drop 0.76% to 12,575.73, and France’s CAC down 0.73% to 5,995.35, and U.K.’s FTSE 100 slipped 1.01% to 7,013.40.
Benchmark 10-year U.S. Treasury fell as demand for safe assets ascend again, today 10-year bond yields a positive 2.15% to 3.6950.
Oil prices were little changed on Wednesday ahead of a meeting of OPEC+ producers to discuss a big cut in crude output after gaining more than 3% in the previous session.
Spot Brent crude oil subtract 0.65% to $91.23 per barrel. US West Texas Intermediate crude is down 0.67% to $86.03 a barrel.
The yellow metal gold is decline 0.48% to 1,722.10 dollars per ounce.
Market Wrap: Forex
Financial messaging system SWIFT has laid out its blueprint for a global central bank digital currency (CBDC) network following an 8-month experiment on different technologies and currencies.
Today, the U.S. dollar index measures the Greenback against a trade-weighted basket of six major currencies, which is rose 0.52% to 110.550.
The Euro US Dollar (EUR/USD) is a widely traded pair that is down 0.41% today. This left the pair trading around $0.99430.
The Japanese yen was positive against the U.S. dollar on Wednesday as the stock up. Today USD/JPY is ascend 0.22% to 144.410 level.
Another commodity-related currency negative against the U.S dollar, AUD/USD slipped 0.28% to 0.64820, and NZD/USD subtract 0.02 to 0.57290 level.
EUR/USD Intraday: Resistance level at 0.99980
Our pivot point is at 0.99980
Preferable Price Action: Take sell positions below pivot level with targets at 0.99210 & 0.98690 in extension.
Alternative Price Action: Above pivot looks for a further upside to 1.00570 & 1.01110.
Comment: RSI below 50 levels and Pairs below 20MA.
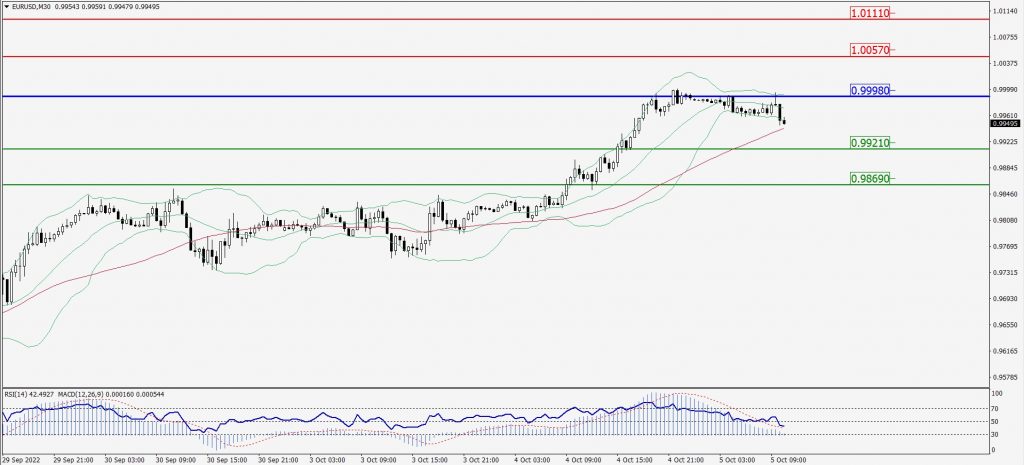
Green Lines Indicate Resistance Levels – Red Lines Indicate Support Levels
Light Blue is a Pivot Point – Black represents the price when the report was produced
GBP/USD Intraday: Resistance level at 1.15140
Our pivot point is at 1.15140
Preferable Price Action: Sell positions below pivot with targets at 1.13050 & 1.11530 in extension.
Alternative Price Action: The price below pivot would call for further upside to 1.17040 & 1.18560.
Comment: RSI below 50 levels and Pairs below 20MA.
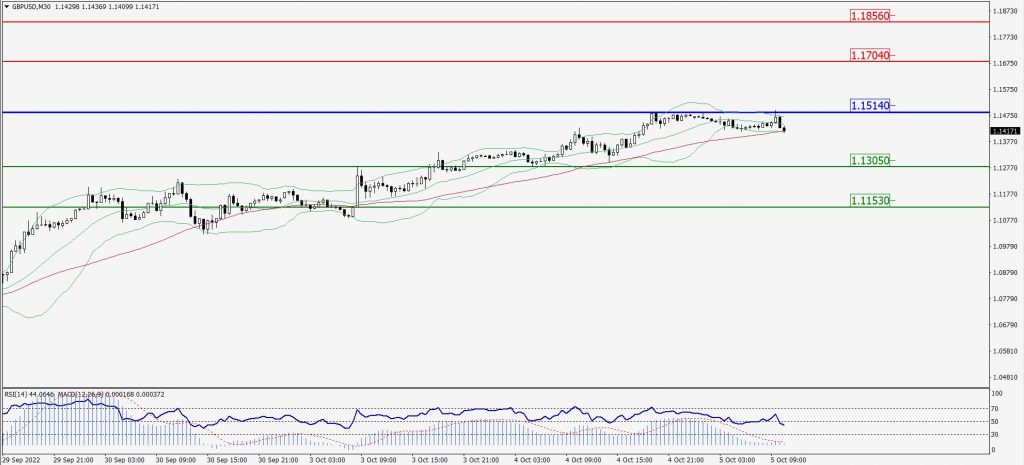
Green Lines Indicate Resistance Levels – Red Lines Indicate Support Levels
Light Blue is a Pivot Point – Black represents the price when the report was produced
USD/JPY Intraday: Trend on the upside
Our pivot point is at 144.260
Preferable Price Action: Buy position above pivot with the target at 144.840 and 145.220 in extension.
Alternative Price Action: The downside breakout of the pivot would call for 143.750 and 143.300.
Comment: MACD is positive territory and Pairs above its 20MA & 55MA.
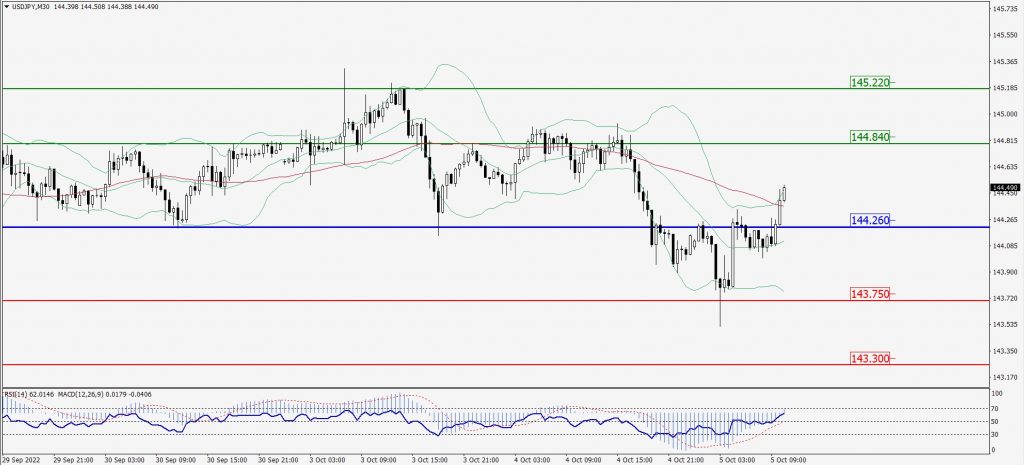
Green Lines Indicate Resistance Levels – Red Lines Indicate Support Levels
Light Blue is a Pivot Point – Black represents the price when the report was produced
AUD/USD Intraday: Trend on the downside
Our pivot point is at 0.65060
Preferable Price Action: Sell Positions below pivot with targets at 0.64610 & 0.64320 in extension.
Alternative Price Action: Above pivot looks for a further upside with 0.65410 & 0.65680 as targets.
Comment: RSI below 50 levels and Pairs below 20MA.
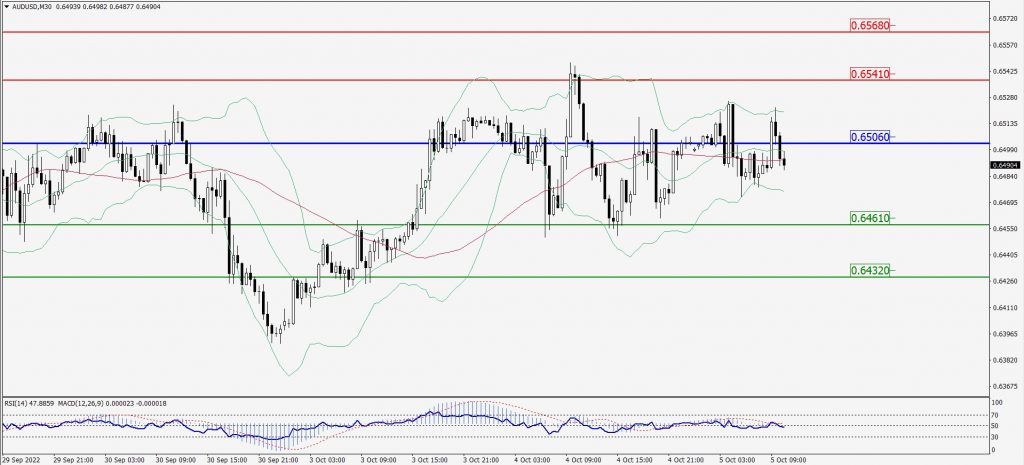
Green Lines Indicate Resistance Levels – Red Lines Indicate Support Levels
Light Blue is a Pivot Point – Black represents the price when the report was produced
CRUDEOIL Intraday: Major trend on the upside
Our pivot point is at 85.67
Preferable Price Action: Above pivots buy oil with 87.74 & 89.41 as targets.
Alternative Price Action: Sell crude below pivot with targets at 83.75 and 82.28 in extension.
Comment: MACD is in the positive territory and Pairs above its 20MA & 55MA.
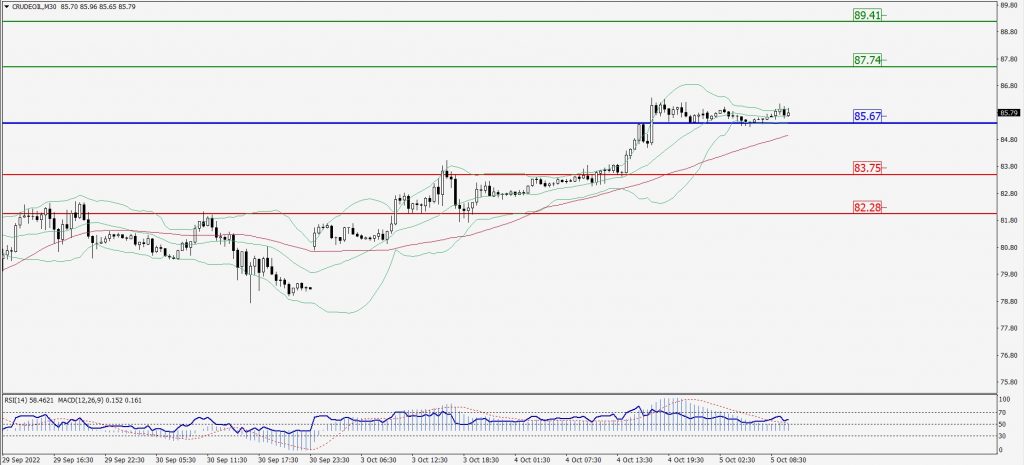
Green Lines Indicate Resistance Levels – Red Lines Indicate Support Levels
Light Blue is a Pivot Point – Black represents the price when the report was produced
XAU/USD Intraday: Trend on the downside
Our pivot point is 1728.50
Preferable Price Action: Further downside to 1706.00 and 1689.00
Alternative Price Action: If the price gives an upside breakout of a pivot, then the price extends to 1745.80 and 1763.20.
Comment: MACD is negative territory and Pairs below 20MA.
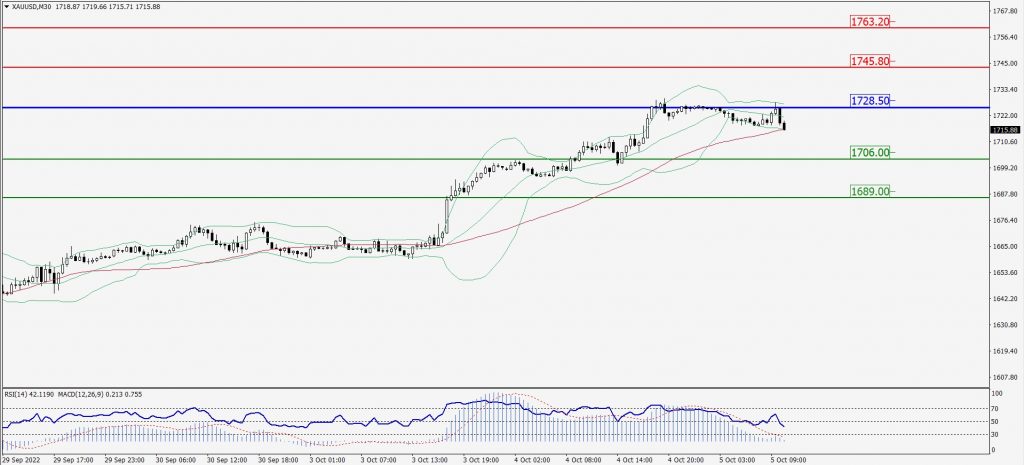
Green Lines Indicate Resistance Levels – Red Lines Indicate Support Levels
Light Blue is a Pivot Point – Black represents the price when the report was produced
Dow Jones Intraday: Trend on the downside
Our pivot point is 30,259.00
Preferable Price Action: Take sell positions below pivot with targets at 29,929.00 & 29,637.00.
Alternative Price Action: Above 30,259.00 looks for further upside to 30,529.00 & 30,798.00.
Comment: RSI below 50 levels and Pairs below 55MA.
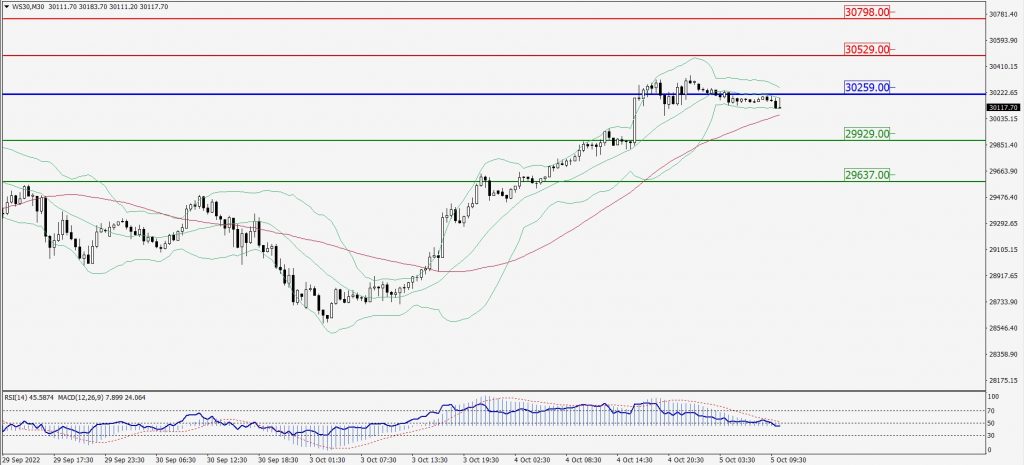
Green Lines Indicate Resistance Levels – Red Lines Indicate Support Levels
Light Blue is a Pivot Point – Black represents the price when the report was produced