Market Wrap: Stocks, Bonds, Commodities
US stocks ended with modest losses on Monday, as the focus shifted after last week’s AI-fuelled rally to upcoming economic data that could affect the timing of the Federal Reserve’s expected interest rate cut.
The Dow Jones Industrial Average fell 62.30 points to 39,069.23, the S&P 500 lose 0.38% to 5,069.53 and the Nasdaq Composite subtract 20.57 points to 15,976.25.
MSCI’s index of Asia-Pacific stocks outside Japan is advance 0.08% to 642.41 levels. The Australian index was higher by 0.13% to 7,663.00. Japanese Nikkei Index asceend 0.17% today.
European stocks were positive on Monday, with the Stoxx Europe 50 Index rose 0.22% to 4,874.75, Germany’s DAX ascend 0.36% to 17,487.95, and France’s CAC advance 0.03% to 7,931.38 and U.K.’s FTSE 100 add 0.02% to 7,685.16.
Benchmark 10-year U.S. Treasury fell as deman for safe assets ascend again, today 10-year bond yields negative 0.74% to 4.2670.
Oil prices on Tuesday built on gains made a day earlier amid attacks on shipping in the Red Sea that have exacerbated supply worries.
Spot Brent crude oil drop 0.16% to $81.54 per barrel. US West Texas Intermediate crude is down 0.09% to $77.50 a barrel.
The yellow metal gold is advance 0.40% to 2,046.05 dollars per ounce.
Market Wrap: Forex
The dollar traded on the back foot on Tuesday, as markets looked ahead to a week of key U.S. economic data that will provide fresh signals on how soon the Federal Reserve may begin cutting interest rates.
Today, the U.S. dollar index measures the Greenback against a trade-weighted basket of six major currencies, which slipped 0.16% to 103.590.
The Euro US Dollar (EUR/USD) is a widely traded pair that is up 0.11% today. This left the pair trading around $1.08590.
The Japanese yen was negative against the U.S. dollar on Monday. Today USD/JPY is slipped 0.34% to the 150.170 level.
Another commodity-related currency positive against the U.S dollar, AUD/USD rose 0.21% to 0.65530, and NZD/USD slipped 0.06% to 0.61690 level.
EUR/USD Intraday: Support level at 1.08480
Our pivot point is at 1.08480
Preferable Price Action: Take buy positions above pivot level with targets at 1.08650 & 1.08760 in extension.
Alternative Price Action: Below pivot looks for a further downside to 1.08350 & 1.08260.
Comment: RSI is above 50 levels and Pairs above 55MA.
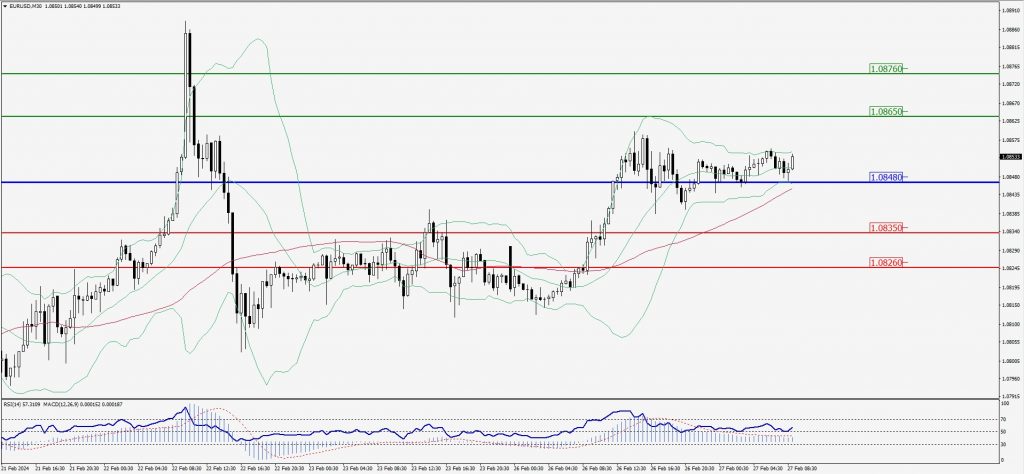
Green Lines Indicate Resistance Levels – Red Lines Indicate Support Levels
Light Blue is a Pivot Point – Black represents the price when the report was produced
GBP/USD Intraday: Major support level at 1.26800
Our pivot point is at 1.26800
Preferable Price Action: Buy positions above pivot with targets at 1.26970 & 1.27090 in extension.
Alternative Price Action: The price below pivot would call for further downside to 1.26660 & 1.26540.
Comment: RSI is above 50 levels and Pairs above its 20MA & 55MA.
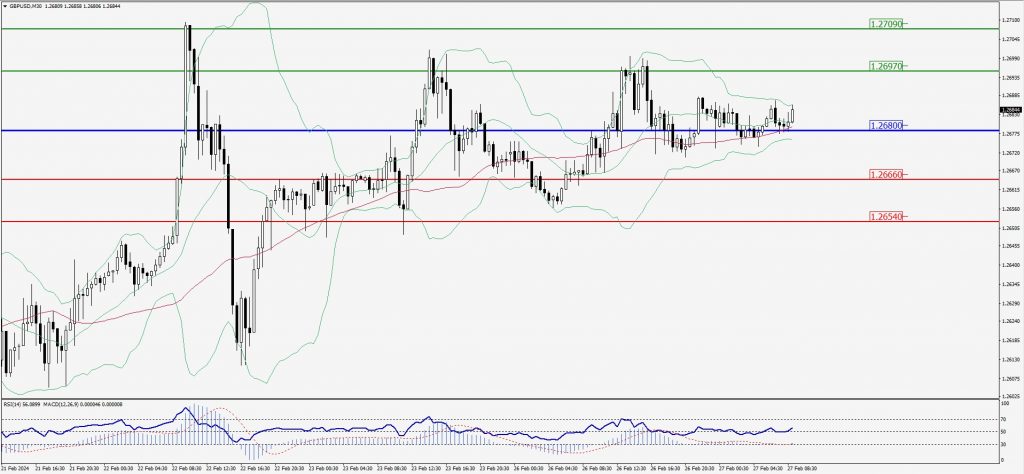
Green Lines Indicate Resistance Levels – Red Lines Indicate Support Levels
Light Blue is a Pivot Point – Black represents the price when the report was produced
USD/JPY Intraday: Trend on the downside
Our pivot point is at 150.530
Preferable Price Action: Sell position below pivot with the target at 150.330 and 150.200 in extension.
Alternative Price Action: The upside breakout of the pivot would call for 150.690 and 150.830.
Comment: MACD is below 50 level and Pairs below its 20MA & 55MA.
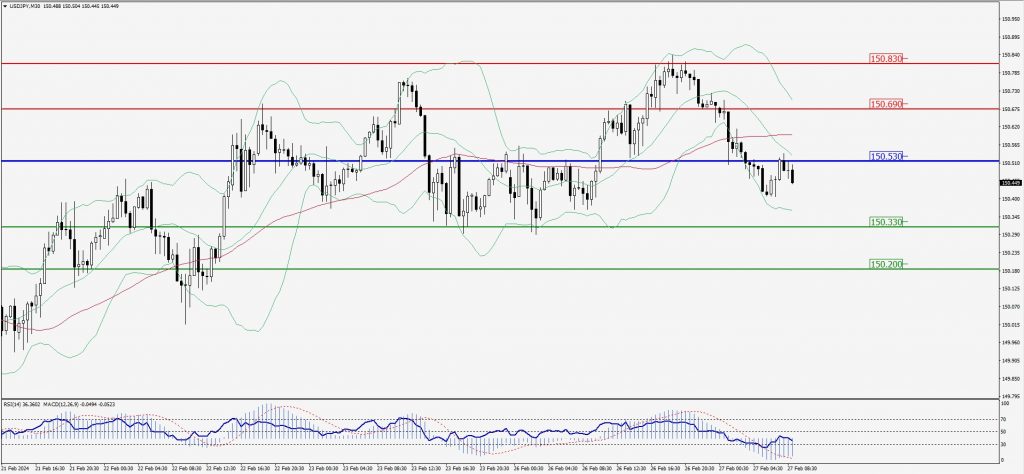
Green Lines Indicate Resistance Levels – Red Lines Indicate Support Levels
Light Blue is a Pivot Point – Black represents the price when the report was produced
AUD/USD Intraday: Major trend in the upside
Our pivot point is at 0.65500
Preferable Price Action: Buy positions above pivot with targets at 0.65620 & 0.65720 in extension.
Alternative Price Action: Below pivot looks for a further downside with 0.65370 & 0.65280 as targets.
Comment: RSI is above 50 levels and Pairs above its 20MA & 55MA.
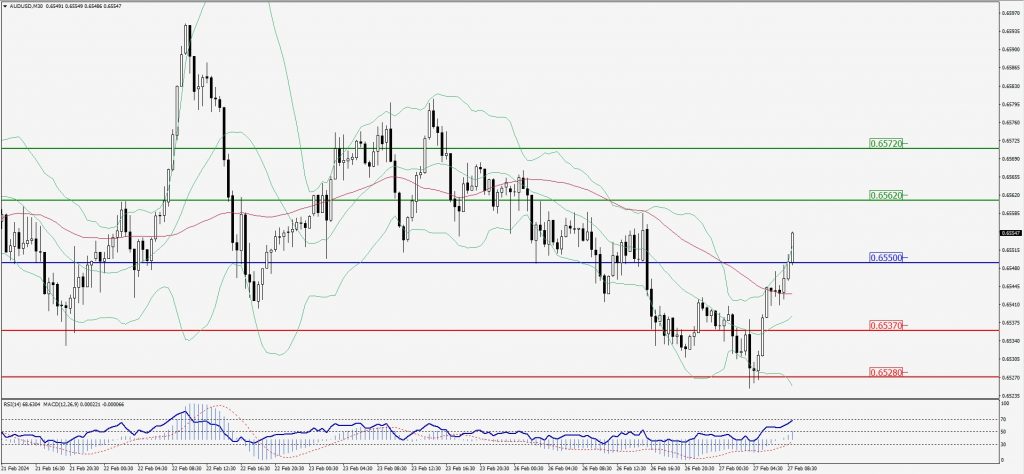
Green Lines Indicate Resistance Levels – Red Lines Indicate Support Levels
Light Blue is a Pivot Point – Black represents the price when the report was produced
CRUDEOIL Intraday: Trend on the upside
Our pivot point is at 77.43
Preferable Price Action: Above pivot buy oil with 77.98 & 78.37 as targets.
Alternative Price Action: Sell crude below pivot with targets at 76.98 and 76.64 in extension.
Comment: MACD is positive territory and Pairs above its 20AM & 55MA.
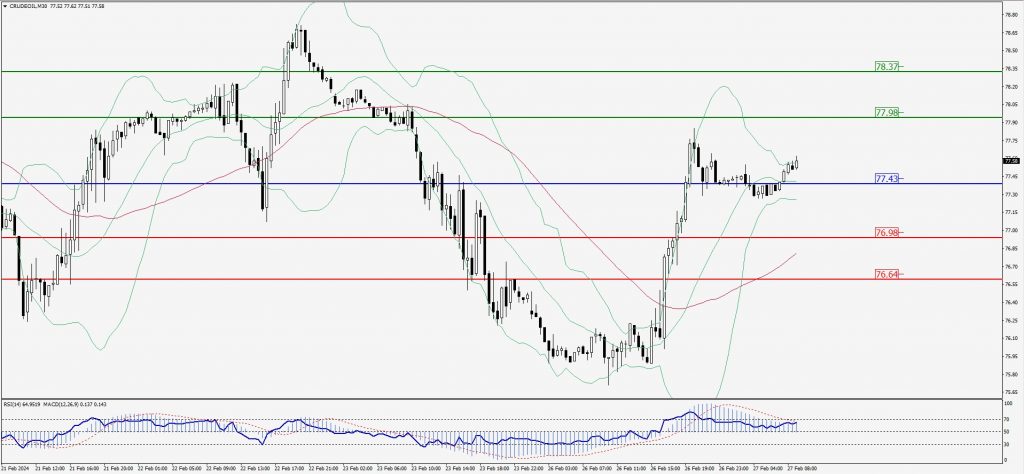
Green Lines Indicate Resistance Levels – Red Lines Indicate Support Levels
Light Blue is a Pivot Point – Black represents the price when the report was produced
XAU/USD Intraday: Trend on the upside
Our pivot point is 2033.70
Preferable Price Action: Further upside to 2037.40 and 2040.20.
Alternative Price Action: If the price gives a downside breakout of a pivot, then the price extends to 2030.10 and 2027.60.
Comment: MACD is above 50 level and Pairs above its 20MA & 55MA.
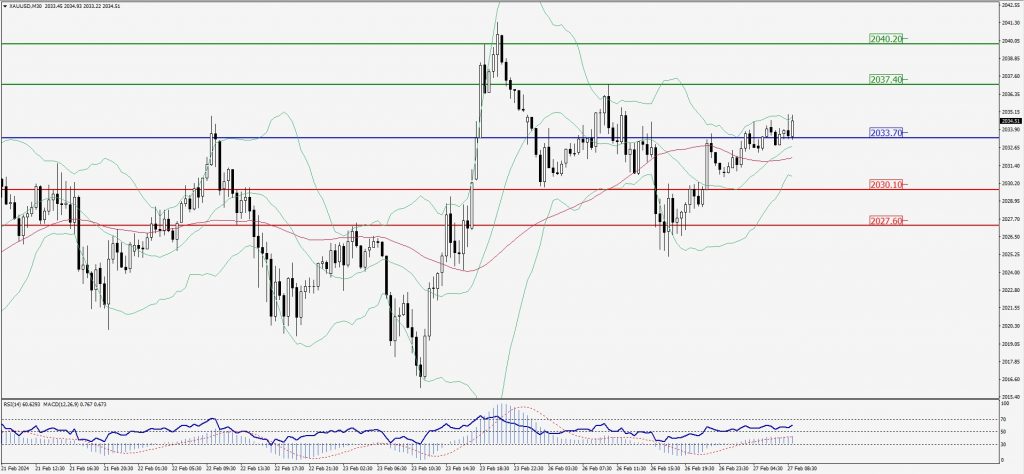
Green Lines Indicate Resistance Levels – Red Lines Indicate Support Levels
Light Blue is a Pivot Point – Black represents the price when the report was produced
Dow Jones Intraday: In a consolidation zone
Our pivot point is 39,049.00
Preferable Price Action: Take buy positions above the pivot with targets at 39,195.00 & 39,301.00.
Alternative Price Action: Below 39,049.00 looks for further downside to 38,924.00 & 38,844.00.
Comment: RSI is below 50 levels and Pairs below 55MA.
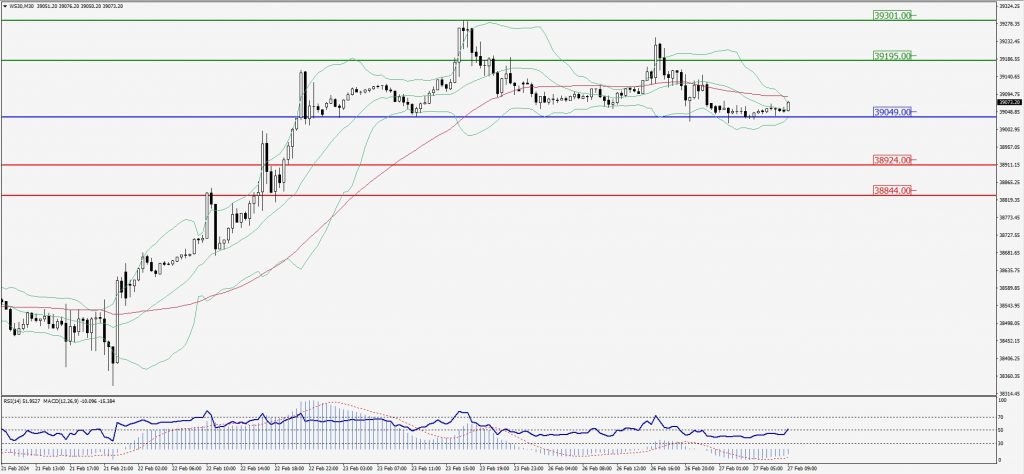
Green Lines Indicate Resistance Levels – Red Lines Indicate Support Levels
Light Blue is a Pivot Point – Black represents the price when the report was produced