Market Wrap: Stocks, Bonds, Commodities
Stock futures are mixed Monday night as the market looks to maintain momentum in the holiday-shortened week.
The Dow Jones Industrial Average rose 115.80 points to 34,837.71, the S&P 500 gain 0.18% to 4,515.77 and the Nasdaq Composite subtract 3.15 points to 14,031.82.
MSCI’s index of Asia-Pacific stocks outside Japan is decline 0.98% to 627.73 levels. The Australian index was lower by 0.06% to 7,314.30. Japanese Nikkei Index ascend 0.27% today.
European stocks were negative on Tuesday, with the Stoxx Europe 50 Index fell 0.93% to 4,289.95, Germany’s DAX drop 0.78% to 15,702.05, and France’s CAC decline 1.21% to 7,191.54 and U.K.’s FTSE 100 subtract 0.60% to 7,408.80.
Benchmark 10-year U.S. Treasury fell as demand for safe assets ascend again, today 10-year bond yields positive 1.04% to 4.2160.
Oil prices ticked up in Asian morning trade on Monday, as market sentiment was buoyed by positive China and US economic data, as well as expectations of ongoing crude supply cuts from major producers.
Spot Brent crude oil drop 0.93% to $88.14 per barrel. US West Texas Intermediate crude is down 0.47% to $85.14 a barrel.
The yellow metal gold is decline 0.36% to 1,960.15 dollars per ounce.
Market Wrap: Forex
The U.S. dollar gained in early European trade Tuesday, as traders turned to this safe haven after disappointing Chinese services activity hit risk-taking sentiment.
Today, the U.S. dollar index measures the Greenback against a trade-weighted basket of six major currencies, which surged 0.34% to 104.557.
The Euro US Dollar (EUR/USD) is a widely traded pair that is down 0.44% today. This left the pair trading around $1.07450.
The Japanese yen was negative against the U.S. dollar on Tuesday. Today USD/JPY is surged 0.27% to the 146.860 level.
Another commodity-related currency negative against the U.S dollar, AUD/USD fell 1.29% to 0.63770, and NZD/USD slipped 0.99% to 0.58790 level.
EUR/USD Intraday: Trend on the downside
Our pivot point is at 1.07900
Preferable Price Action: Take sell positions below pivot level with targets at 1.07360 & 1.07000 in extension.
Alternative Price Action: Above pivot looks for a further upside to 1.08410 & 1.08830.
Comment: RSI is below 50 levels and Pairs below its 20MA & 55MA.
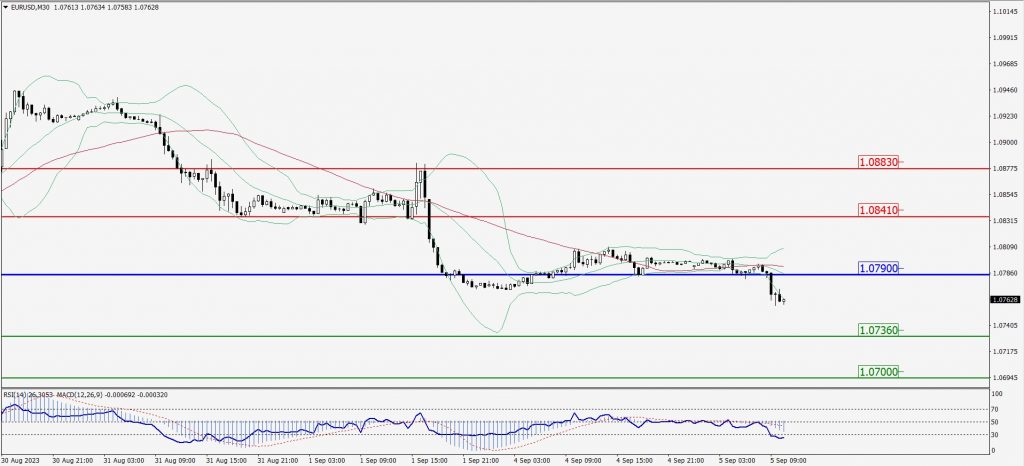
Green Lines Indicate Resistance Levels – Red Lines Indicate Support Levels
Light Blue is a Pivot Point – Black represents the price when the report was produced
GBP/USD Intraday: Trend on the downside
Our pivot point is at 1.25960
Preferable Price Action: Sell positions below pivot with targets at 1.25520 & 1.25270 in extension.
Alternative Price Action: The price above pivot would call for further upside to 1.26340 & 1.26650.
Comment: RSI is below 50 levels and Pairs below its 20MA & 55MA.
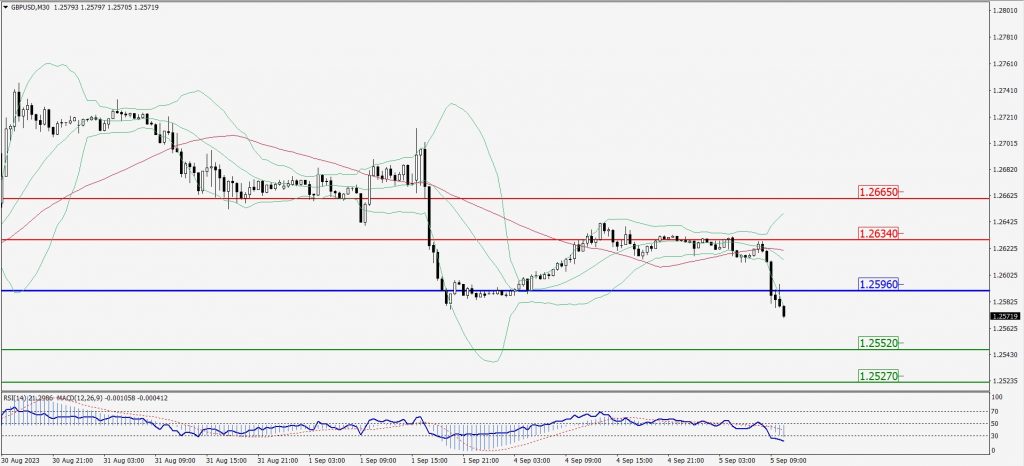
Green Lines Indicate Resistance Levels – Red Lines Indicate Support Levels
Light Blue is a Pivot Point – Black represents the price when the report was produced
USD/JPY Intraday: Major trend on the upside
Our pivot point is at 146.820
Preferable Price Action: Buy position above pivot with the target at 147.380 and 147.760 in extension.
Alternative Price Action: The downside breakout of the pivot would call for 146.260 and 145.870.
Comment: MACD is above 50 level and Pairs above its 20MA & 55MA.
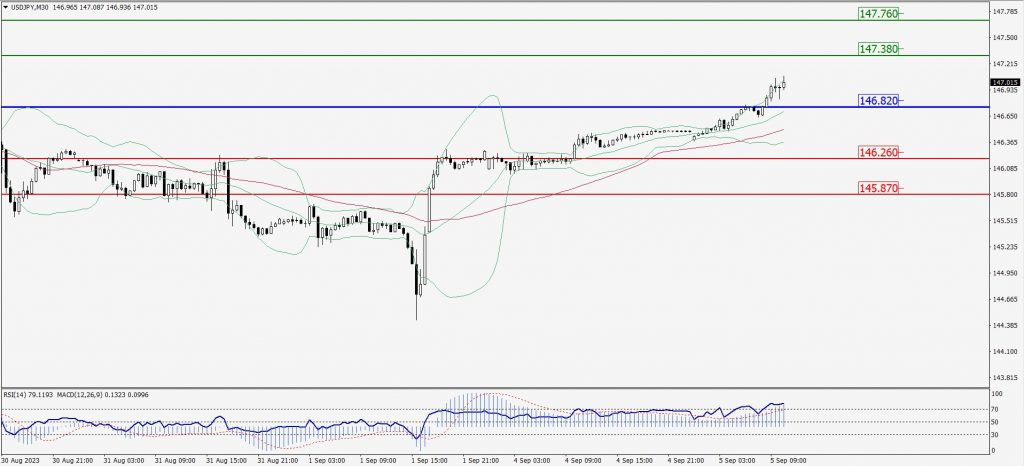
Green Lines Indicate Resistance Levels – Red Lines Indicate Support Levels
Light Blue is a Pivot Point – Black represents the price when the report was produced
AUD/USD Intraday: Major trend on the downside
Our pivot point is at 0.63960
Preferable Price Action: Sell positions below pivot with targets at 0.63560 & 0.63270 in extension.
Alternative Price Action: Above pivot looks for a further upside with 0.64300 & 0.65540 as targets.
Comment: RSI is below 50 levels and Pairs below its 20MA & 55MA.
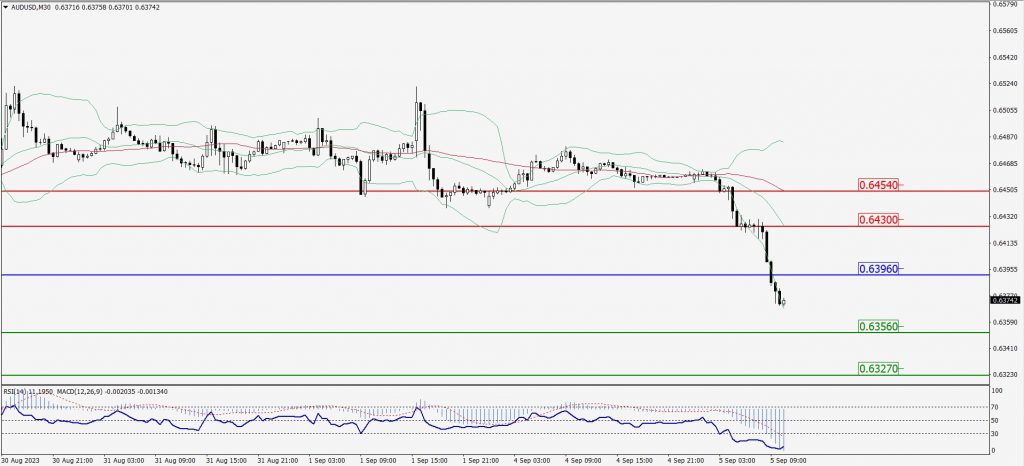
Green Lines Indicate Resistance Levels – Red Lines Indicate Support Levels
Light Blue is a Pivot Point – Black represents the price when the report was produced
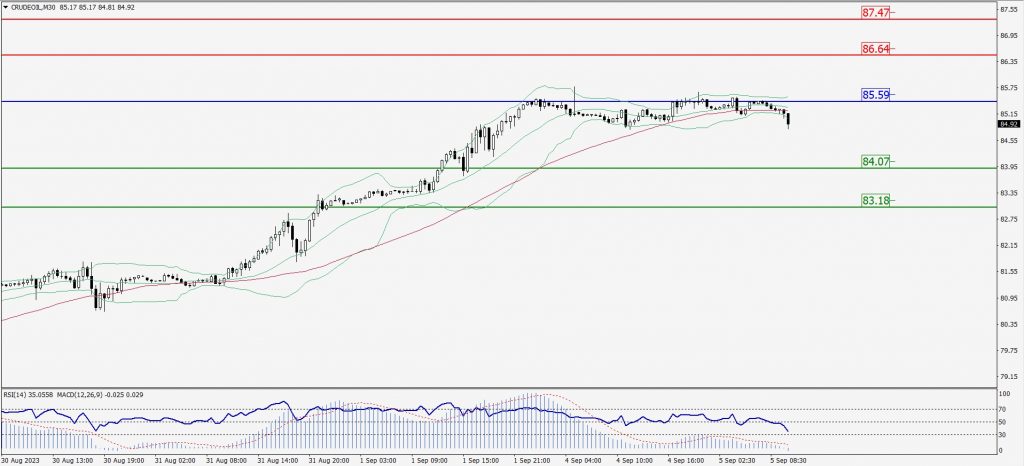
CRUDEOIL Intraday: Major resistance level at 85.59
Our pivot point is at 85.59
Preferable Price Action: Below pivot sell oil with 84.07 & 83.18 as targets.
Alternative Price Action: Buy crude above pivot with targets at 86.64 and 87.47 in extension.
Comment: MACD is negative territory and Pairs below 20MA.
Green Lines Indicate Resistance Levels – Red Lines Indicate Support Levels
Light Blue is a Pivot Point – Black represents the price when the report was produced
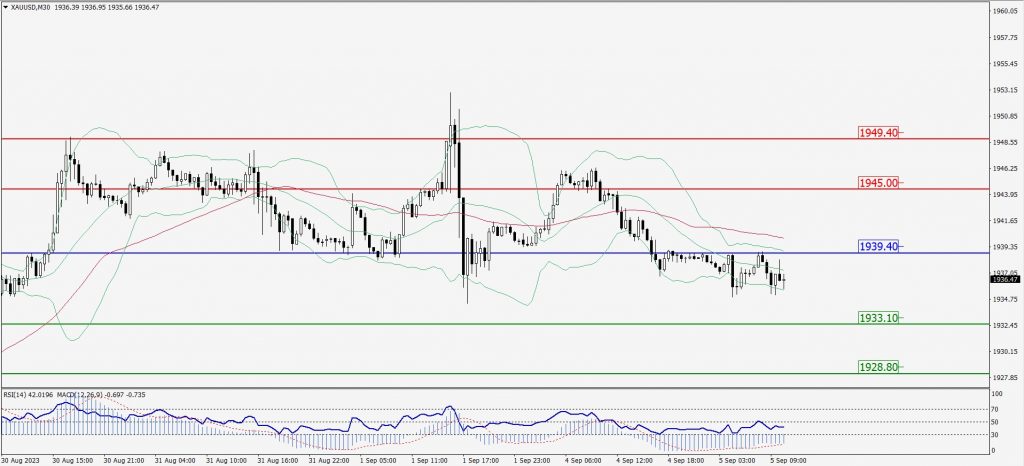
XAU/USD Intraday: Trend on the downside
Our pivot point is 1939.40
Preferable Price Action: Further downside to 1933.10 and 1928.80.
Alternative Price Action: If the price gives an upside breakout of a pivot, then the price extends to 1945.00 and 1949.40.
Comment: MACD is below 50 level and Pairs below 55MA.
Green Lines Indicate Resistance Levels – Red Lines Indicate Support Levels
Light Blue is a Pivot Point – Black represents the price when the report was produced
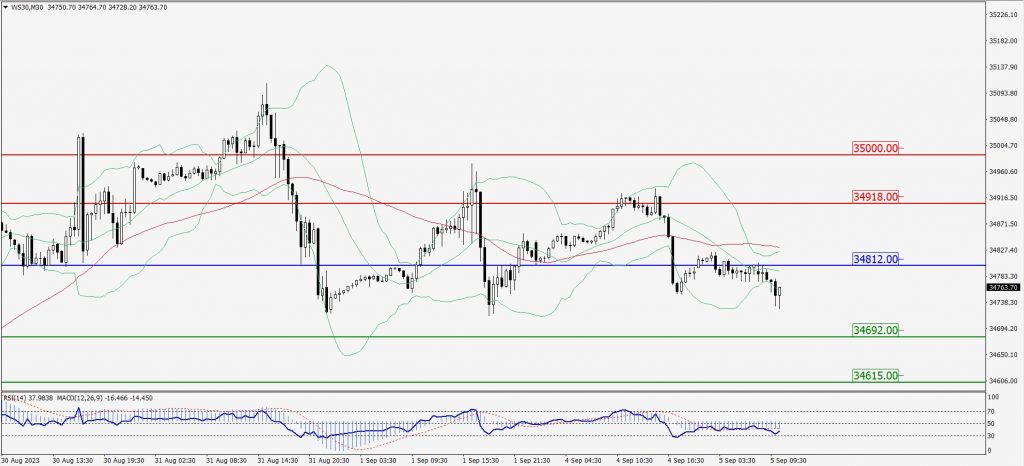
Dow Jones Intraday: Trend on the downside
Our pivot point is 34,812.00
Preferable Price Action: Take sell positions below the pivot with targets at 34,692.00 & 34,615.00.
Alternative Price Action: Above 34,812.00 looks for further upside to 34,918.00 & 35,000.00.
Comment: RSI is below 50 levels and Pairs below its 20MA & 55MA.
Green Lines Indicate Resistance Levels – Red Lines Indicate Support Levels
Light Blue is a Pivot Point – Black represents the price when the report was produced