Market Wrap: Stocks, Bonds, Commodities
The Dow Jones Industrial Average rose on Friday as traders weighed the latest US jobs report to conclude a winning week.
The Dow Jones Industrial Average rose 115.80 points to 34,837.71, the S&P 500 gain 0.18% to 4,515.77 and the Nasdaq Composite subtract 3.15 points to 14,031.82.
MSCI’s index of Asia-Pacific stocks outside Japan is advance 1.35% to 633.90 levels. The Australian index was higher by 0.56% to 7,318.80. Japanese Nikkei Index ascend 0.53% today.
European stocks were positive on Monday, with the Stoxx Europe 50 Index rose 0.74% to 4,313.55, Germany’s DAX ascend 0.49% to 15,918.95, and France’s CAC advance 0.58% to 7,338.76 and U.K.’s FTSE 100 add 0.47% to 7,498.20.
Benchmark 10-year U.S. Treasury fell as demand for safe assets ascend again, today 10-year bond yields positive 0.75% to 4.2060.
Oil prices were set to snap a two-week losing streak as they rose for a fourth consecutive session on Friday due to tightening supplies and expectations that the OPEC+ group of oil producers would extend output cuts to the end of the year.
Spot Brent crude oil ascend 0.14% to $88.70 per barrel. US West Texas Intermediate crude is up 0.21% to $85.71 a barrel.
The yellow metal gold is decline 0.01% to 1,966.85 dollars per ounce.
Market Wrap: Forex
The dollar edged lower on Monday, with U.S. markets closed for a holiday, as investors weighed U.S. jobs data that showed some signs of cooling, boosting bets the Federal Reserve could be at the end of its monetary tightening cycle.
Today, the U.S. dollar index measures the Greenback against a trade-weighted basket of six major currencies, which slipped 0.12% to 104.067.
The Euro US Dollar (EUR/USD) is a widely traded pair that is up 0.20% today. This left the pair trading around $1.07950.
The Japanese yen was negative against the U.S. dollar on Monday. Today USD/JPY is surged 0.10% to the 146.390 level.
Another commodity-related currency positive against the U.S dollar, AUD/USD rose 0.26% to 0.64650, and NZD/USD surged 0.02% to 0.59470 level.
EUR/USD Intraday: Trend on the upside
Our pivot point is at 1.07840
Preferable Price Action: Take buy positions above pivot level with targets at 1.08360 & 1.08740 in extension.
Alternative Price Action: Below pivot looks for a further downside to 1.07370 & 1.07040.
Comment: RSI is above 50 levels and Pairs above 20MA.
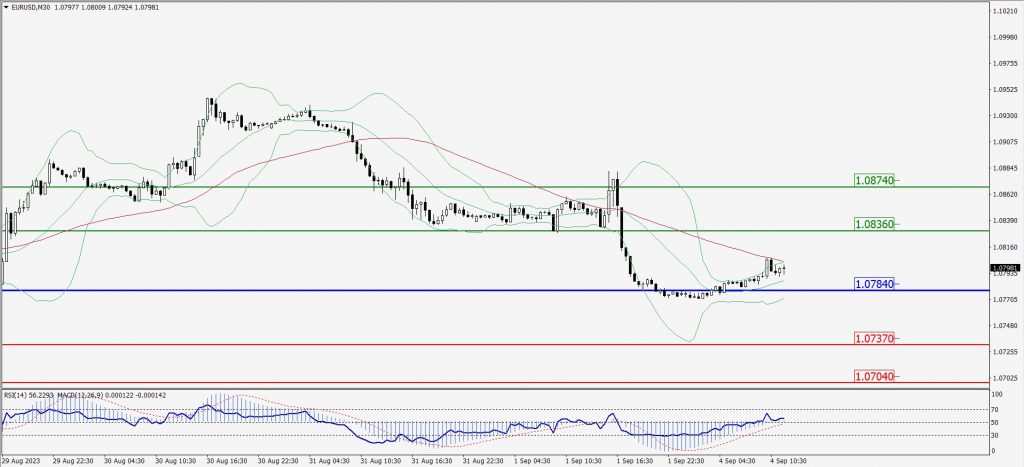
Green Lines Indicate Resistance Levels – Red Lines Indicate Support Levels
Light Blue is a Pivot Point – Black represents the price when the report was produced
GBP/USD Intraday: Trend on the upside
Our pivot point is at 1.26180
Preferable Price Action: Buy positions above pivot with targets at 1.26730 & 1.27040 in extension.
Alternative Price Action: The price below pivot would call for further downside to 1.25710 & 1.25450.
Comment: RSI is above 50 levels and Pairs above 20MA.
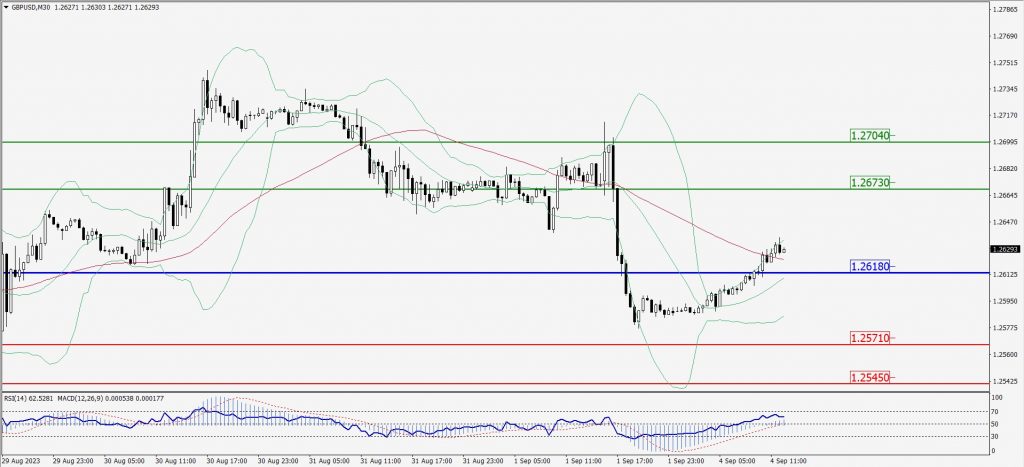
Green Lines Indicate Resistance Levels – Red Lines Indicate Support Levels
Light Blue is a Pivot Point – Black represents the price when the report was produced
USD/JPY Intraday: Support level at 146.150
Our pivot point is at 146.150
Preferable Price Action: Buy position above pivot with the target at 147.040 and 147.540 in extension.
Alternative Price Action: The downside breakout of the pivot would call for 145.460 and 144.980.
Comment: MACD is above 50 level and Pairs above its 20MA & 55MA.
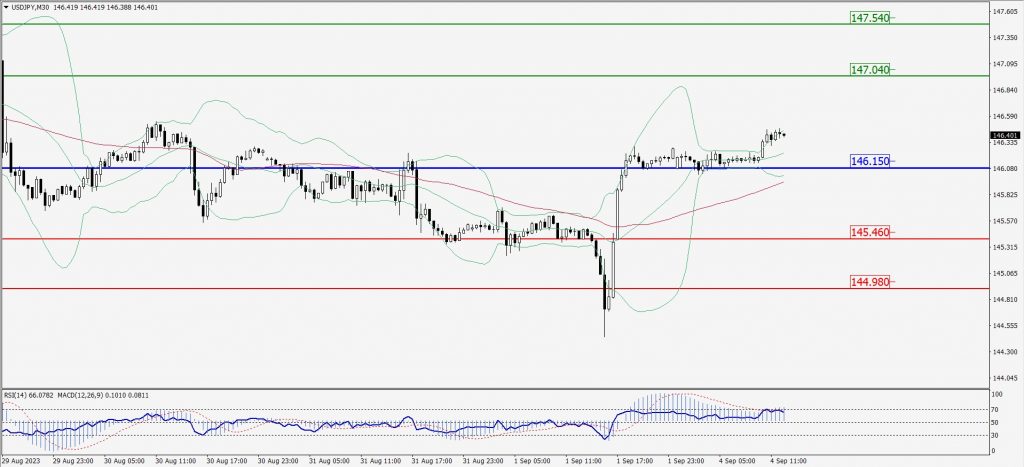
Green Lines Indicate Resistance Levels – Red Lines Indicate Support Levels
Light Blue is a Pivot Point – Black represents the price when the report was produced
AUD/USD Intraday: In a consolidation zone
Our pivot point is at 0.64790
Preferable Price Action: Sell positions below pivot with targets at 0.64460 & 0.64300 in extension.
Alternative Price Action: Above pivot looks for a further upside with 0.65050 & 0.65210 as targets.
Comment: RSI is at 50 levels.
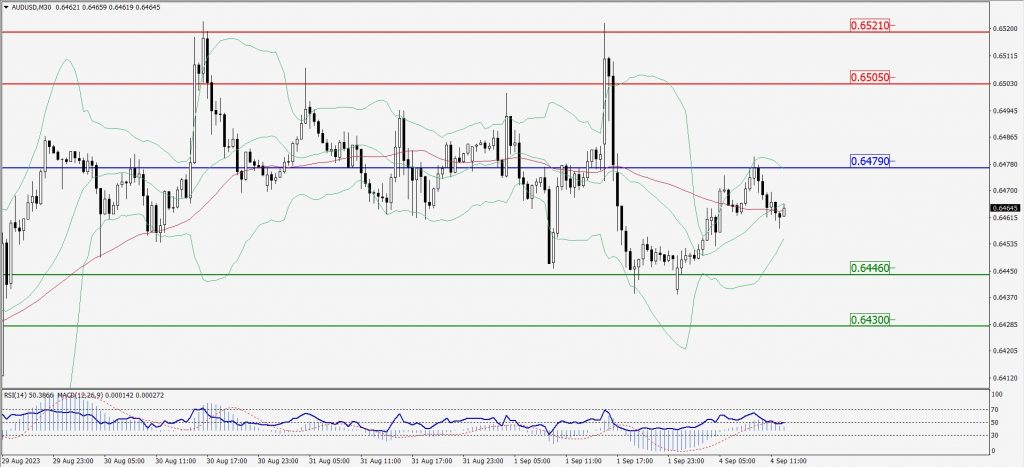
Green Lines Indicate Resistance Levels – Red Lines Indicate Support Levels
Light Blue is a Pivot Point – Black represents the price when the report was produced
CRUDEOIL Intraday: Trend on the upside
Our pivot point is at 85.02
Preferable Price Action: Above pivot buy oil with 86.64 & 87.69 as targets.
Alternative Price Action: Sell crude below pivot with targets at 83.64 and 82.62 in extension.
Comment: MACD is positive territory and Pairs above 55MA.
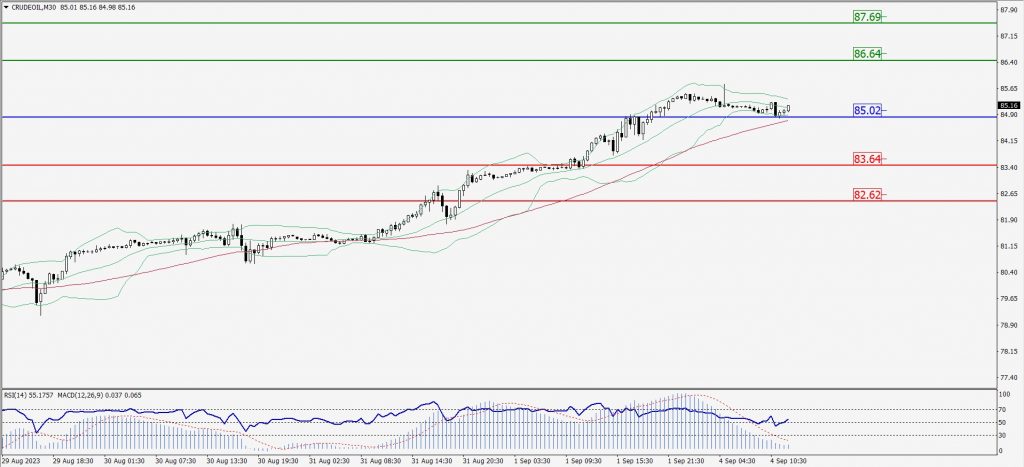
Green Lines Indicate Resistance Levels – Red Lines Indicate Support Levels
Light Blue is a Pivot Point – Black represents the price when the report was produced
XAU/USD Intraday: Resistance level at 1944.70
Our pivot point is 1944.70
Preferable Price Action: Further downside to 1935.80 and 1930.50.
Alternative Price Action: If the price gives an upside breakout of a pivot, then the price extends to 1952.60 and 1958.50.
Comment: MACD is below 50 level and Pairs below 55MA.
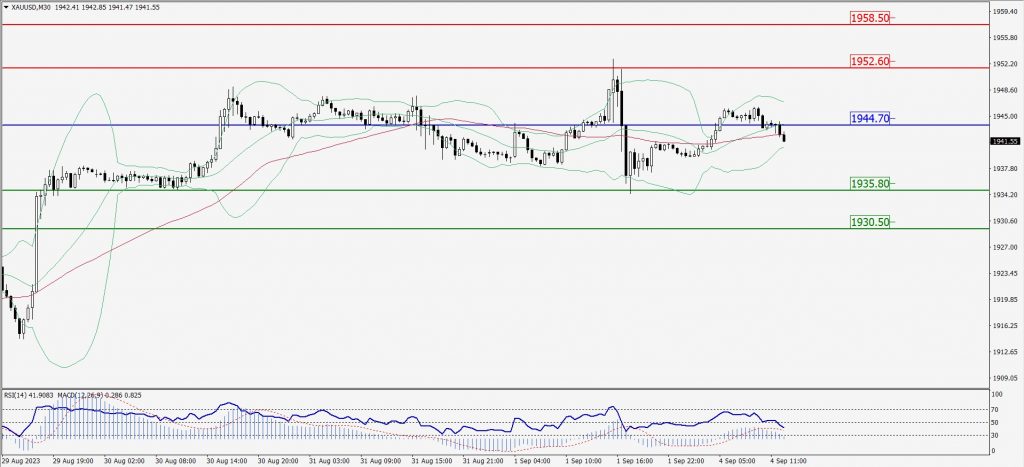
Green Lines Indicate Resistance Levels – Red Lines Indicate Support Levels
Light Blue is a Pivot Point – Black represents the price when the report was produced
Dow Jones Intraday: Trend on the upside
Our pivot point is 34,881.00
Preferable Price Action: Take buy positions above the pivot with targets at 35,009.00 & 35,115.00.
Alternative Price Action: Below 34,881.00 looks for further downside to 34,749.00 & 34,656.00.
Comment: RSI is above 50 levels and Pairs above its 20MA & 55MA.
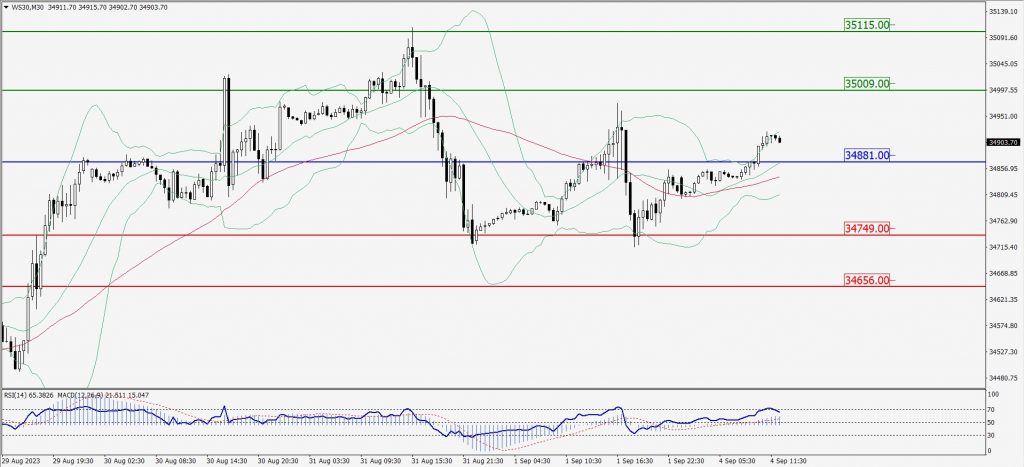
Green Lines Indicate Resistance Levels – Red Lines Indicate Support Levels
Light Blue is a Pivot Point – Black represents the price when the report was produced