Market Wrap: Stocks, Bonds, Commodities
S&P 500 futures traded near flat on Tuesday night as Wall Street looked beyond the losing session that marked the start of the holiday-shortened trading week.
The Dow Jones Industrial Average fell 195.74 points to 34,641.97, the S&P 500 lose 0.42% to 4,496.83 and the Nasdaq Composite subtract 10.86 points to 14,020.95.
MSCI’s index of Asia-Pacific stocks outside Japan is decline 0.47% to 624.45 levels. The Australian index was lower by 0.78% to 7,257.10. Japanese Nikkei Index ascend 0.80% today.
European stocks were negative on Wednesday, with the Stoxx Europe 50 Index fell 0.68% to 4,241.15, Germany’s DAX drop 0.43% to 15,703.65, and France’s CAC decline 0.84% to 7,194.15 and U.K.’s FTSE 100 subtract 0.79% to 7,378.66.
Benchmark 10-year U.S. Treasury fell as demand for safe assets ascend again, today 10-year bond yields negative 0.05% to 4.2680.
Oil prices surged 2 percent on Tuesday to their highest since November, after Saudi Arabia and Russia extended their voluntary supply cuts by three months to the end of this year, worrying investors about potential shortages during peak winter demand.
Spot Brent crude oil drop 0.54% to $89.54 per barrel. US West Texas Intermediate crude is down 0.53% to $86.25 a barrel.
The yellow metal gold is decline 0.20% to 1,948.65 dollars per ounce.
Market Wrap: Forex
The dollar rose to a near six-month high against a basket of currencies on Tuesday as jitters over global growth, particularly in China, caused investors to flock to the safe-haven U.S. currency.
Today, the U.S. dollar index measures the Greenback against a trade-weighted basket of six major currencies, which slipped 0.07% to 104.689.
The Euro US Dollar (EUR/USD) is a widely traded pair that is up 0.12% today. This left the pair trading around $1.07340.
The Japanese yen was negative against the U.S. dollar on Wednesday. Today USD/JPY is slipped 0.19% to the 147.410 level.
Another commodity-related currency mixed against the U.S dollar, AUD/USD rose 0.14% to 0.63840, and NZD/USD slipped 0.03% to 0.58820 level.
EUR/USD Intraday: Trend on the upside
Our pivot point is at 1.07260
Preferable Price Action: Take buy positions above pivot level with targets at 1.07670 & 1.07970 in extension.
Alternative Price Action: Below pivot looks for a further downside to 1.06890 & 1.06680.
Comment: RSI is above 50 levels and Pairs above 20MA.
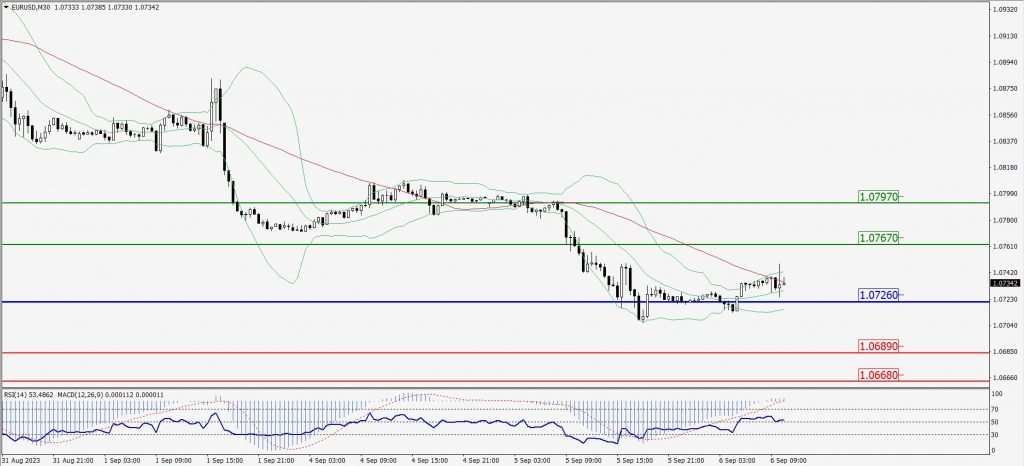
Green Lines Indicate Resistance Levels – Red Lines Indicate Support Levels
Light Blue is a Pivot Point – Black represents the price when the report was produced
GBP/USD Intraday: Resistance level at 1.25840
Our pivot point is at 1.25840
Preferable Price Action: Sell positions below pivot with targets at 1.25370 & 1.25080 in extension.
Alternative Price Action: The price above pivot would call for further upside to 1.26280 & 1.26610.
Comment: RSI is below 50 levels.
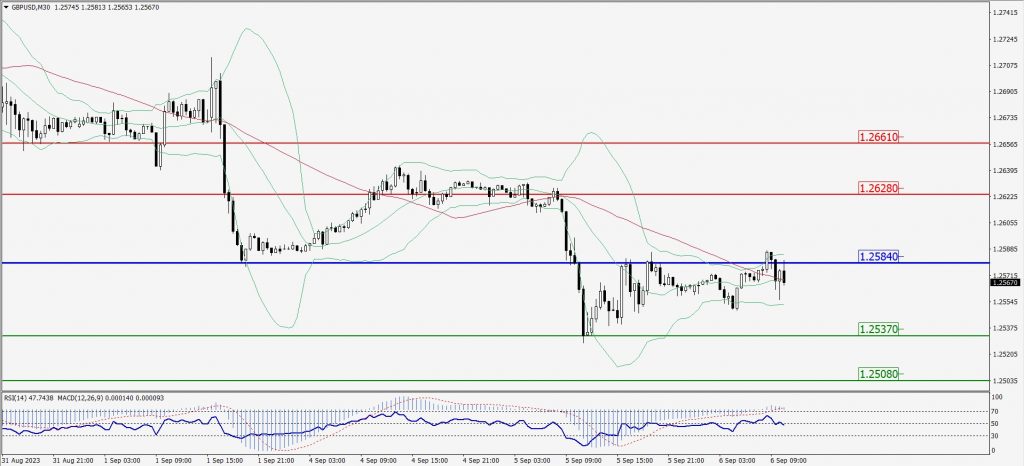
Green Lines Indicate Resistance Levels – Red Lines Indicate Support Levels
Light Blue is a Pivot Point – Black represents the price when the report was produced
USD/JPY Intraday: In a consolidation zone
Our pivot point is at 147.250
Preferable Price Action: Sell position below pivot with the target at 146.630 and 146.190 in extension.
Alternative Price Action: The upside breakout of the pivot would call for 148.030 and 148.450.
Comment: MACD is at 50 level.
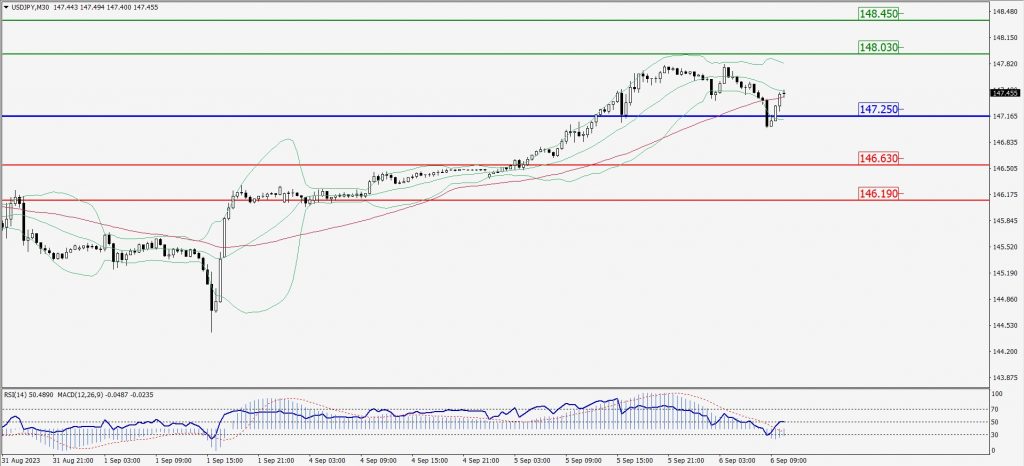
Green Lines Indicate Resistance Levels – Red Lines Indicate Support Levels
Light Blue is a Pivot Point – Black represents the price when the report was produced
AUD/USD Intraday: Support level at 0.63780
Our pivot point is at 0.63780
Preferable Price Action: Buy positions above pivot with targets at 0.64130 & 0.64400 in extension.
Alternative Price Action: Below pivot looks for a further upside with 0.64130 & 0.64400 as targets.
Comment: RSI is above 50 levels and Pairs above its 20MA & 55MA.
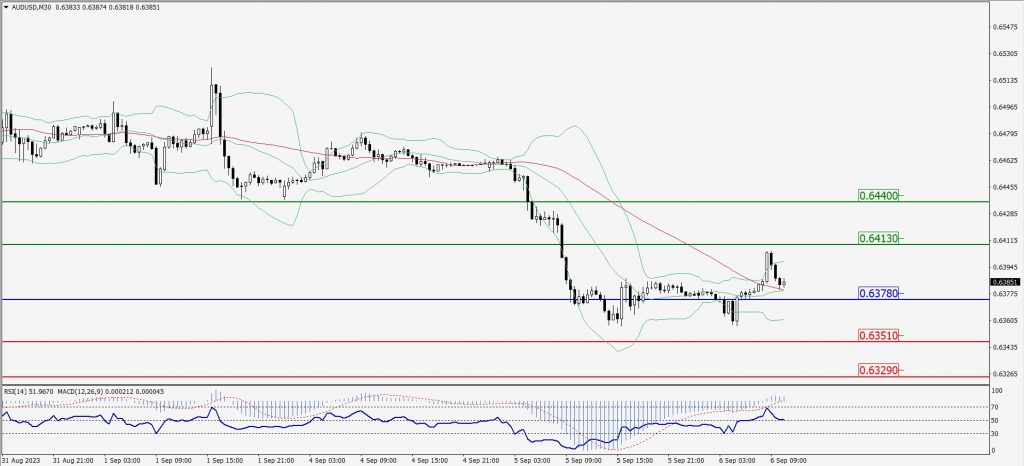
Green Lines Indicate Resistance Levels – Red Lines Indicate Support Levels
Light Blue is a Pivot Point – Black represents the price when the report was produced
CRUDEOIL Intraday: Trend on the downside
Our pivot point is at 86.44
Preferable Price Action: Below pivot sell oil with 85.15 & 84.42 as targets.
Alternative Price Action: Buy crude above pivot with targets at 87.48 and 88.23 in extension.
Comment: MACD is negative territory and Pairs below 20MA.
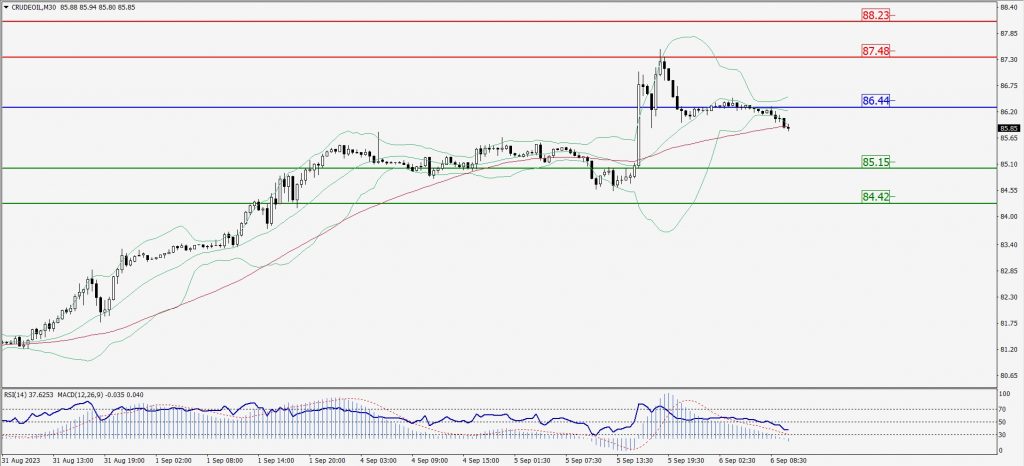
Green Lines Indicate Resistance Levels – Red Lines Indicate Support Levels
Light Blue is a Pivot Point – Black represents the price when the report was produced
XAU/USD Intraday: Trend on the downside
Our pivot point is 1929.30
Preferable Price Action: Further downside to 1919.70 and 1913.60.
Alternative Price Action: If the price gives an upside breakout of a pivot, then the price extends to 1937.40 and 1942.90.
Comment: MACD is below 50 level and Pairs below its 20MA & 55MA.
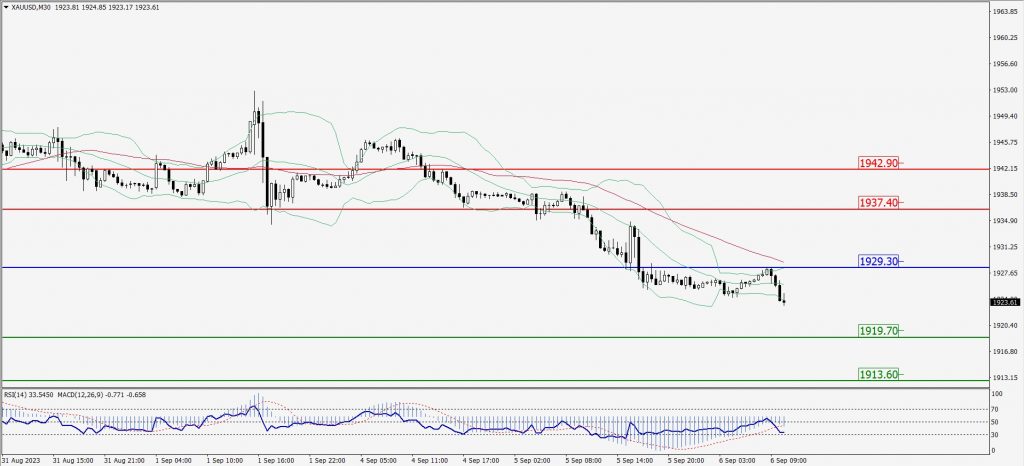
Green Lines Indicate Resistance Levels – Red Lines Indicate Support Levels
Light Blue is a Pivot Point – Black represents the price when the report was produced
Dow Jones Intraday: Trend on the downside
Our pivot point is 34,645.00
Preferable Price Action: Take sell positions below the pivot with targets at 34,518.00 & 34,435.00.
Alternative Price Action: Above 34,645.00 looks for further upside to 34,758.00 & 34,857.00.
Comment: RSI is below 50 levels and Pairs below its 20MA & 55MA.
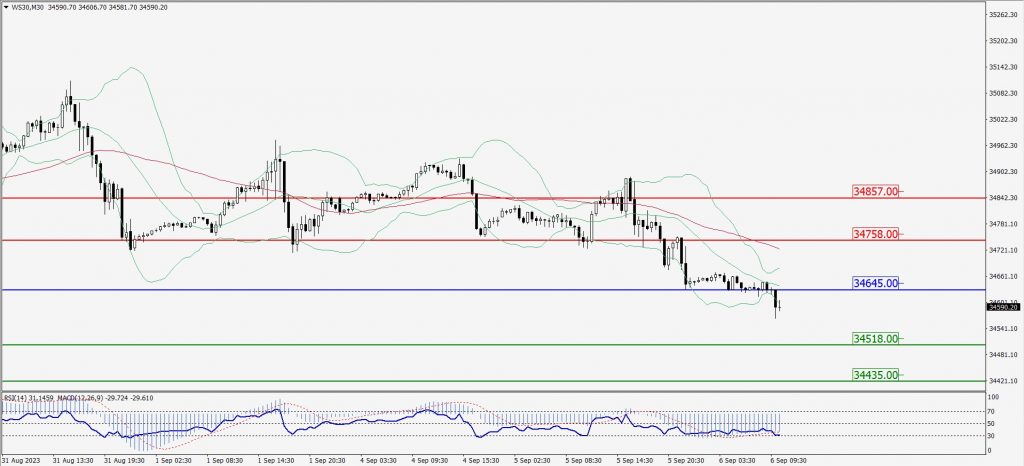
Green Lines Indicate Resistance Levels – Red Lines Indicate Support Levels
Light Blue is a Pivot Point – Black represents the price when the report was produced