Market Wrap: Stocks, Bonds, Commodities
Wall Street’s three major indices rallied to close over 2 percent on Monday as US Treasury yields tumbled on weaker-than-expected manufacturing data, increasing the appeal of stocks at the start of the year’s final quarter.
The Dow Jones Industrial Average rose 765.38 points to 29,490.89, the S&P 500 gain 92.81 points to 3,678.43 and the Nasdaq Composite add 239.82 points to 10,815.43.
MSCI’s index of Asia-Pacific stocks outside Japan is ascend 1.53% to 661.26 levels. Australian index higher 3.75% to 6,699.30. Japanese Nikkei Index ascend 2.96% to 26,992.21.
European stocks were positive on Tuesday, with the Stoxx Europe 50 Index rose 2.41% to 3,422.66, Germany’s DAX ascend 1.97% to 12,447.41, and France’s CAC up 2.48% to 5,937.81, and U.K.’s FTSE 100 surged 1.28% to 6,997.40.
Benchmark 10-year U.S. Treasury fell as demand for safe assets ascend again, today 10-year bond yields a negative 2.17% to 3.5720.
Oil prices edged higher on Tuesday as expectations that OPEC+ may agree to a large cut in crude output when it meets on Wednesday offset concerns about the global economy.
Spot Brent crude oil add 0.19% to $89.03 per barrel. US West Texas Intermediate crude is up 0.09% to $83.69 a barrel.
The yellow metal gold is advance 0.88% to 1,717.85 dollars per ounce.
Market Wrap: Forex
The U.S. dollar retreated in early European trading Tuesday with risk sentiment on the rise, while sterling retained its recent gains after the U.K. government’s policy U-turn.
Today, the U.S. dollar index measures the Greenback against a trade-weighted basket of six major currencies, which is fell 0.49% to 111.150.
The Euro US Dollar (EUR/USD) is a widely traded pair that is up 0.51% today. This left the pair trading around $0.98740.
The Japanese yen was positive against the U.S. dollar on Tuesday as the stock up. Today USD/JPY is ascend 0.11% to 144.690 level.
Another commodity-related currency positive against the U.S dollar, AUD/USD surge 0.12% to 0.65240, and NZD/USD add 0.40 to 0.57440 level.
EUR/USD Intraday: Trend on the upside
Our pivot point is at 0.98520
Preferable Price Action: Take buy positions above pivot level with targets at 0.99400 & 1.00020 in extension.
Alternative Price Action: Below pivot looks for a further downside to 0.97760 & 0.97130.
Comment: RSI above 50 levels and Pairs above its 20MA & 55MA.
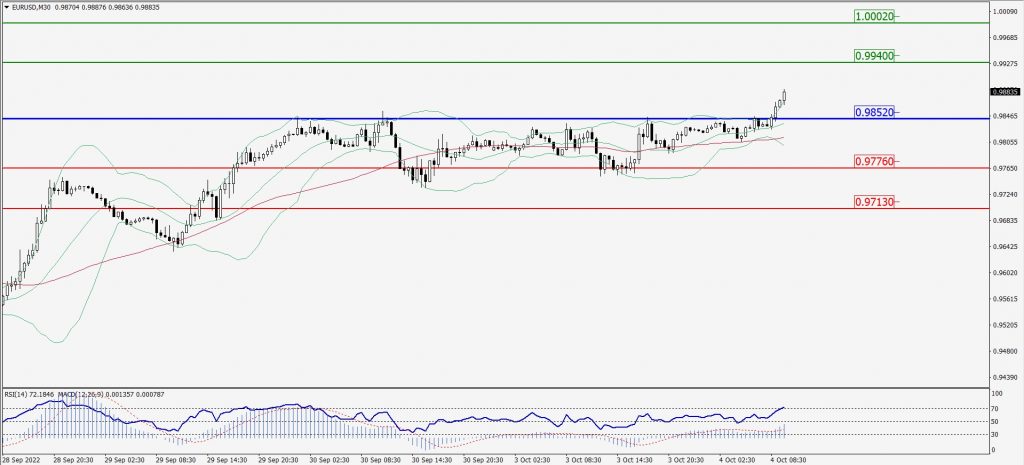
Green Lines Indicate Resistance Levels – Red Lines Indicate Support Levels
Light Blue is a Pivot Point – Black represents the price when the report was produced
GBP/USD Intraday: Support level at 1.13140
Our pivot point is at 1.13140
Preferable Price Action: Buy positions above pivot with targets at 1.15120 & 1.16370 in extension.
Alternative Price Action: The price below pivot would call for further downside to 1.11660 & 1.10390.
Comment: RSI above 50 levels and Pairs above its 20MA & 55MA.
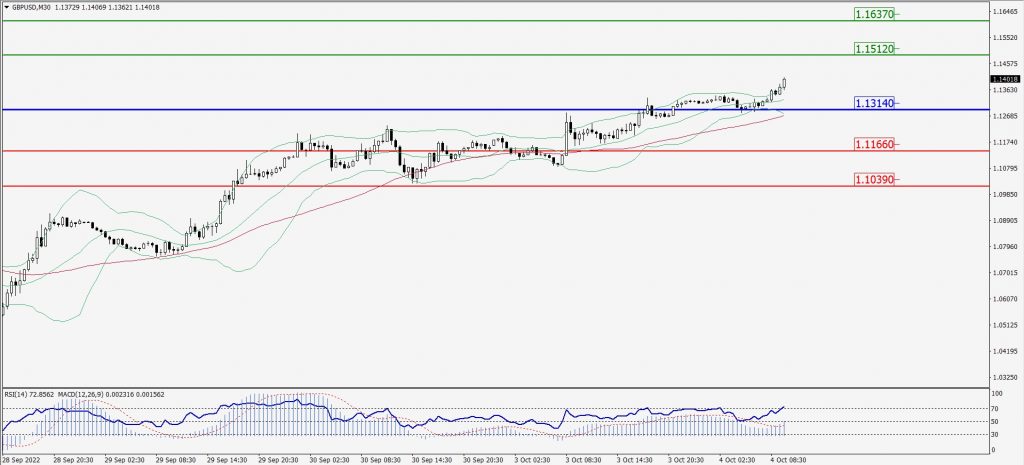
Green Lines Indicate Resistance Levels – Red Lines Indicate Support Levels
Light Blue is a Pivot Point – Black represents the price when the report was produced
USD/JPY Intraday: Trend on the downside
Our pivot point is at 144.720
Preferable Price Action: Sell position below pivot with the target at 144.340 and 144.100 in extension.
Alternative Price Action: The upside breakout of the pivot would call for 145.040 and 145.270.
Comment: MACD is negative territory and Pairs below its 20MA & 55MA.
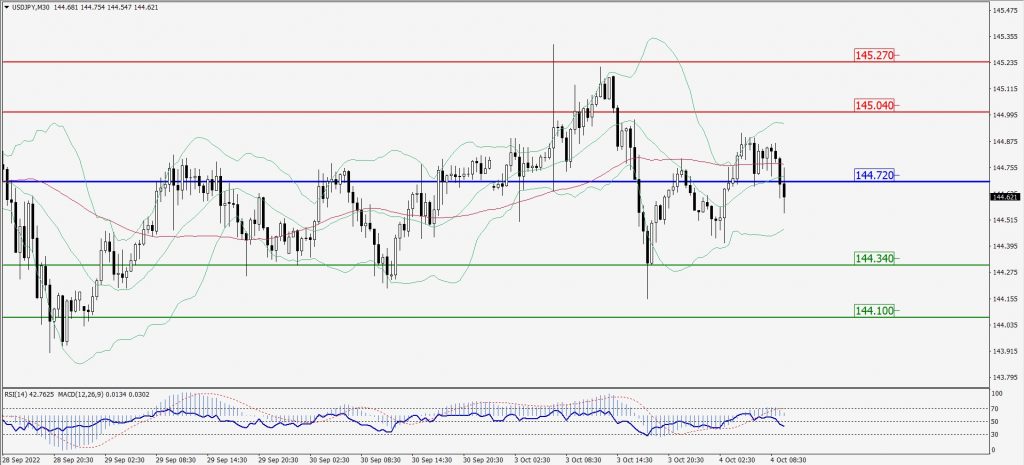
Green Lines Indicate Resistance Levels – Red Lines Indicate Support Levels
Light Blue is a Pivot Point – Black represents the price when the report was produced
AUD/USD Intraday: Trend on the upside
Our pivot point is at 0.65240
Preferable Price Action: Buy Positions above pivot with targets at 0.65920 & 0.66360 in extension.
Alternative Price Action: Below pivot looks for a further downside with 0.64680 & 0.64210 as targets.
Comment: RSI above 50 levels and Pairs above its 20MA & 55MA.
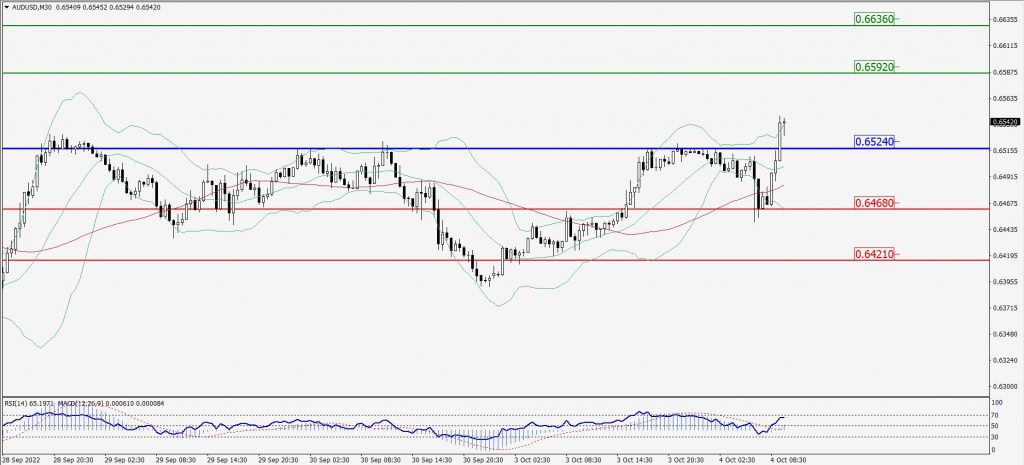
Green Lines Indicate Resistance Levels – Red Lines Indicate Support Levels
Light Blue is a Pivot Point – Black represents the price when the report was produced
CRUDEOIL Intraday: Major trend on the upside
Our pivot point is at 83.16
Preferable Price Action: Above pivots buy oil with 85.10 & 86.69 as targets.
Alternative Price Action: Sell crude below pivot with targets at 81.18 and 79.83 in extension.
Comment: MACD is in the positive territory and Pairs above its 20MA & 55MA.
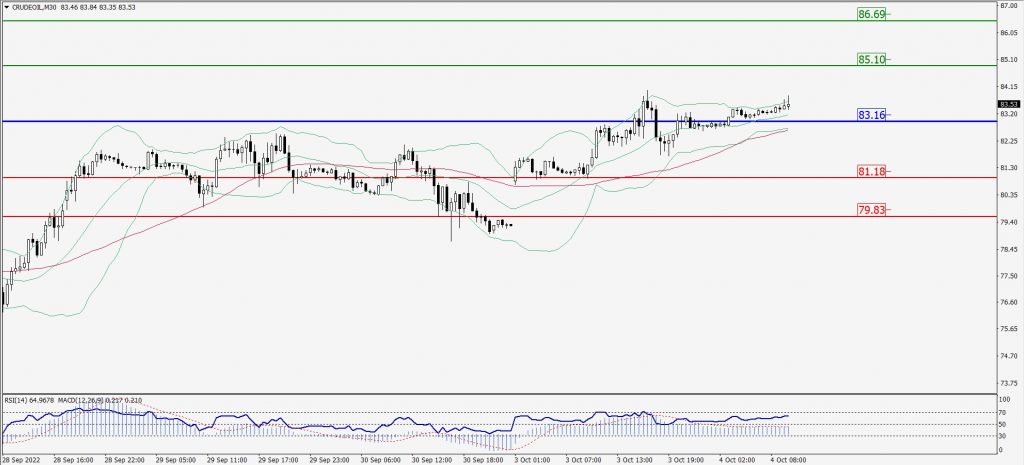
Green Lines Indicate Resistance Levels – Red Lines Indicate Support Levels
Light Blue is a Pivot Point – Black represents the price when the report was produced
XAU/USD Intraday: Support level at 1702.60
Our pivot point is 1702.60
Preferable Price Action: Further upside to 1725.00 and 1741.00
Alternative Price Action: If the price gives a downside breakout of a pivot, then the price extends to 1680.00 and 1663.40.
Comment: MACD is positive territory and Pairs above its 20MA & 55MA.
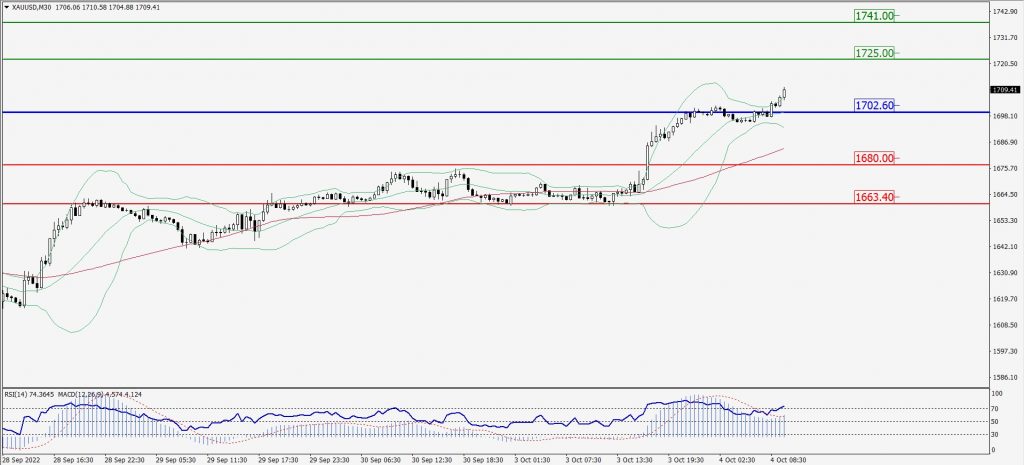
Green Lines Indicate Resistance Levels – Red Lines Indicate Support Levels
Light Blue is a Pivot Point – Black represents the price when the report was produced
Dow Jones Intraday: Trend on the upside
Our pivot point is 29,69800
Preferable Price Action: Take buy positions above pivot with targets at 30,033.00 & 30,248.00.
Alternative Price Action: Below 29,698.00 looks for further downside to 29,438.00 & 29,233.00.
Comment: RSI above 50 levels and Pairs above its 20MA & 55MA.
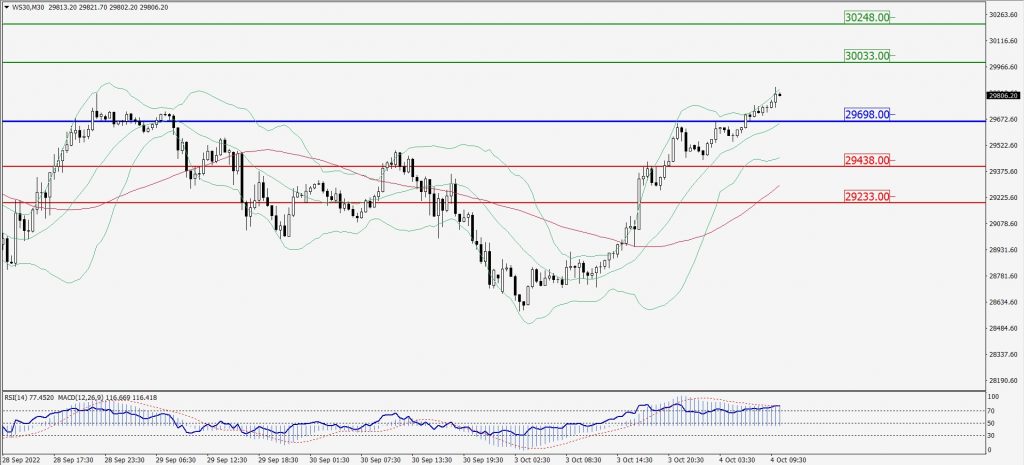
Green Lines Indicate Resistance Levels – Red Lines Indicate Support Levels
Light Blue is a Pivot Point – Black represents the price when the report was produced