Market Wrap: Stocks, Bonds, Commodities
A surging US currency, and weakening counterparts in Asia, aren’t signs that the world is entering a new FX war.
The Dow Jones Industrial Average fell 115.29 points to 38,571.03, the S&P 500 gain 0.11% to 5,283.40 and the Nasdaq Composite ascend 93.62 points to 16,828.63.
MSCI’s index of Asia-Pacific stocks outside Japan is below 1.49% to 675.37 levels. The Australian index was lower by 0.31% to 7,737.10. Japanese Nikkei Index decrease 0.35% today.
European stocks were negative on Tuesday, with the Stoxx Europe 50 Index decrease 1.07% to 4,949.95, Germany’s DAX descend 1.07% to 18,411.65, and France’s CAC lower 0.84% to 7,931.04 and U.K.’s FTSE 100 loss 0.68% to 8,206.19.
Benchmark 10-year U.S. Treasury rose as demand for safe assets slipped again, today 10-year bond yields decrease 0.37% to 4.3830.
It signed a sales and purchase agreement with Indian Oil Corporation to deliver up to 800,000 metric tons per year of LNG to India for ten years from 2026, it said in a statement.
Spot Brent crude oil descend 1.71% to $77.02 per barrel. US West Texas Intermediate crude is down 1.95% to $72.77 a barrel.
The yellow metal gold is decrease 0.69% to 2,353.00 dollars per ounce.
Market Wrap: Forex
There’s just no getting past the supremacy of the dollar, much as skeptics of American influence wish for it or lonely yen bulls cry for relief. The greenback has been frequently tipped to retreat, only for it to blow away everything in front of it.
Today, the U.S. dollar index measures the Greenback against a trade-weighted basket of six major currencies, which ascend 0.08% to 104.160.
The Euro US Dollar (EUR/USD) is a widely traded pair that is decrease 0.20% today. This left the pair trading around $1.0880.
The Japanese yen was negative against the U.S. dollar on Tuesday. Today USD/JPY is trades pair that decreases 0.54% to the 155.260 level.
Another commodity-related currency negative against the U.S dollar, AUD/USD drop 0.61% to 0.66470, and NZD/USD descend 0.26% to 0.61680 level.
EUR/USD Intraday: Trend on the downside
Our pivot point is at 1.09060.
Preferable Price Action: Take sell positions below pivot level with targets at 1.08900 & 1.08770 in extension.
Alternative Price Action: Buy pivot looks for a further upside to 1.09220& 1.09350.
Comment: RSI is below 50 levels and pairs are below its 20MA .
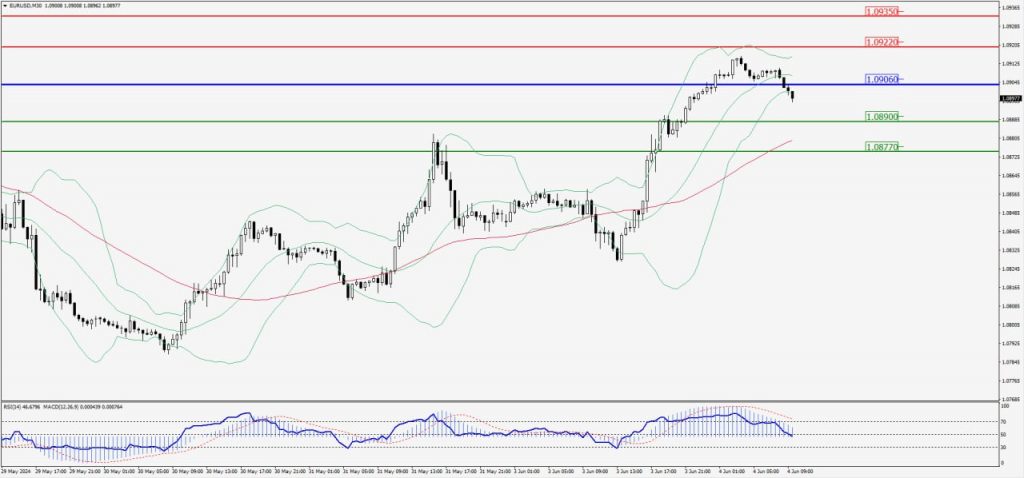
Green Lines Indicate Resistance Levels – Red Lines Indicate Support Levels
Light Blue is a Pivot Point – Black represents the price when the report was produced
GBP/USD Intraday: Trend on the downside
Our pivot point is at 1.27960
Preferable Price Action: Sell positions below pivot with targets at 1.27770 & 1.27560 in extension.
Alternative Price Action: The price above pivot would call for further upside to 1.28140& 1.28310.
Comment: RSI is below 50 levels and pairs are below its 20MA .
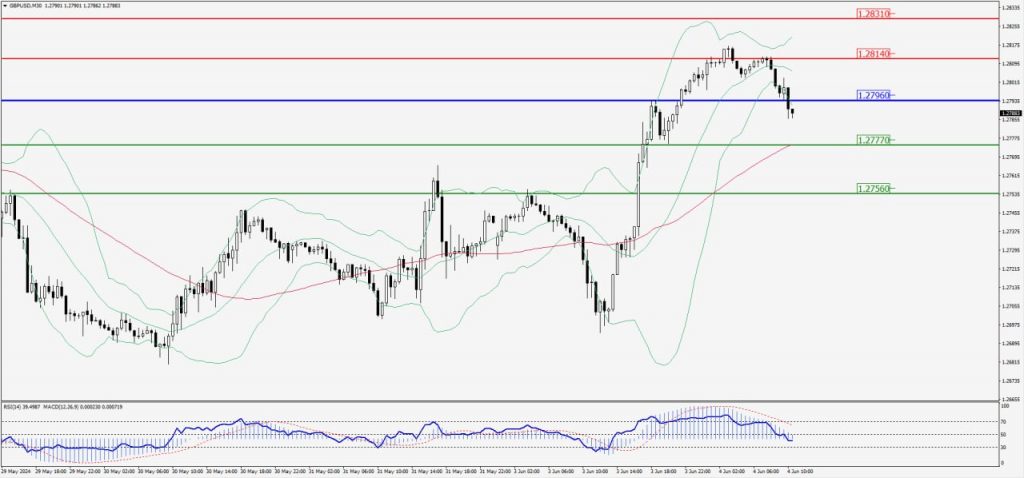
Green Lines Indicate Resistance Levels – Red Lines Indicate Support Levels
Light Blue is a Pivot Point – Black represents the price when the report was produced
USD/JPY Intraday: Major trend on the downside
Our pivot point is at 155.850
Preferable Price Action: Sell position below pivot with the target at 155.480 and 155.160 in extension.
Alternative Price Action: The upside breakout of the pivot would call for 156.220 and 156.510.
Comment: MACD is below 50 levels and pairs below 20MA & 55MA.
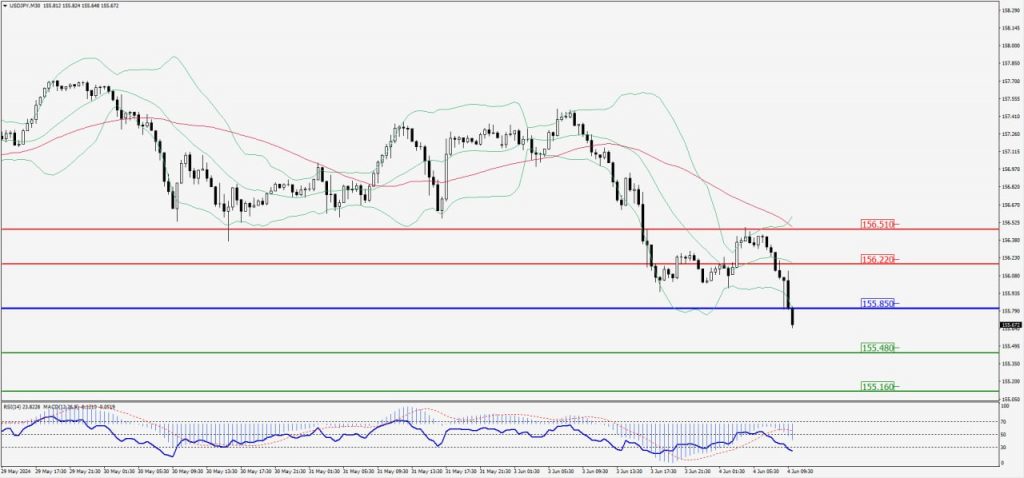
Green Lines Indicate Resistance Levels – Red Lines Indicate Support Levels
Light Blue is a Pivot Point – Black represents the price when the report was produced
AUD/USD Intraday: Trend on the downside
Our pivot point is at 0.66710
Preferable Price Action: Sell positions below pivot with targets at 0.66570 & 0.66460 in extension.
Alternative Price Action: Above a further upside with 0.66840 & 0.66950 as targets.
Comment: RSI is below 50 levels and pairs below its 20MA.

Green Lines Indicate Resistance Levels – Red Lines Indicate Support Levels
Light Blue is a Pivot Point – Black represents the price when the report was produced
CRUDEOIL Intraday: Major trend on the downside
Our pivot point is at 73.49
Preferable Price Action: Below pivot sell oil with 72.32 & 71.34 as targets.
Alternative Price Action: Buy crude above pivot with targets at 74.76 and 75.86 in extension.
Comment: MACD is negative territory and pairs below its 20MA & 55MA.
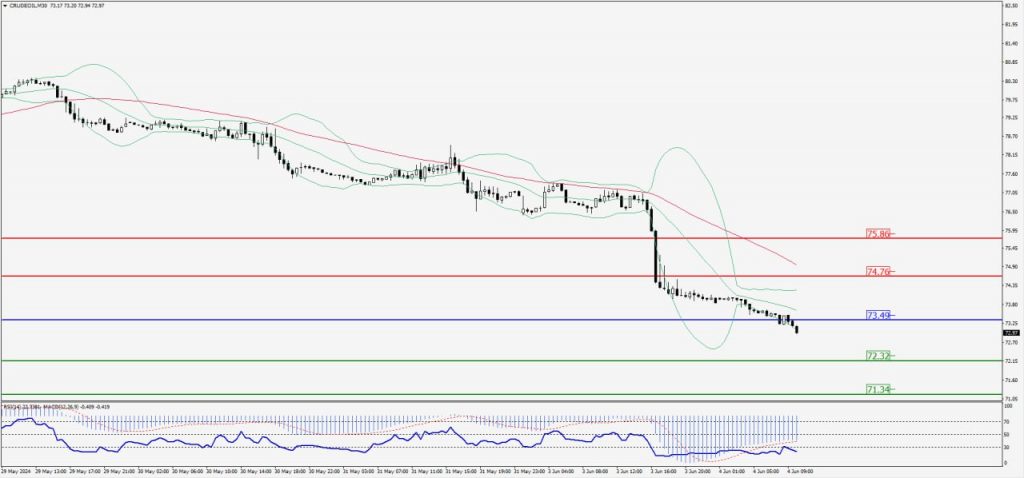
Green Lines Indicate Resistance Levels – Red Lines Indicate Support Levels
Light Blue is a Pivot Point – Black represents the price when the report was produced
XAU/USD Intraday: Trend on the downside
Our pivot point is 2345.50
Preferable Price Action: Further downside to 2339.90 and 2335.40.
Alternative Price Action: If the price gives an upside breakout of a pivot, then the price extends to 2351.60 and 2356.20.
Comment: MACD is below 50 levels and pairs below its 20MA.
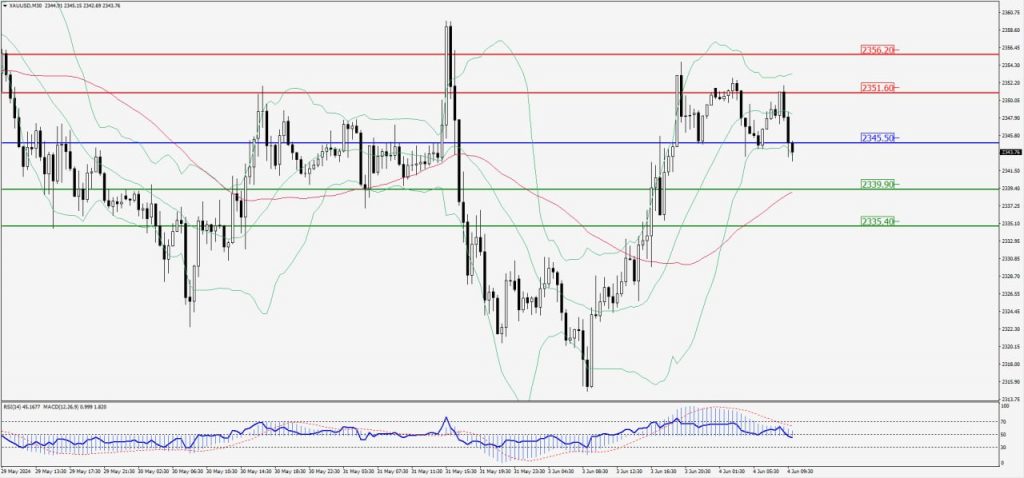
Green Lines Indicate Resistance Levels – Red Lines Indicate Support Levels
Light Blue is a Pivot Point – Black represents the price when the report was produced
Dow Jones Intraday: Trend on the downside
Our pivot point is 38,518.20
Preferable Price Action: Take sell positions below the pivot with targets at 38,417.40 & 38,336.60.
Alternative Price Action: Below 38,518.20 looks for further upside to 38,620.10 & 38,696.20.
Comment: RSI is below 50 levels and pairs below its 20MA & 55MA.
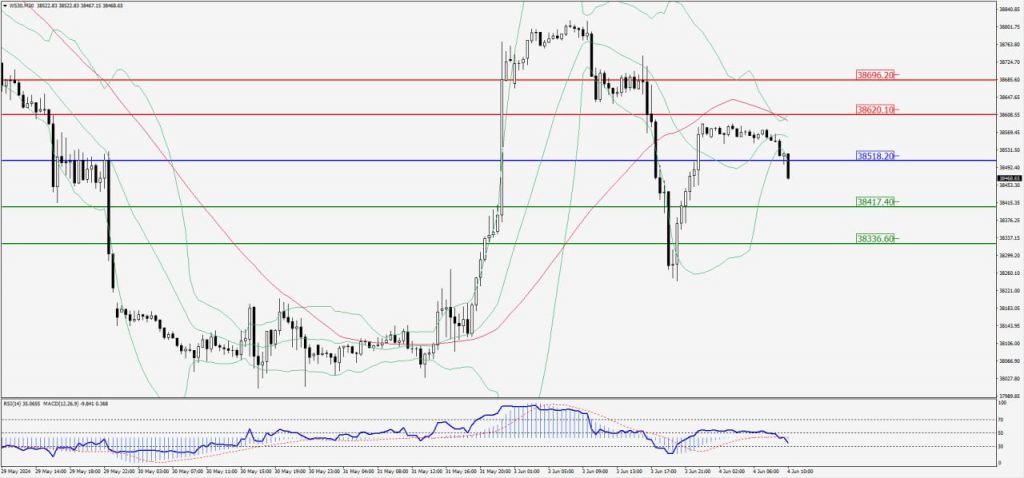
Green Lines Indicate Resistance Levels – Red Lines Indicate Support Levels
Light Blue is a Pivot Point – Black represents the price when the report was produced