Market Wrap: Stocks, Bonds, Commodities
Wall Street indexes had rallied, as had bonds to a lesser extent, while the dollar gave up gains overnight when the Fed’s preferred wages gauge, the U.S. employment cost index, showed a 1% rise last quarter, its smallest increase in a year.
The Dow Jones Industrial Average rose 368.95 points to 34,086.04, the S&P 500 gain 1.46% to 4,076.60 and the Nasdaq Composite add 190.74 points to 11,584.55.
MSCI’s index of Asia-Pacific stocks outside Japan is ascend 1.20% to 677.93 levels. The Australian index was higher by 0.33% to 7,501.70. Japanese Nikkei Index rose 0.07% today.
European stocks were mix on Wednesday, with the Stoxx Europe 50 Index rose 0.12% to 4,163.45, Germany’s DAX gain 0.01% to 15,128.27, and France’s CAC advance 0.01% to 7,082.42, and U.K.’s FTSE 100 subtract 0.17% to 7,771.70.
Benchmark 10-year U.S. Treasury fell as demand for safe assets ascend again, today 10-year bond yields are negative 1.15% to 3.4880.
Oil prices rose on Wednesday as signs of slowing inflation in the United States eased fears that the world’s largest oil user may face a recession because of further interest rate hikes and a weaker dollar supported some buying interest.
Spot Brent crude oil rose 0.05% to $85.50 per barrel. US West Texas Intermediate crude is up 0.20% to $79.03 a barrel.
The yellow metal gold is decline 0.24% to 1,940.65 dollars per ounce.
Market Wrap: Forex
The dollar was broadly flat against major currencies on Wednesday ahead of an eagerly-awaited Federal Reserve policy decision that investors hope will signal the end of the U.S. central bank’s interest rate hiking cycle.
Today, the U.S. dollar index measures the Greenback against a trade-weighted basket of six major currencies, which slipped 0.02% to 101.892.
The Euro US Dollar (EUR/USD) is a widely traded pair that is up 0.11% today. This left the pair trading around $1.08740.
The Japanese yen was positive against the U.S. dollar on Wednesday. Today USD/JPY is ascend 0.23% to the 130.390 level.
Another commodity-related currency positive against the U.S dollar, AUD/USD rose 0.21% to 0.70690, and NZD/USD gain 0.06% to 0.64430 level.
EUR/USD Intraday: Trend on the upside
Our pivot point is at 1.08690
Preferable Price Action: Take long positions above pivot level with targets at 1.08900 & 1.09040 in extension.
Alternative Price Action: Below pivot looks for a further downside to 1.08470 & 1.08330.
Comment: RSI is above 50 levels and Pairs above its 20MA & 55MA.
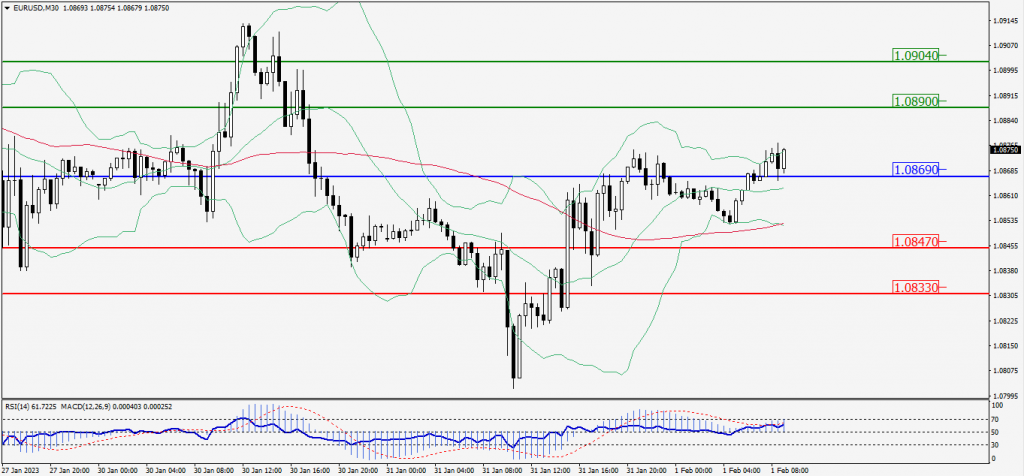
Green Lines Indicate Resistance Levels – Red Lines Indicate Support Levels
Light Blue is a Pivot Point – Black represents the price when the report was produced
GBP/USD Intraday: In a consolidation zone
Our pivot point is at 1.23120
Preferable Price Action: Buy positions above pivot with targets at 1.23450 & 1.23660 in extension.
Alternative Price Action: The price below pivot would call for further downside to 1.22810 & 1.22620.
Comment: RSI is at 50 levels and Pairs above 20MA.
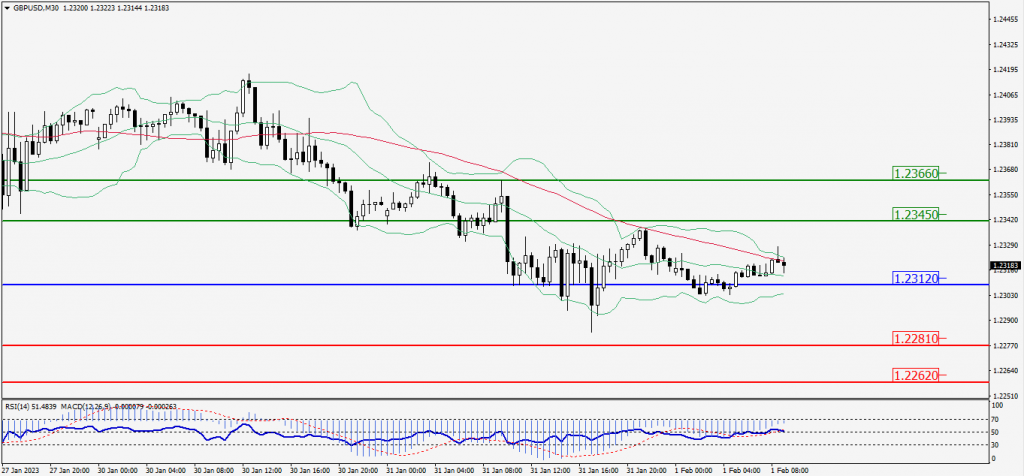
Green Lines Indicate Resistance Levels – Red Lines Indicate Support Levels
Light Blue is a Pivot Point – Black represents the price when the report was produced
USD/JPY Intraday: Support level at 130.330
Our pivot point is at 130.230
Preferable Price Action: Buy position above pivot with the target at 130.520 and 130.690 in extension.
Alternative Price Action: The downside breakout of the pivot would call for 129.940 and 129.780.
Comment: MACD is above 50 level and Pairs above its 20MA & 55MA.
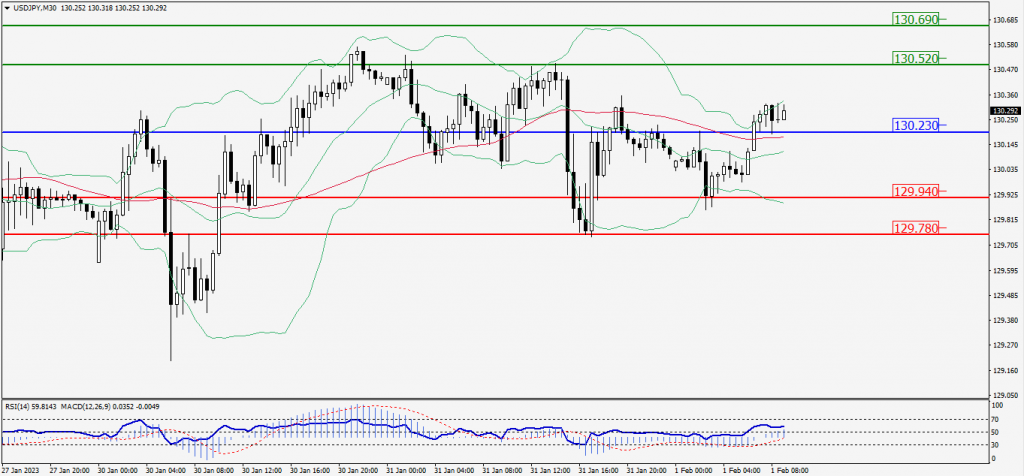
Green Lines Indicate Resistance Levels – Red Lines Indicate Support Levels
Light Blue is a Pivot Point – Black represents the price when the report was produced
AUD/USD Intraday: Major trend on the upside
Our pivot point is at 0.70670
Preferable Price Action: Buy positions above pivot with targets at 0.70920 & 0.71080 in extension.
Alternative Price Action: Below pivot looks for a further downside with 0.70420 & 0.70250 as targets.
Comment: RSI is above 50 levels and pairs above its 20MA & 55MA.
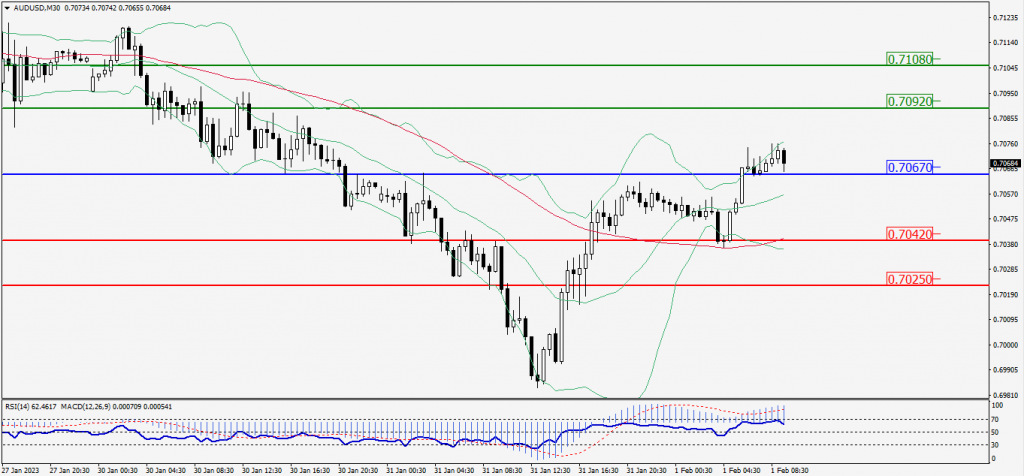
Green Lines Indicate Resistance Levels – Red Lines Indicate Support Levels
Light Blue is a Pivot Point – Black represents the price when the report was produced
CRUDEOIL Intraday: Trend on the upside
Our pivot point is at 79.06
Preferable Price Action: Above pivot buy oil with 80.11 & 80.80 as targets.
Alternative Price Action: Sell crude below pivot with targets at 77.97 and 77.30 in extension.
Comment: MACD is positive territory and Pairs above 55MA.
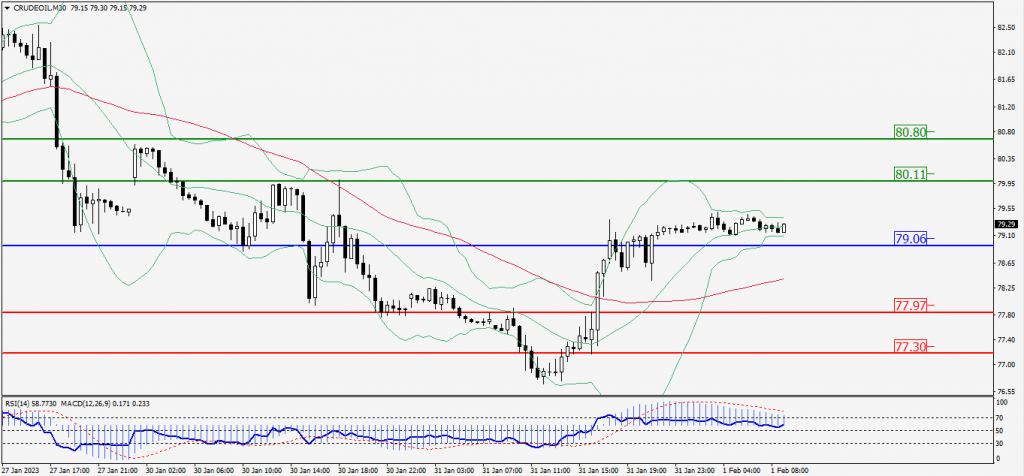
Green Lines Indicate Resistance Levels – Red Lines Indicate Support Levels
Light Blue is a Pivot Point – Black represents the price when the report was produced
XAU/USD Intraday: Support level at 1925.30
Our pivot point is 1925.30
Preferable Price Action: Further upside to 1934.40 and 1939.30
Alternative Price Action: If the price gives a downside breakout of a pivot, then the price extends to 1916.70 and 1911.50.
Comment: MACD is above 50 level and Pairs above 55MA.
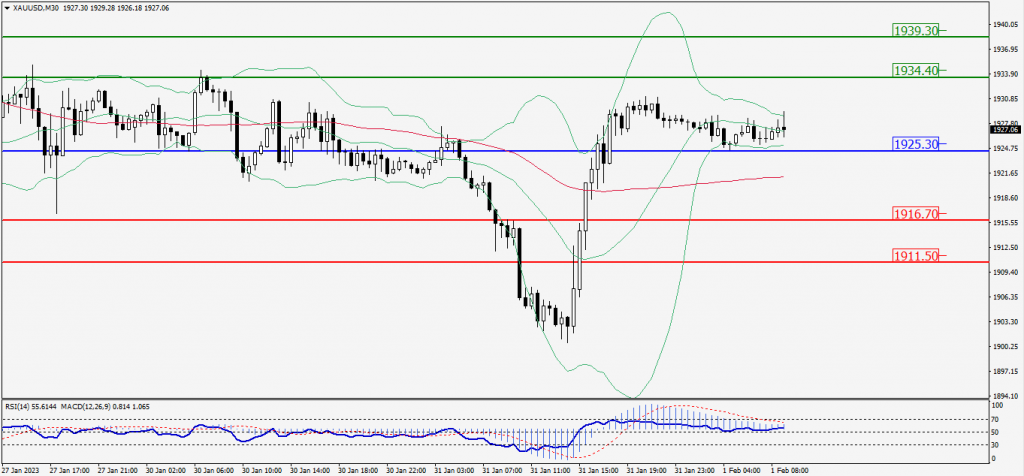
Green Lines Indicate Resistance Levels – Red Lines Indicate Support Levels
Light Blue is a Pivot Point – Black represents the price when the report was produced
Dow Jones Intraday: Trend on the upside
Our pivot point is 33,996.00
Preferable Price Action: Take buy positions above the pivot with targets at 34,106.00 & 34,179.00.
Alternative Price Action: Below 33,996.00 looks for further downside to 33,882.00 & 33,809.00.
Comment: RSI is above 50 levels and Pairs above its 20MA & 55MA.
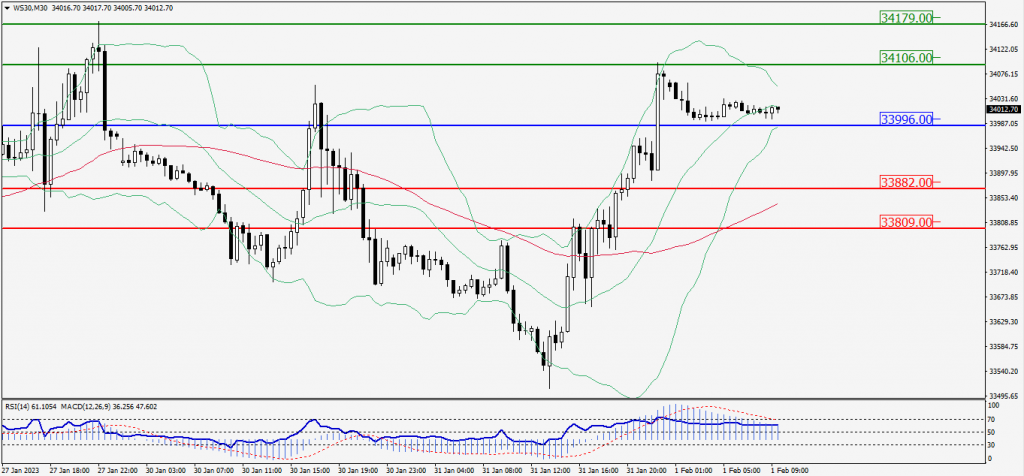
Green Lines Indicate Resistance Levels – Red Lines Indicate Support Levels
Light Blue is a Pivot Point – Black represents the price when the report was produced