Market Wrap: Stocks, Bonds, Commodities
A gauge of global stocks retreated on Monday after six sessions of gains while US Treasury yields rose ahead of central bank policy announcements and data that may shed light on whether progress has been made in bringing down inflation.
The Dow Jones Industrial Average fell 260.99 points to 33,717.09, the S&P 500 lose 1.30% to 4,017.77 and the Nasdaq Composite subtract 227.90 points to 11,393.81.
MSCI’s index of Asia-Pacific stocks outside Japan is drop 1.61% to 668.52 levels. The Australian index was lower by 0.07% to 7,476.70. Japanese Nikkei Index lose 0.39% today.
European stocks were mix on Tuesday, with the Stoxx Europe 50 Index fell 0.46% to 4,158.63, Germany’s DAX lose 0.16% to 15,126.08, and France’s CAC decline 0.21% to 7,082.01, and U.K.’s FTSE 100 add 0.25% to 7,784.87.
Benchmark 10-year U.S. Treasury fell as demand for safe assets ascend again, today 10-year bond yields are negative 0.36% to 3.5380.
Oil prices dipped 2 percent on Monday, extending losses as looming increases to interest rates by major central banks weighed on demand and Russian exports remained strong.
Spot Brent crude oil fell 0.36% to $84.20 per barrel. US West Texas Intermediate crude is down 0.36% to $77.54 a barrel.
The yellow metal gold is decline 0.43% to 1,914.70 dollars per ounce.
Market Wrap: Forex
Most Asian stock markets sank on Tuesday as fears of hawkish signals from a Federal Reserve meeting this week largely outweighed data showing that Chinese business activity rebounded in January.
Today, the U.S. dollar index measures the Greenback against a trade-weighted basket of six major currencies, which surge 0.02% to 102.090.
The Euro US Dollar (EUR/USD) is a widely traded pair that is up 0.02% today. This left the pair trading around $1.08460.
The Japanese yen was negative against the U.S. dollar on Tuesday. Today USD/JPY is drop 0.18% to the 130.210 level.
Another commodity-related currency negative against the U.S dollar, AUD/USD fell 0.40% to 0.70300, and NZD/USD lose 0.23% to 0.64520 level.
EUR/USD Intraday: Trend on the downside
Our pivot point is at 1.08480
Preferable Price Action: Take short positions below pivot level with targets at 1.08160 & 1.08000 in extension.
Alternative Price Action: Above pivot looks for a further upside to 1.08780 & 1.08950.
Comment: RSI is below 50 levels and Pairs below its 20MA & 55MA.
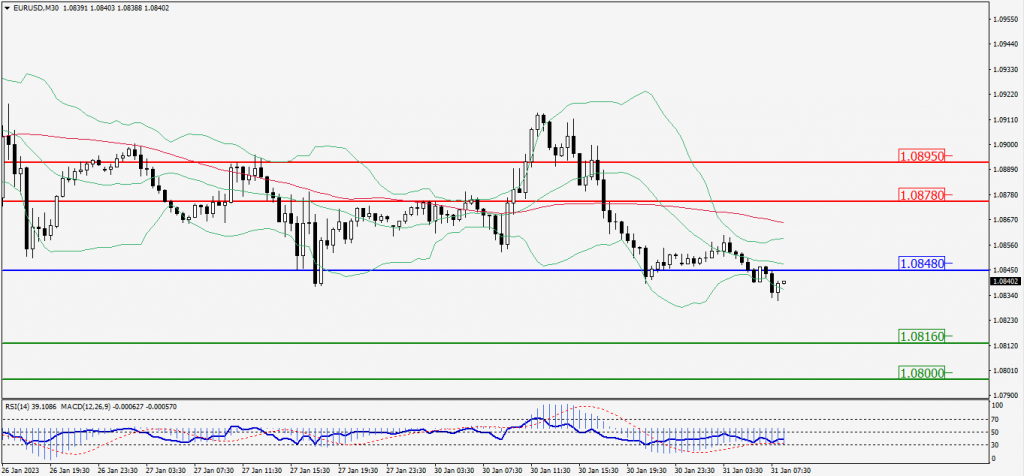
Green Lines Indicate Resistance Levels – Red Lines Indicate Support Levels
Light Blue is a Pivot Point – Black represents the price when the report was produced
GBP/USD Intraday: Trend on the downside
Our pivot point is at 1.23510
Preferable Price Action: Sell positions below pivot with targets at 1.23240 & 1.23070 in extension.
Alternative Price Action: The price above pivot would call for further upside to 1.23790 & 1.23950.
Comment: RSI is below 50 levels and Pairs below its 20MA & 55MA.
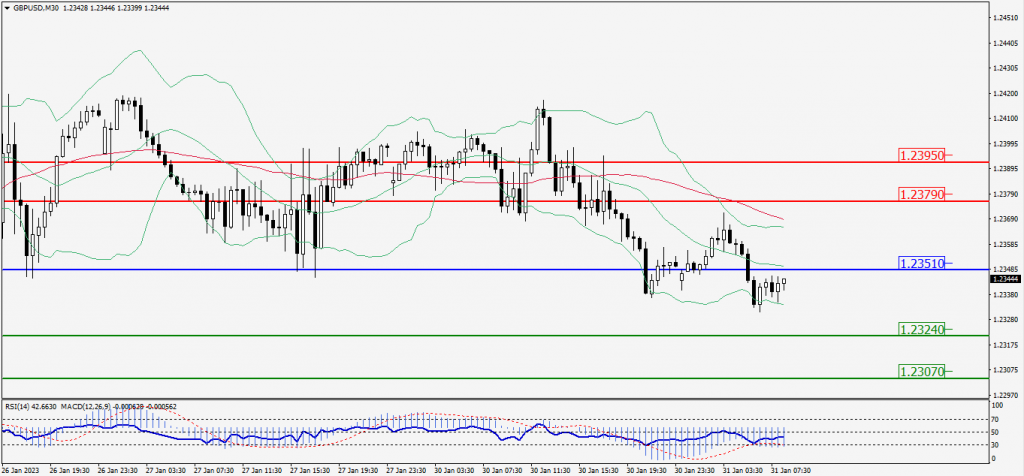
Green Lines Indicate Resistance Levels – Red Lines Indicate Support Levels
Light Blue is a Pivot Point – Black represents the price when the report was produced
USD/JPY Intraday: Resistance level at 130.330
Our pivot point is at 130.330
Preferable Price Action: Sell position below pivot with the target at 130.000 and 129.810 in extension.
Alternative Price Action: The upside breakout of the pivot would call for 130.660 and 130.860.
Comment: MACD is below 50 level and Pairs below 20MA.
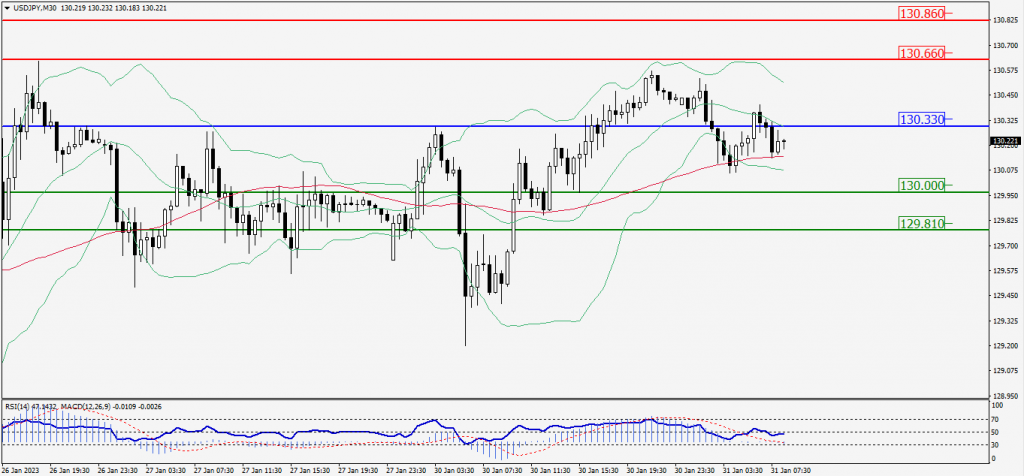
Green Lines Indicate Resistance Levels – Red Lines Indicate Support Levels
Light Blue is a Pivot Point – Black represents the price when the report was produced
AUD/USD Intraday: Trend on the downside
Our pivot point is at 0.70460
Preferable Price Action: Sell positions below pivot with targets at 0.70150 & 0.69970 in extension.
Alternative Price Action: Above pivot looks for a further upside with 0.70760 & 0.70940 as targets.
Comment: RSI is below 50 levels and pairs below its 20MA & 55MA.
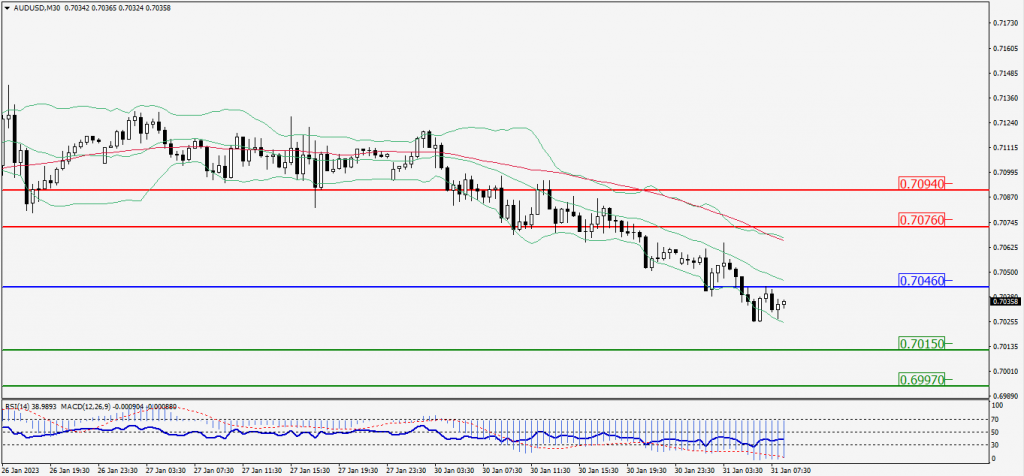
Green Lines Indicate Resistance Levels – Red Lines Indicate Support Levels
Light Blue is a Pivot Point – Black represents the price when the report was produced
CRUDEOIL Intraday: Major trend on the downside
Our pivot point is at 78.22
Preferable Price Action: Below pivot sell oil with 76.62 & 75.62 as targets.
Alternative Price Action: Buy crude above pivot with targets at 79.78 and 80.73 in extension.
Comment: MACD is negative territory and Pairs below its 20MA & 55MA.
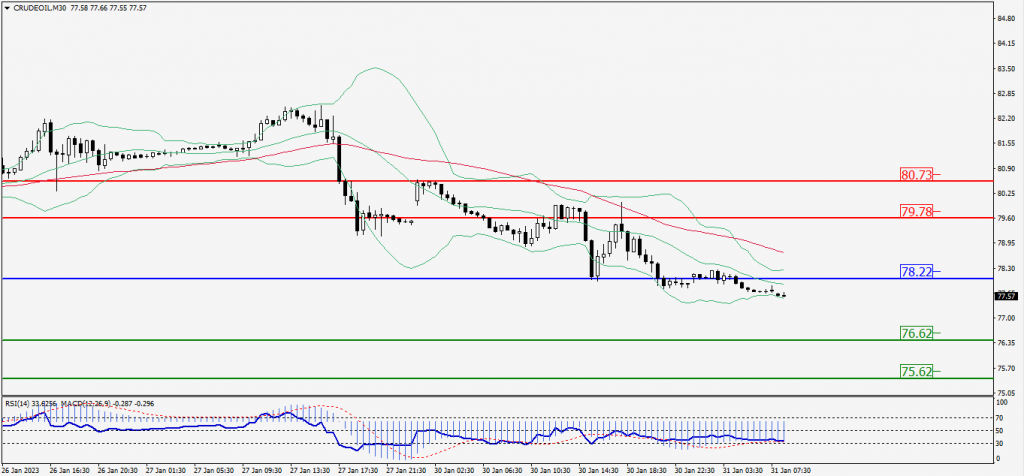
Green Lines Indicate Resistance Levels – Red Lines Indicate Support Levels
Light Blue is a Pivot Point – Black represents the price when the report was produced
XAU/USD Intraday: Major trend on the downside
Our pivot point is 1918.10
Preferable Price Action: Further downside to 1906.90 and 1900.70
Alternative Price Action: If the price gives an upside breakout of a pivot, then the price extends to 1929.20 and 1935.70.
Comment: MACD is below 50 level and Pairs below its 20MA & 55MA.
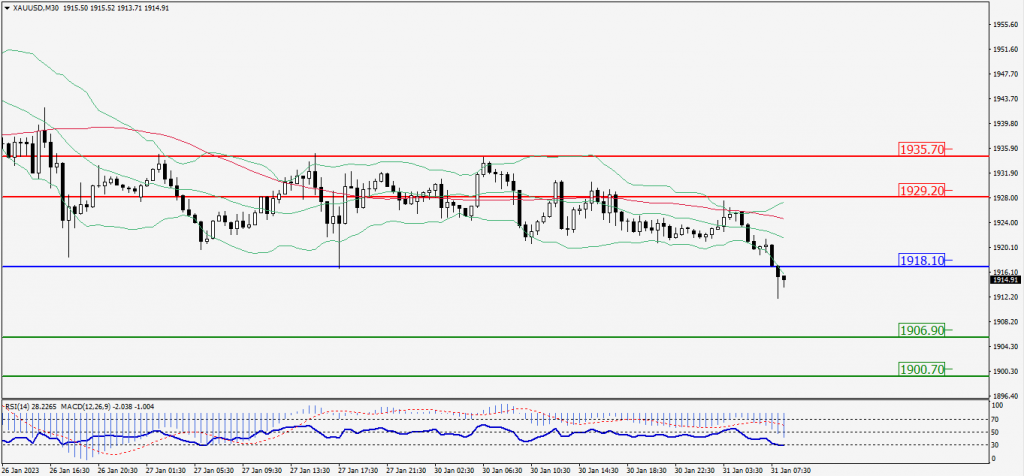
Green Lines Indicate Resistance Levels – Red Lines Indicate Support Levels
Light Blue is a Pivot Point – Black represents the price when the report was produced
Dow Jones Intraday: Trend on the downside
Our pivot point is 33,749.00
Preferable Price Action: Take sell positions down the pivot with targets at 33,612.00 & 33,533.00.
Alternative Price Action: Above 33,749.00 looks for further upside to 33,885.00 & 33,966.00.
Comment: RSI is below 50 levels and Pairs below its 20MA & 55MA.
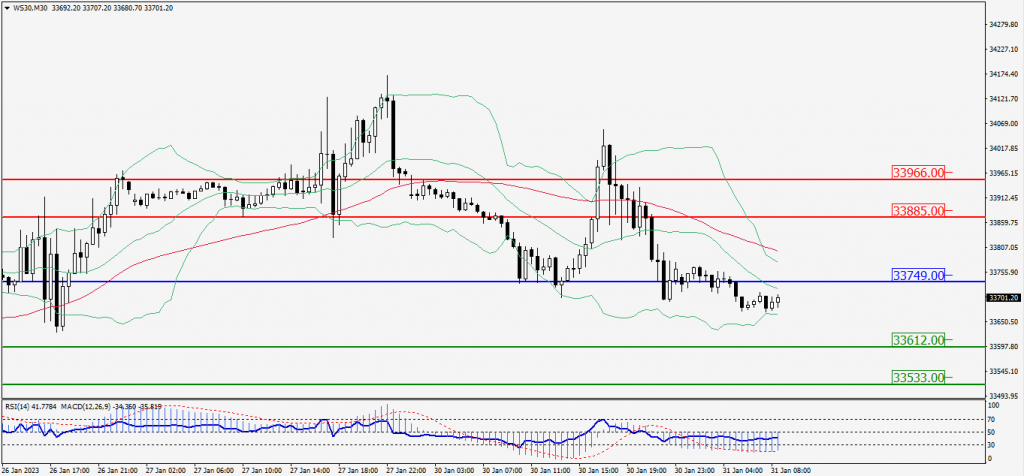
Green Lines Indicate Resistance Levels – Red Lines Indicate Support Levels
Light Blue is a Pivot Point – Black represents the price when the report was produced