Market Wrap: Stocks, Bonds, Commodities
The S&P 500 and the Nasdaq closed sharply higher on Wednesday after Federal Reserve chair Jerome Powell acknowledged that inflation was starting to ease, in remarks he made following a quarter-point rate hike by the U.S. central bank.
The Dow Jones Industrial Average rose 6.92 points to 34,092.96, the S&P 500 gain 1.05% to 4,119.21 and the Nasdaq Composite add 231.77 points to 11,816.32.
MSCI’s index of Asia-Pacific stocks outside Japan is ascend 0.29% to 680.15 levels. The Australian index was higher by 9.90% to 7,511.60. Japanese Nikkei Index rose 0.20% today.
European stocks were mix on Thursday, with the Stoxx Europe 50 Index rose 0.19% to 4,171.44, Germany’s DAX gain 0.35% to 15,180.74, and France’s CAC decline 0.07% to 7,077.11, and U.K.’s FTSE 100 subtract 0.14% to 7,761.11.
Benchmark 10-year U.S. Treasury fell as demand for safe assets ascend again, today 10-year bond yields are negative 0.26% to 3.3890.
Oil prices rose in early Asian trade on Thursday after the U.S. Federal Reserve raised interest rates by 25 basis points, sending the dollar lower.
Spot Brent crude oil rose 0.63% to $83.36 per barrel. US West Texas Intermediate crude is up 0.69% to $76.94 a barrel.
The yellow metal gold is advance 1.55% to 1,972.85 dollars per ounce.
Market Wrap: Forex
The dollar slid on Thursday after the U.S. Federal Reserve said it had turned a corner in the fight against inflation, giving markets a boost in confidence that the end of the central bank’s rate-hike campaign was near.
Today, the U.S. dollar index measures the Greenback against a trade-weighted basket of six major currencies, which slipped 0.19% to 100.835.
The Euro US Dollar (EUR/USD) is a widely traded pair that is up 0.13% today. This left the pair trading around $1.10030.
The Japanese yen was negative against the U.S. dollar on Thursday. Today USD/JPY is decline 0.31% to the 128.620 level.
Another commodity-related currency positive against the U.S dollar, AUD/USD rose 0.08% to 0.71410, and NZD/USD gain 0.32% to 0.65250 level.
EUR/USD Intraday: Trend on the upside
Our pivot point is at 1.09940
Preferable Price Action: Take long positions above pivot level with targets at 1.10920 & 1.10560 in extension.
Alternative Price Action: Below pivot looks for a further downside to 1.09300 & 1.08910.
Comment: RSI is above 50 levels and Pairs above 55MA.
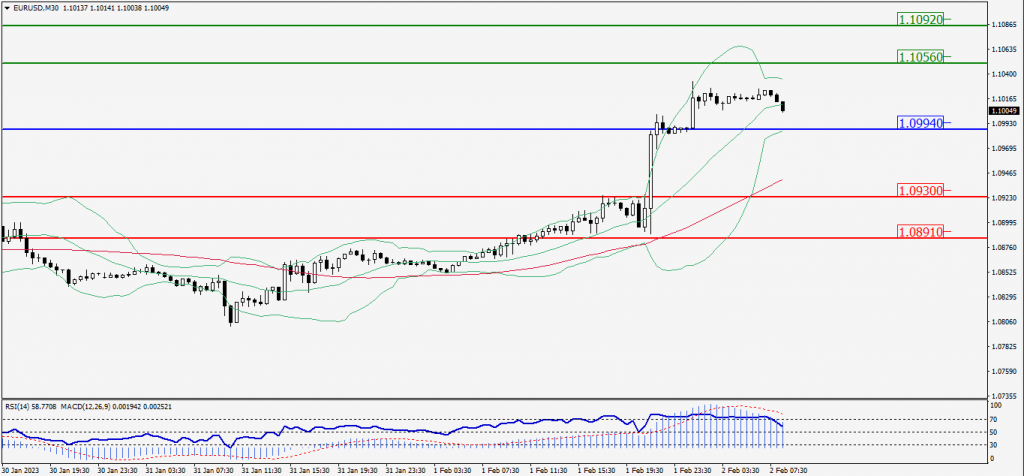
Green Lines Indicate Resistance Levels – Red Lines Indicate Support Levels
Light Blue is a Pivot Point – Black represents the price when the report was produced
GBP/USD Intraday: Trend on the upside
Our pivot point is at 1.23850
Preferable Price Action: Buy positions above pivot with targets at 1.24250 & 1.24480 in extension.
Alternative Price Action: The price below pivot would call for further downside to 1.23480 & 1.23250.
Comment: RSI is above 50 levels and Pairs above 55MA.
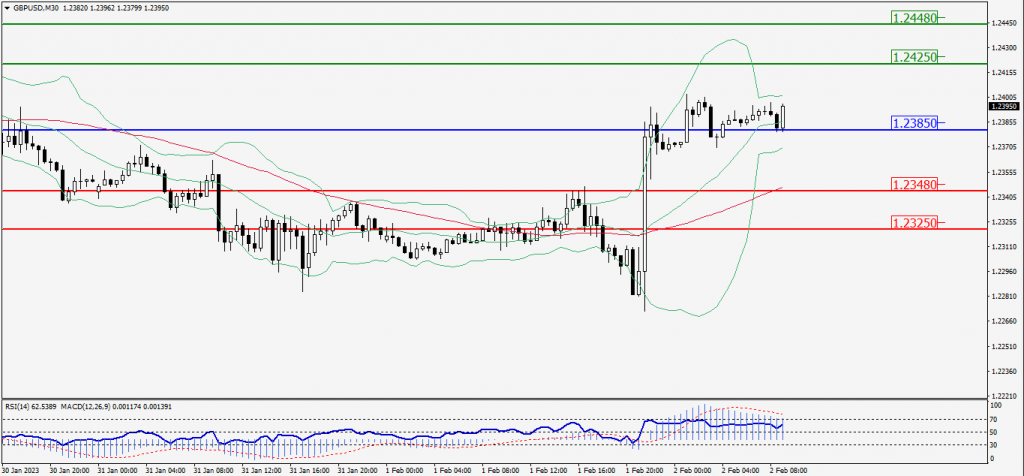
Green Lines Indicate Resistance Levels – Red Lines Indicate Support Levels
Light Blue is a Pivot Point – Black represents the price when the report was produced
USD/JPY Intraday: Trend on the downside
Our pivot point is at 128.840
Preferable Price Action: Sell position below pivot with the target at 128.260 and 127.930 in extension.
Alternative Price Action: The upside breakout of the pivot would call for 129.440 and 129.770.
Comment: MACD is below 50 level and Pairs below 55MA.
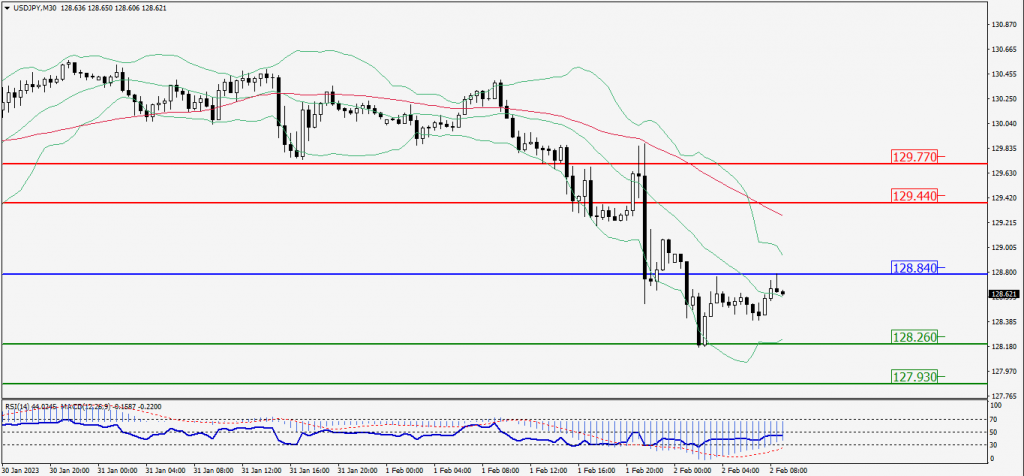
Green Lines Indicate Resistance Levels – Red Lines Indicate Support Levels
Light Blue is a Pivot Point – Black represents the price when the report was produced
AUD/USD Intraday: Support level at 0.71340
Our pivot point is at 0.71340
Preferable Price Action: Buy positions above pivot with targets at 0.71790 & 0.72070 in extension.
Alternative Price Action: Below pivot looks for a further downside with 0.70890 & 0.70610 as targets.
Comment: RSI is above 50 levels and pairs above 55MA.
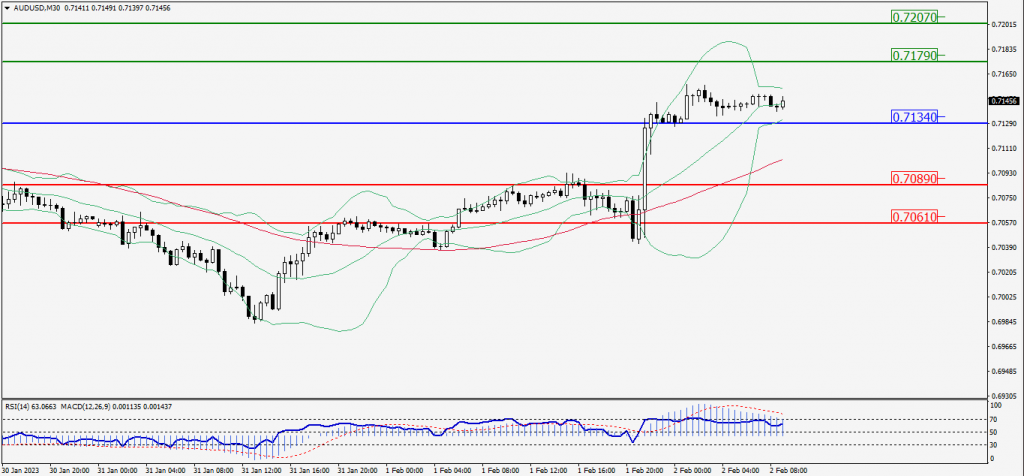
Green Lines Indicate Resistance Levels – Red Lines Indicate Support Levels
Light Blue is a Pivot Point – Black represents the price when the report was produced
CRUDEOIL Intraday: Resistance level at 77.42
Our pivot point is at 77.42
Preferable Price Action: Below pivot sell oil with 76.69 & 76.31 as targets.
Alternative Price Action: Buy crude above pivot with targets at 78.12 and 78.55 in extension.
Comment: MACD is negative territory and Pairs below 55MA.
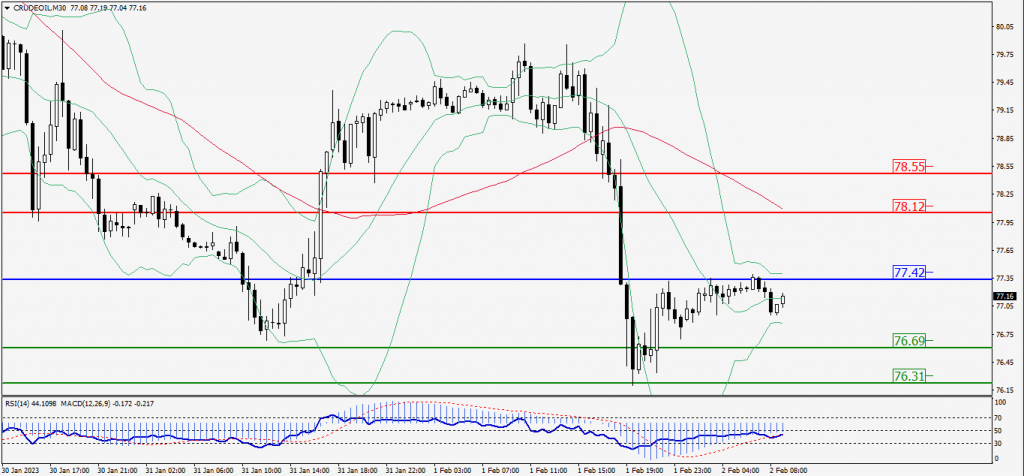
Green Lines Indicate Resistance Levels – Red Lines Indicate Support Levels
Light Blue is a Pivot Point – Black represents the price when the report was produced
XAU/USD Intraday: Major trend on the upside
Our pivot point is 1954.20
Preferable Price Action: Further upside to 1970.90 and 1981.00
Alternative Price Action: If the price gives a downside breakout of a pivot, then the price extends to 1937.00 and 1927.30.
Comment: MACD is above 50 level and Pairs above 55MA.
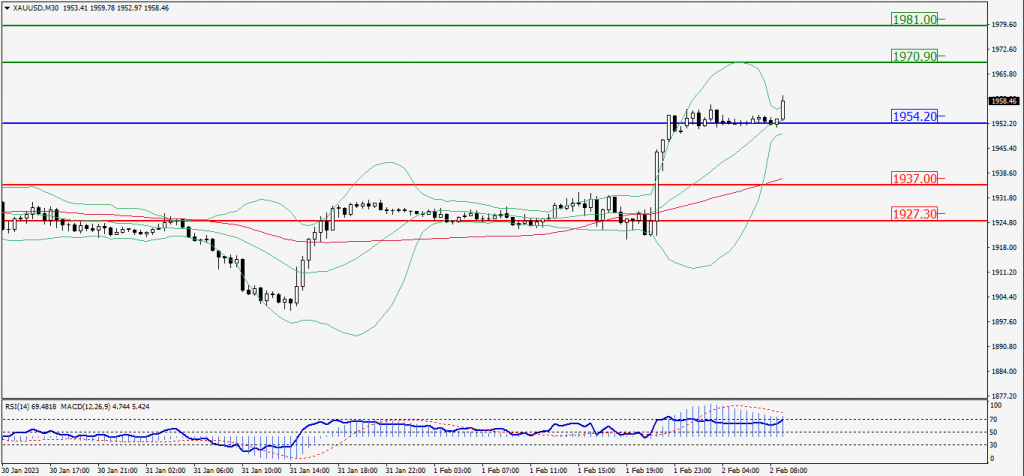
Green Lines Indicate Resistance Levels – Red Lines Indicate Support Levels
Light Blue is a Pivot Point – Black represents the price when the report was produced
Dow Jones Intraday: Support level at 34,016.00
Our pivot point is 34,016.00
Preferable Price Action: Take buy positions above the pivot with targets at 34,176.00 & 34,263.00.
Alternative Price Action: Below 34,016.00 looks for further downside to 33,869.00 & 33,778.00.
Comment: RSI is above 50 levels and Pairs above its 55MA.
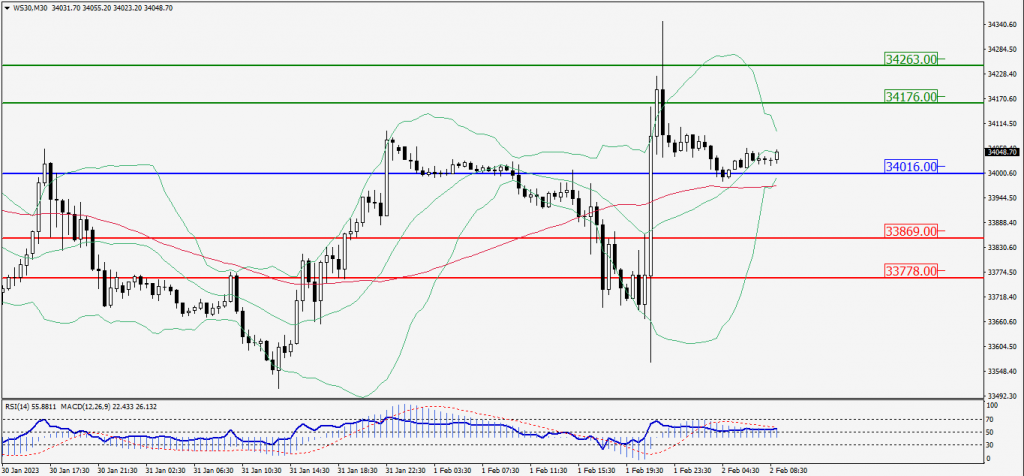
Green Lines Indicate Resistance Levels – Red Lines Indicate Support Levels
Light Blue is a Pivot Point – Black represents the price when the report was produced