Market Wrap: Stocks, Bonds, Commodities
Most Asian currencies strengthened on Friday as positive economic readings from the U.S. and China helped soothe concerns over a recession, although improved risk appetite put renewed pressure on the Japanese yen.
The Dow Jones Industrial Average rose 683.04 points to 39,446.49, the S&P 500 gain 2.30% to 5,391.31 and the Nasdaq Composite ascend 464.21 points to 16,660.02.
MSCI’s index of Asia-Pacific stocks outside Japan is up 1.79% to 679.02 levels. The Australian index was higher by 1.25% to 7,777.70. Japanese Nikkei Index increase 0.74% today.
European stocks were negative on Friday, with the Stoxx Europe 50 Index increase 0.21% to 4,678.75, Germany’s DAX ascend 0.19% to 17,700.25, and France’s CAC higher 0.30% to 7,268.96 and U.K.’s FTSE 100 gain 0.31% to 8,170.03.
Benchmark 10-year U.S. Treasury rose as demand for safe assets slipped again, today 10-year bond yields decrease 0.65% to 3.9710.
Oil prices were flat in Asian trade on Friday, but were set for their first positive week in five as a mix of bargain buying, improving sentiment towards the U.S. economy and persistent geopolitical tensions boosted prices.
Spot Brent crude oil decrease 0.65% to $79.04 per barrel. US West Texas Intermediate crude is decrease 0.09% to $76.12 a barrel.
The yellow metal gold is down 0.11% to 2,460.50 dollars per ounce.
Market Wrap: Forex
The dollar rose on Friday after new U.S. labor market data showed that unemployment benefits fell more than expected last week, easing fears of an imminent recession.
Today, the U.S. dollar index measures the Greenback against a trade-weighted basket of six major currencies, which decrease 0.08% to 102.937.
The Euro US Dollar (EUR/USD) is a widely traded pair that is increase 0.09% today. This left the pair trading around $1.0928.
The Japanese yen was will move negative against the U.S. dollar on Friday. Today USD/JPY is trades pair that decrease 0.30% to the 146.980 level.
Another commodity-related currency positive against the U.S dollar, AUD/USD gain 0.14% to 0.66010, and NZD/USD increase 0.22% to 0.60260 level.
EUR/USD Intraday: Resistance level at 1.09220
Our pivot point is at 1.09220
Preferable Price Action: Take buy positions above pivot level with targets at 1.09430 & 1.09640 in extension.
Alternative Price Action: Sell pivot looks for a further downside to 1.09010 & 1.08820.
Comment: RSI is above 50 levels and Pairs above its 55MA & 20MA.
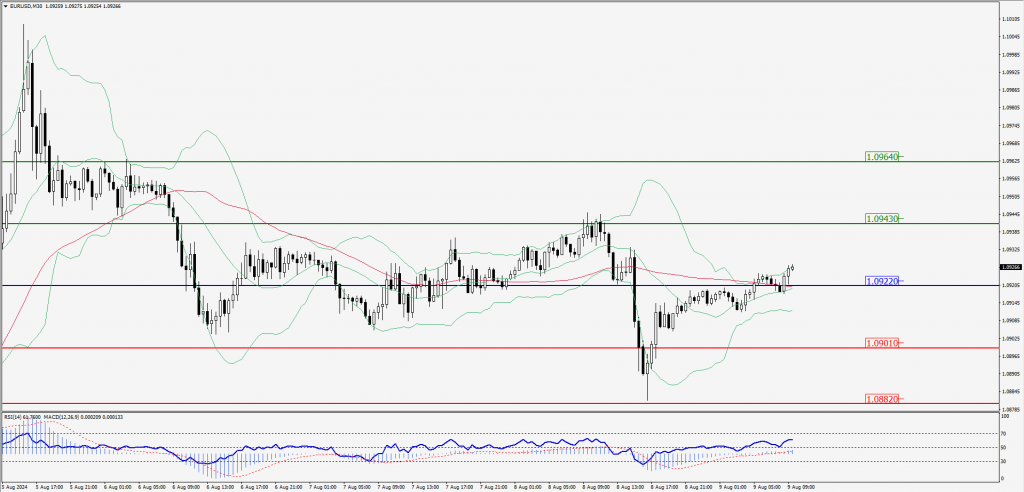
Green Lines Indicate Resistance Levels – Red Lines Indicate Support Levels
Light Blue is a Pivot Point – Black represents the price when the report was produced
GBP/USD Intraday: Trend on the upside
Our pivot point is at 1.27630
Preferable Price Action: Buy positions above pivot with targets at 1.27830 & 1.28020 in extension.
Alternative Price Action: The price below pivot would call for further downside to 1.27420 & 1.27220.
Comment: RSI is above 50 levels and Pairs above its 20MA & 55MA.
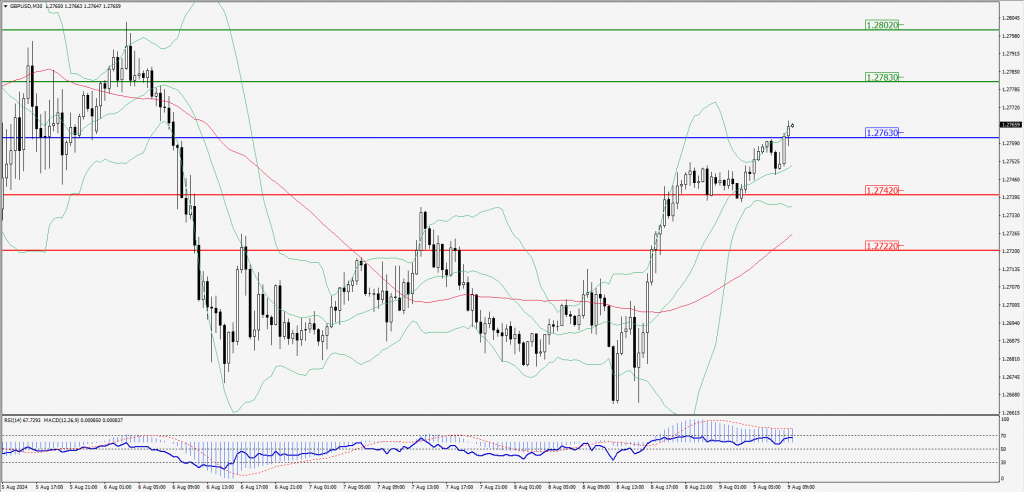
Green Lines Indicate Resistance Levels – Red Lines Indicate Support Levels
Light Blue is a Pivot Point – Black represents the price when the report was produced
USD/JPY Intraday: Trend on the downside
Our pivot point is at 147.450
Preferable Price Action: Sell position below pivot with the target at 146.610 and 145.830 in extension.
Alternative Price Action: The upside breakout of the pivot would call for 148.310 and 149.020.
Comment: MACD is below 50 levels and Pairs below its 20MA.
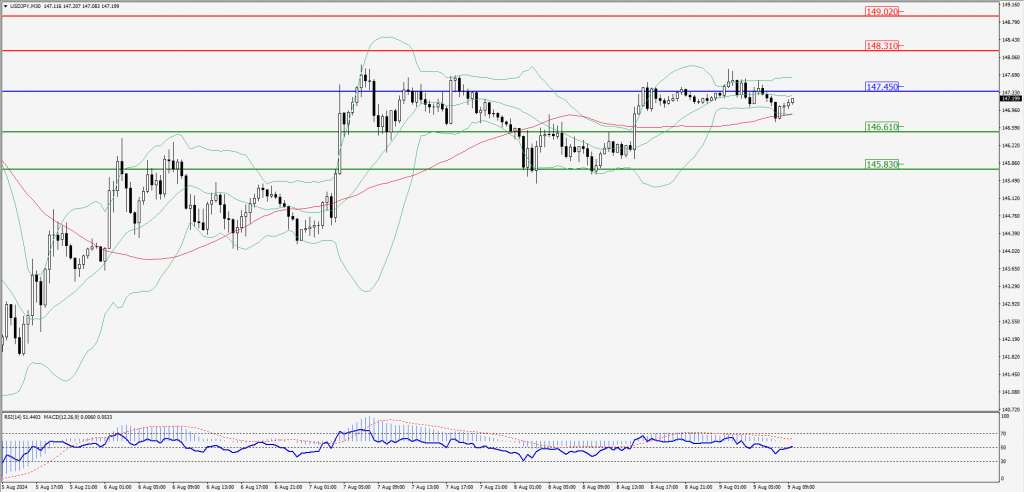
Green Lines Indicate Resistance Levels – Red Lines Indicate Support Levels
Light Blue is a Pivot Point – Black represents the price when the report was produced
AUD/USD Intraday: Trend on the upside
Our pivot point is at 0.65950
Preferable Price Action: Buy positions above pivot with targets at 0.66210 & 0.66420 in extension.
Alternative Price Action: Below pivot a further downside with 0.65700 & 0.65480 as targets.
Comment: RSI is above 50 levels and Pairs above its 55MA & 20MA.
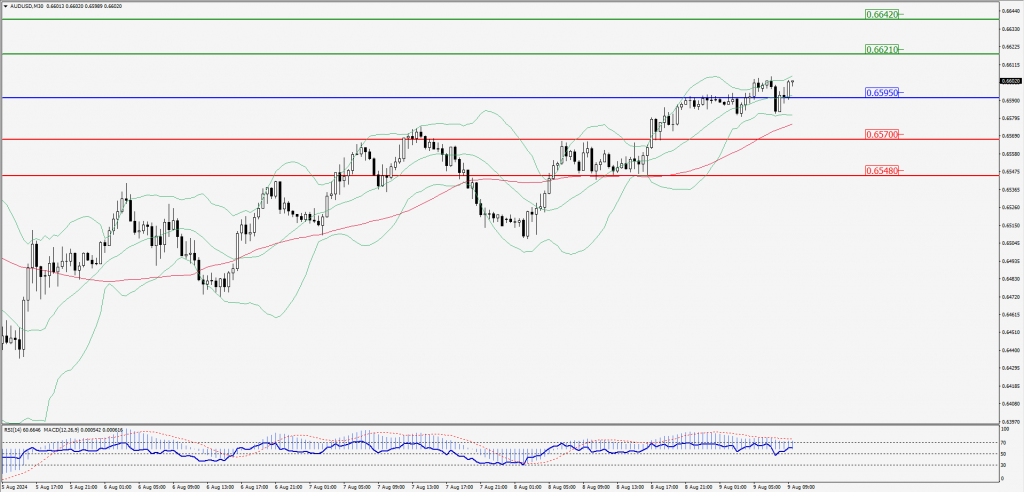
Green Lines Indicate Resistance Levels – Red Lines Indicate Support Levels
Light Blue is a Pivot Point – Black represents the price when the report was produced
CRUDEOIL Intraday: Trend on the upside
Our pivot point is at 75.18
Preferable Price Action: Above pivot buy oil with 75.72 & 76.19 as targets.
Alternative Price Action: Sell crude below pivot with targets at 74.66 and 74.13 in extension.
Comment: RSI is above 50 levels and pairs above its 50MA.
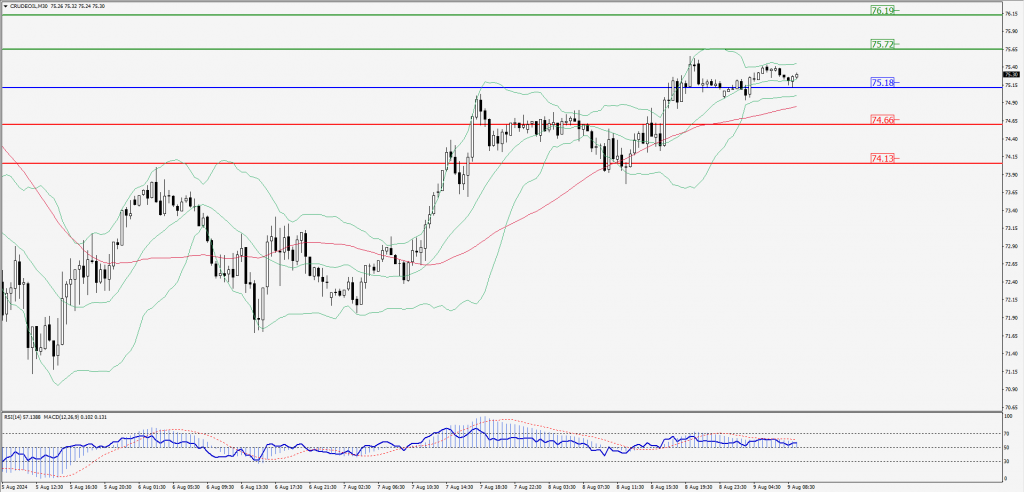
Green Lines Indicate Resistance Levels – Red Lines Indicate Support Levels
Light Blue is a Pivot Point – Black represents the price when the report was produced
XAU/USD Intraday: Trend on the upside
Our pivot point is at 2419.50
Preferable Price Action: Further upside to 2429.80 and 2438.90.
Alternative Price Action: If the price gives an downside breakout of a pivot, then the price extends to 2408.50 and 2398.50.
Comment: MACD is above 50 levels and pairs above its 55MA.
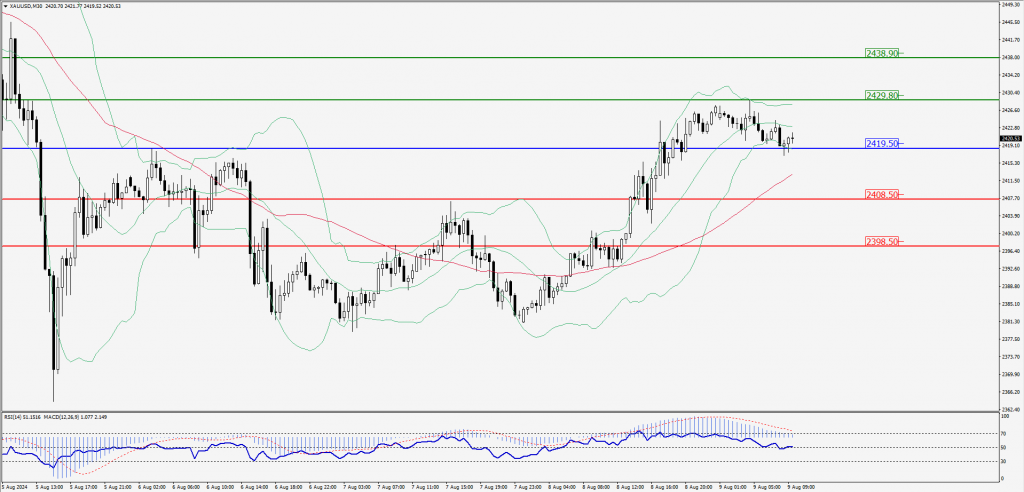
Green Lines Indicate Resistance Levels – Red Lines Indicate Support Levels
Light Blue is a Pivot Point – Black represents the price when the report was produced
Dow Jones Intraday: Trend on the upside
Our pivot point is 39,443.40
Preferable Price Action: Take buy positions above the pivot with targets at 39,597.60 & 39,732.80.
Alternative Price Action: Below 39,443.40 looks for further downside to 39,284.90 & 39,145.50.
Comment: RSI is above 50 levels and pairs above its 55MA.
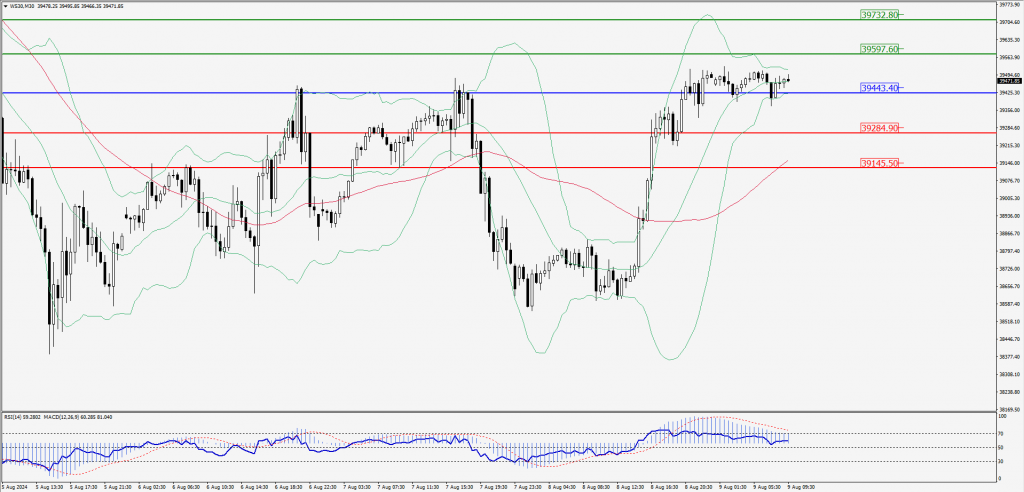
Green Lines Indicate Resistance Levels – Red Lines Indicate Support Levels
Light Blue is a Pivot Point – Black represents the price when the report was produced