Market Wrap: Stocks, Bonds, Commodities
US stocks closed higher on Thursday, after the Federal Reserve announced a cut of 25 basis points (bps) in interest rates, extending a sharp rally sparked by Donald Trump’s return as U.S. president.
The Dow Jones Industrial Average fail 0.59 points to 43,729.34, the S&P 500 gain 0.94% to 5,973.10 and the Nasdaq Composite up 285.99 points to 19,269.46.
MSCI’s index of Asia-Pacific stocks outside Japan is up 0.91% to 742.90 levels. The Australian index was higher by 0.84% to 8,295.10. Japanese Nikkei Index increase 0.19% today.
European stocks were mixed on Friday, with the Stoxx Europe 50 Index increase 1.06% to 4,851.65 Germany’s DAX ascend 1.70% to 19.362.52, and France’s CAC higher 0.76% to 7,425.60 and U.K.’s FTSE 100 loss 0.32% to 8,140.74.
Benchmark 10-year U.S. Treasury fail as demand for safe assets slipped again, today 10-year bond yields 0.16% to 4.3350.
Oil prices erased some of the previous session gains in the early trade on Friday.
Spot Brent crude oil decrease 0.58% to $75.19 per barrel. US West Texas Intermediate crude is decrease 0.75% to $71.82 a barrel.
The yellow metal gold is down 0.53% to 2,691.40 dollars per ounce.
Market Wrap: Forex
The dollar took a breather on Friday, on track to cap off a wild week with a slight gain as markets weighed the impact of Donald Trump’s impending return to the White House and what that would mean for the U.S. economy and its rate outlook.
Today, the U.S. dollar index measures the Greenback against a trade-weighted basket of six major currencies, which either ascend 0.05% to 104.420.
The Euro US Dollar (EUR/USD) is a widely traded is either up or down 0.24% today. This left the pair trading around $1.07790.
The Japanese yen was will move negative against the U.S. dollar on Friday. Today USD/JPY is trades pair that decrease 0.10% to the 152.78 level.
Another commodity-related currency negative against the U.S dollar, AUD/USD loss 0.40% to 0.66510, and NZD/USD decrease 0.27% to 0.60080 level.
EUR/USD Intraday: Trend on the downside
Our pivot point is at 1.07850
Preferable Price Action: Take sell positions below pivot level with targets at 1.07540 & 1.07230 in extension.
Alternative Price Action: Buy pivot looks for a further upside to 1.08200 & 1.08490.
Comment: RSI is below 50 levels and pairs below its 20MA.
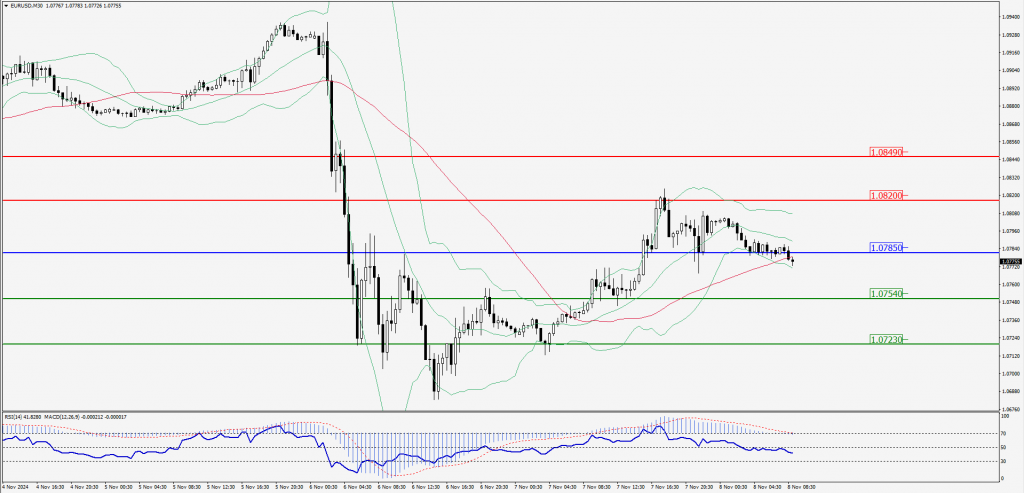
Green Lines Indicate Resistance Levels – Red Lines Indicate Support Levels
Light Blue is a Pivot Point – Black represents the price when the report was produced
GBP/USD Intraday: Trend on the downside
Our pivot point is at 1.29760
Preferable Price Action: Sell positions below pivot with targets at 1.29510 & 1.29280 in extension.
Alternative Price Action: The price above pivot would call for further upside to 1.30010 & 1.30250.
Comment: RSI is below 50 levels and pairs below its 20MA.
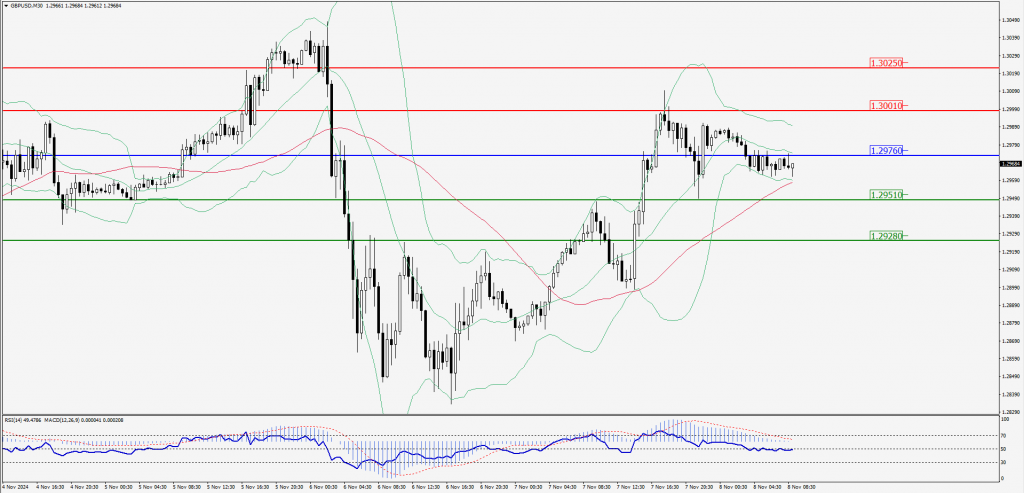
Green Lines Indicate Resistance Levels – Red Lines Indicate Support Levels
Light Blue is a Pivot Point – Black represents the price when the report was produced
USD/JPY Intraday: Trend on the downside
Our pivot point is at 152.960
Preferable Price Action: Sell position below pivot with the target at 152.520 and 152.110 in extension.
Alternative Price Action: The upside breakout of the pivot would call for 153.420 and 153.800.
Comment: MACD is below 50 levels and pairs below its 55MA.
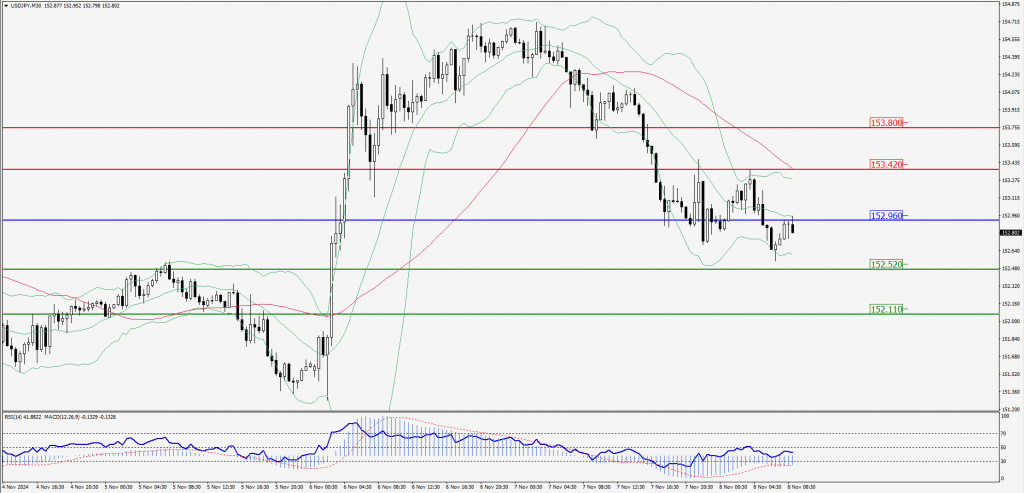
Green Lines Indicate Resistance Levels – Red Lines Indicate Support Levels
Light Blue is a Pivot Point – Black represents the price when the report was produced
AUD/USD Intraday: Trend on the downside
Our pivot point is at 0.66560
Preferable Price Action: Sell positions below pivot with targets at 0.66370 & 0.66200 in extension.
Alternative Price Action: Above pivot a further upside with 0.66930 & 0.66760 as targets.
Comment: RSI is below 50 levels and pairs below its 55MA & 20MA.
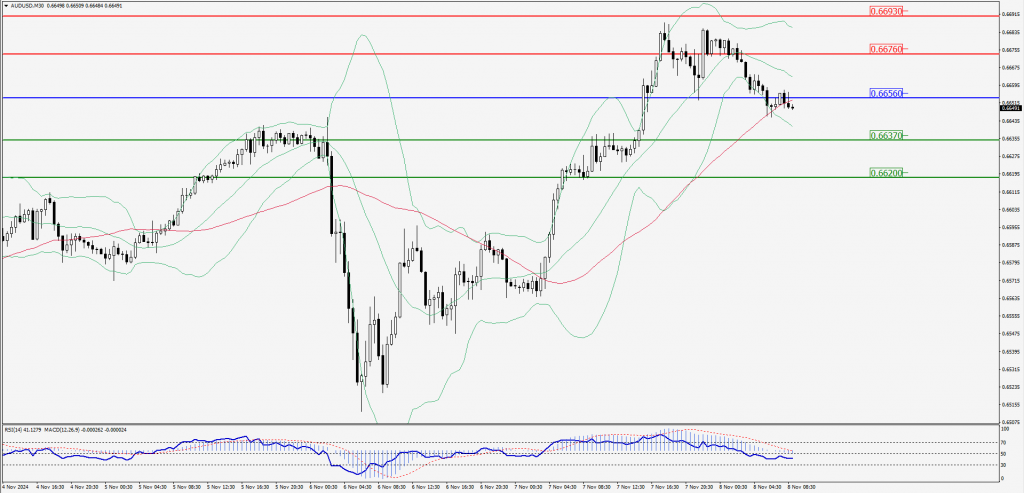
Green Lines Indicate Resistance Levels – Red Lines Indicate Support Levels
Light Blue is a Pivot Point – Black represents the price when the report was produced
CRUDEOIL Intraday: Trend on the downside
Our pivot point is at 71.63
Preferable Price Action: Below pivot sell oil with 71.22 & 70.88 as targets.
Alternative Price Action: Buy crude above pivot with targets at 72.05 & 72.39 in extension.
Comment: RSI is at below 50 levels and pairs below its 20MA.
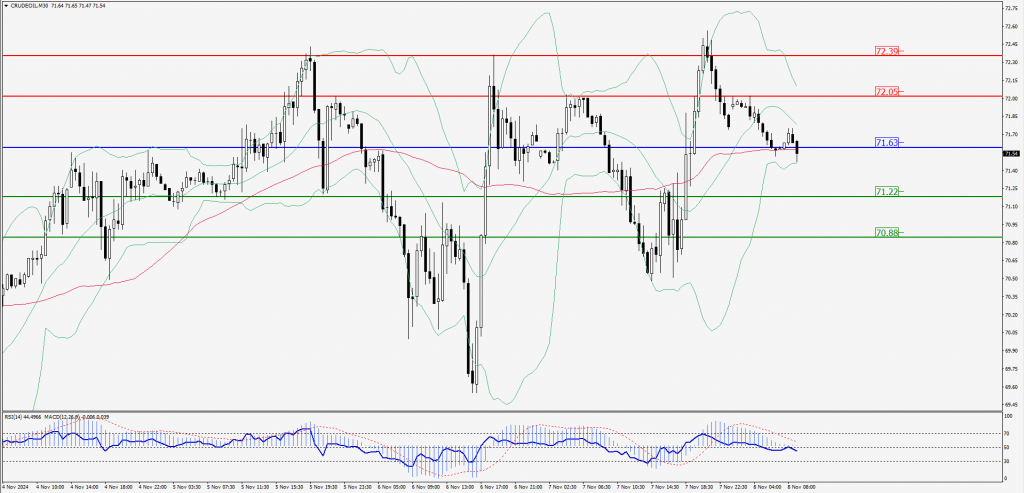
Green Lines Indicate Resistance Levels – Red Lines Indicate Support Levels
Light Blue is a Pivot Point – Black represents the price when the report was produced
XAU/USD Intraday: Trend on the downside
Our pivot point is at 2691.60
Preferable Price Action: Further downside to 2678.60 and 2666.30.
Alternative Price Action: If the price gives an upside breakout of a pivot, then the price extends to 2703.90 and 2716.30.
Comment: MACD is below 50 levels and pairs below its 20MA.
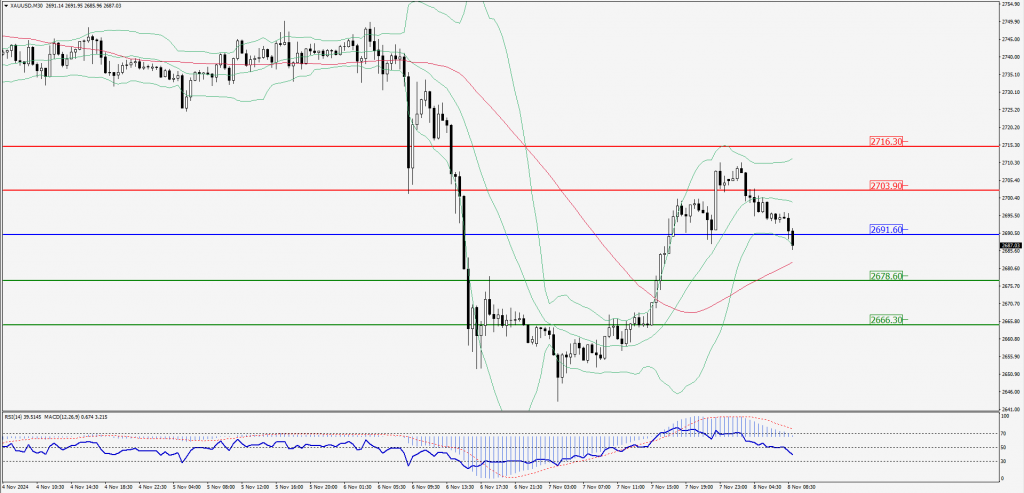
Green Lines Indicate Resistance Levels – Red Lines Indicate Support Levels
Light Blue is a Pivot Point – Black represents the price when the report was produced
Dow Jones Intraday: Trend on the downside
Our pivot point is 43,880.20
Preferable Price Action: Take sell positions below the pivot with targets at 43,561.60 & 43,261.80.
Alternative Price Action: Above 43,880.20 looks for further upside to 44,208.20 & 44,498.70.
Comment: RSI is below 50 levels.
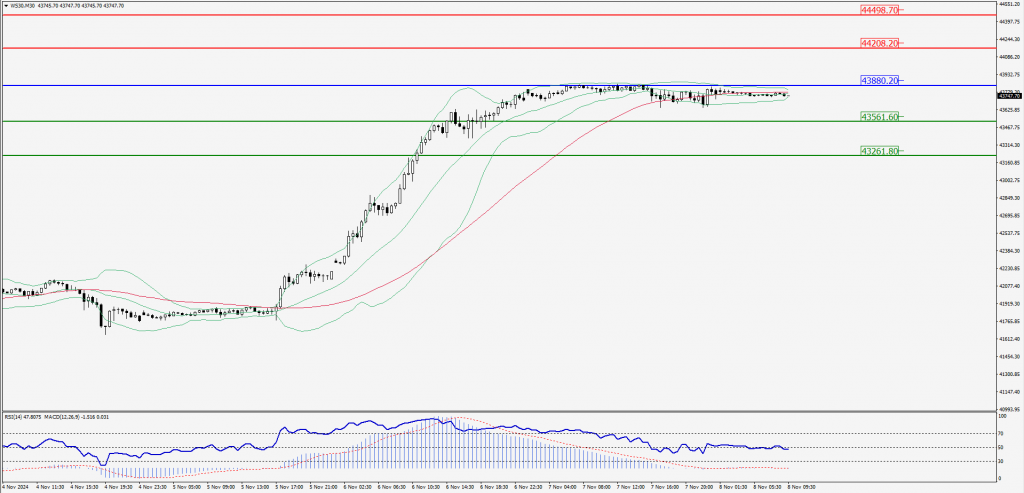
Green Lines Indicate Resistance Levels – Red Lines Indicate Support Levels
Light Blue is a Pivot Point – Black represents the price when the report was produced