Market Wrap: Stocks, Bonds, Commodities
Most Asian currencies steadied from recent losses on Thursday, while the dollar hovered around four-month highs after a Donald Trump victory in the presidential election.
The Dow Jones Industrial Average rose 1508.05 points to 43,729.93, the S&P 500 gain 2.53% to 5,929.04 and the Nasdaq Composite up 544.30 points to 18,983.47.
MSCI’s index of Asia-Pacific stocks outside Japan is down 0.28% to 740.52 levels. The Australian index was higher by 0.33% to 8,226.30. Japanese Nikkei Index decrease 0.09% today.
European stocks were negative on Thursday, with the Stoxx Europe 50 Index decrease 1.47% to 4,798.85 Germany’s DAX descend 1.13% to 19.039.31, and France’s CAC lower 0.51% to 7,369.61 and U.K.’s FTSE 100 loss 0.07% to 8,166.68.
Benchmark 10-year U.S. Treasury fail as demand for safe assets slipped again, today 10-year bond yields 0.47% to 4.4100.
World oil prices have been capped by concerns about an unwinding of OPEC+ supply cuts in 2025 and China’s weak oil demand growth despite risks of supply disruption in the Middle East.
Spot Brent crude oil decrease 0.04% to $74.89 per barrel. US West Texas Intermediate crude is decrease 0.14% to $71.59 a barrel.
The yellow metal gold is down 0.25% to 2,669.70 dollars per ounce.
Market Wrap: Forex
The dollar soared to a four-month high on Thursday after Republican Donald Trump won the U.S. presidential election, with policies on immigration, tax and trade expected to spur higher U.S. growth and inflation.
Today, the U.S. dollar index measures the Greenback against a trade-weighted basket of six major currencies, which either descend 0.29% to 104.677.
The Euro US Dollar (EUR/USD) is a widely traded is either up or up 0.34% today. This left the pair trading around $1.07640.
The Japanese yen was will move negative against the U.S. dollar on Thursday. Today USD/JPY is trades pair that decrease 0.55% to the 153.78 level.
Another commodity-related currency positive against the U.S dollar, AUD/USD gain 1.00% to 0.66330, and NZD/USD increase 0.96% to 0.59950 level.
EUR/USD Intraday: Trend on the upside
Our pivot point is at 1.07400
Preferable Price Action: Take buy positions above pivot level with targets at 1.07710 & 1.08000 in extension.
Alternative Price Action: Sell pivot looks for a further downside to 1.07080 & 1.06810.
Comment: RSI is above 50 levels and pairs above its 55MA & 20MA.
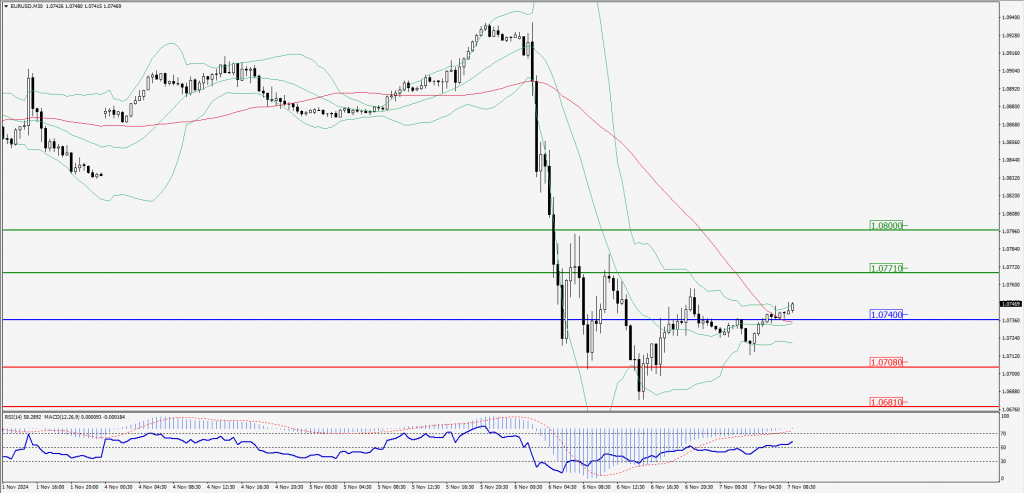
Green Lines Indicate Resistance Levels – Red Lines Indicate Support Levels
Light Blue is a Pivot Point – Black represents the price when the report was produced
GBP/USD Intraday: Trend on the upside
Our pivot point is at 1.29260
Preferable Price Action: Buy positions above pivot with targets at 1.29550 & 1.29810 in extension.
Alternative Price Action: The price below pivot would call for further downside to 1.28980 & 1.28720.
Comment: RSI is above 50 levels and pairs above its 20MA & 55MA.
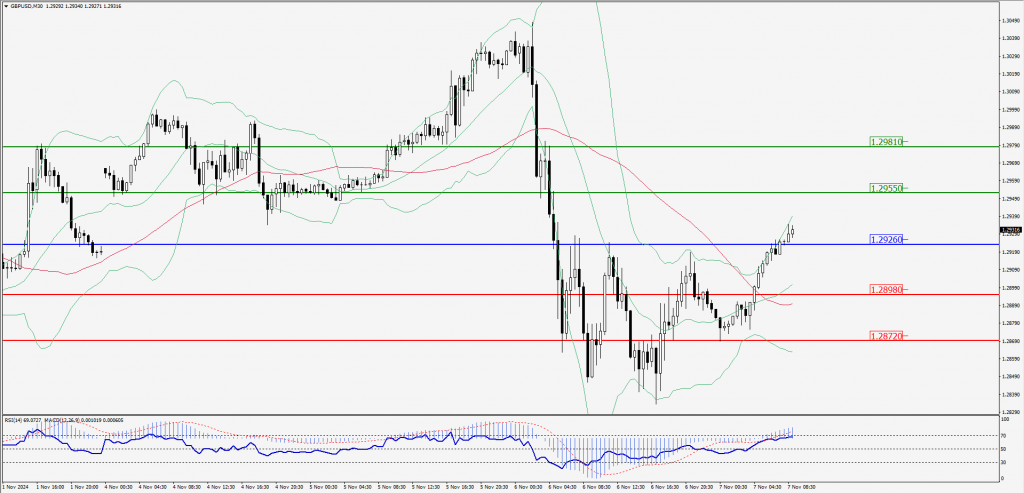
Green Lines Indicate Resistance Levels – Red Lines Indicate Support Levels
Light Blue is a Pivot Point – Black represents the price when the report was produced
USD/JPY Intraday: Trend on the downside
Our pivot point is at 154.160
Preferable Price Action: Sell position below pivot with the target at 153.760 and 153.410 in extension.
Alternative Price Action: The upside breakout of the pivot would call for 154.540 and 154.860.
Comment: MACD is below 50 levels and pairs below its 55MA & 20MA.
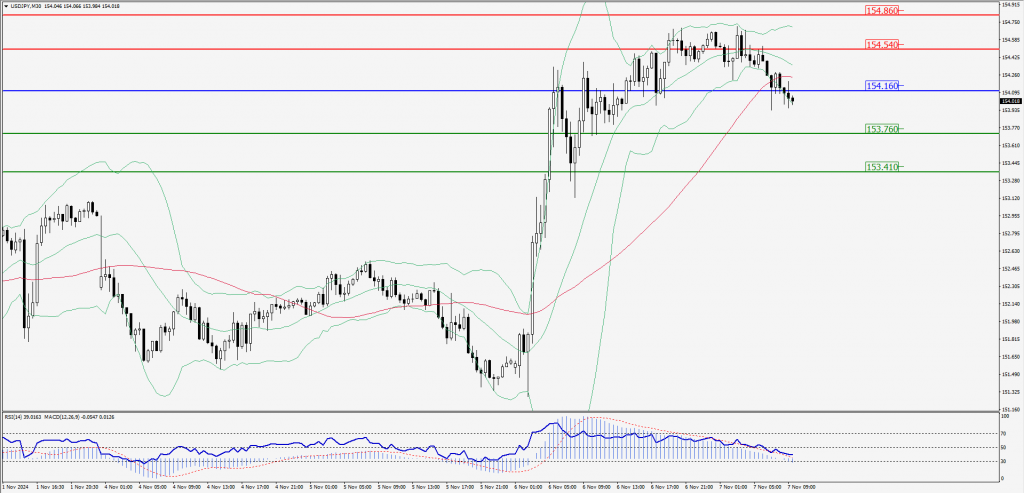
Green Lines Indicate Resistance Levels – Red Lines Indicate Support Levels
Light Blue is a Pivot Point – Black represents the price when the report was produced
AUD/USD Intraday: Major trend on the upside
Our pivot point is at 0.66160
Preferable Price Action: Buy positions above pivot with targets at 0.66320 & 0.66470 in extension.
Alternative Price Action: Below pivot a further downside with 0.66000 & 0.65840 as targets.
Comment: RSI is above 50 levels and pairs above its 55MA & 20MA.
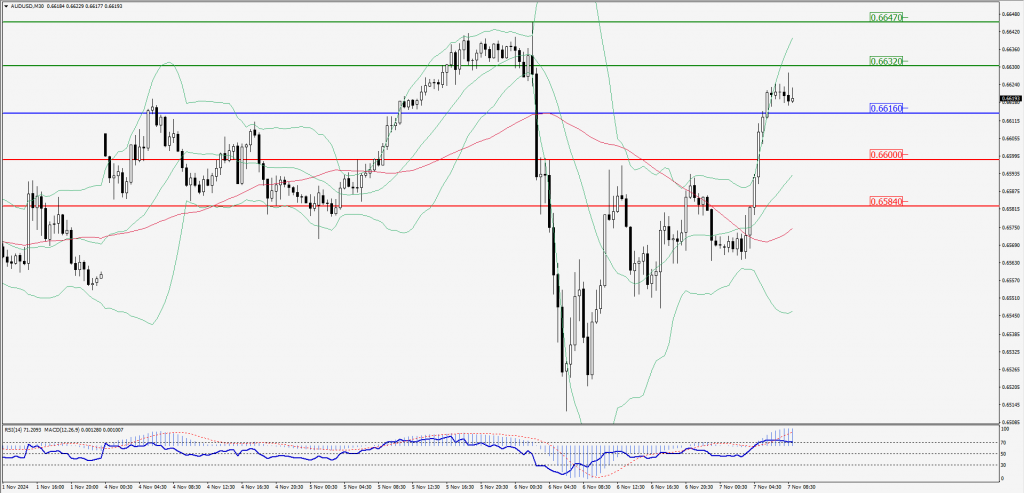
Green Lines Indicate Resistance Levels – Red Lines Indicate Support Levels
Light Blue is a Pivot Point – Black represents the price when the report was produced
CRUDEOIL Intraday: Trend on the downside
Our pivot point is at 71.74
Preferable Price Action: Below pivot sell oil with 71.36 & 71.01 as targets.
Alternative Price Action: Buy crude above pivot with targets at 72.11 & 72.46 in extension.
Comment: RSI is at below 50 levels and pairs below its 20MA.
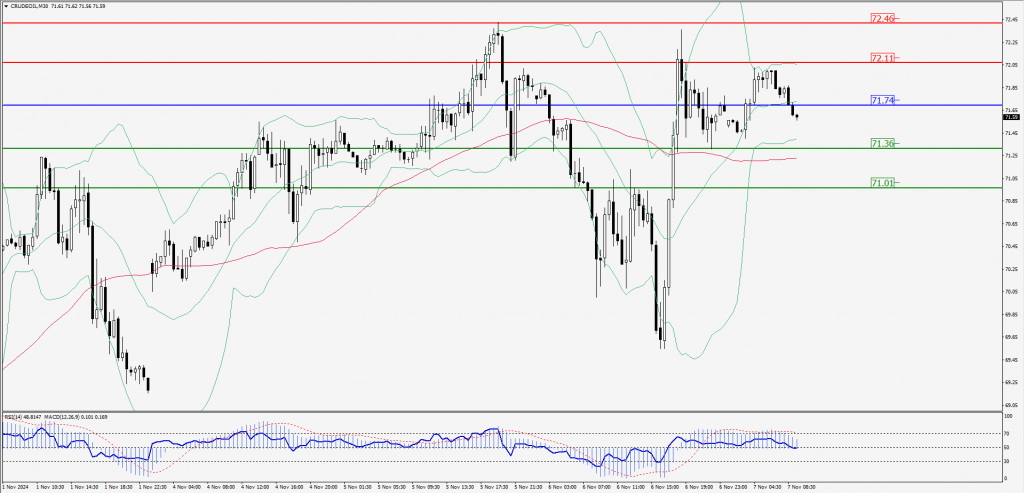
Green Lines Indicate Resistance Levels – Red Lines Indicate Support Levels
Light Blue is a Pivot Point – Black represents the price when the report was produced
XAU/USD Intraday: Trend on the downside
Our pivot point is at 2661.20
Preferable Price Action: Further downside to 2646.20 and 2632.60.
Alternative Price Action: If the price gives an upside breakout of a pivot, then the price extends to 2677.10 and 2690.90.
Comment: MACD is below 50 levels and pairs below its 20MA & 55MA.
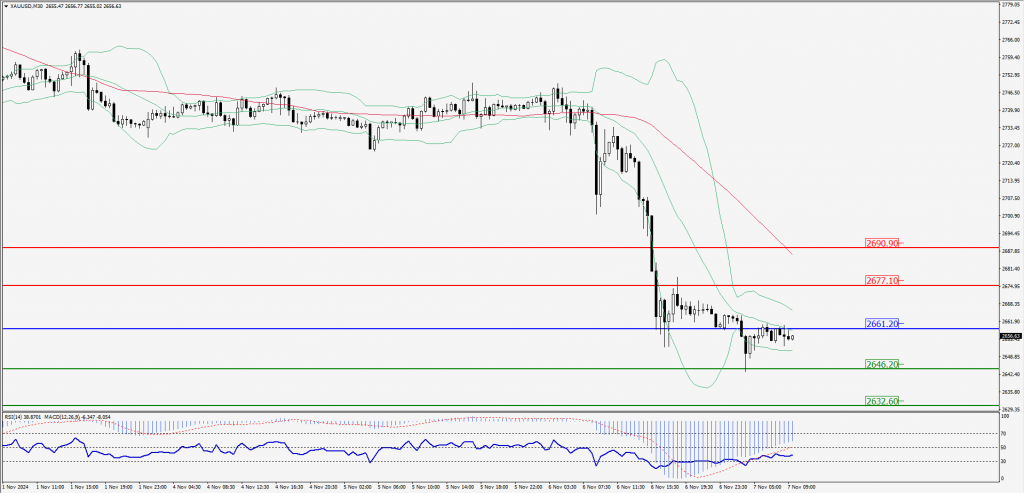
Green Lines Indicate Resistance Levels – Red Lines Indicate Support Levels
Light Blue is a Pivot Point – Black represents the price when the report was produced
Dow Jones Intraday: Major trend on the upside
Our pivot point is 43,763.50
Preferable Price Action: Take buy positions above the pivot with targets at 44,037.40 & 44,290.50.
Alternative Price Action: Below 43,763.50 looks for further downside to 43,481.30 & 43,224.10.
Comment: RSI is above 50 levels and pairs above its 20MA & 55MA.
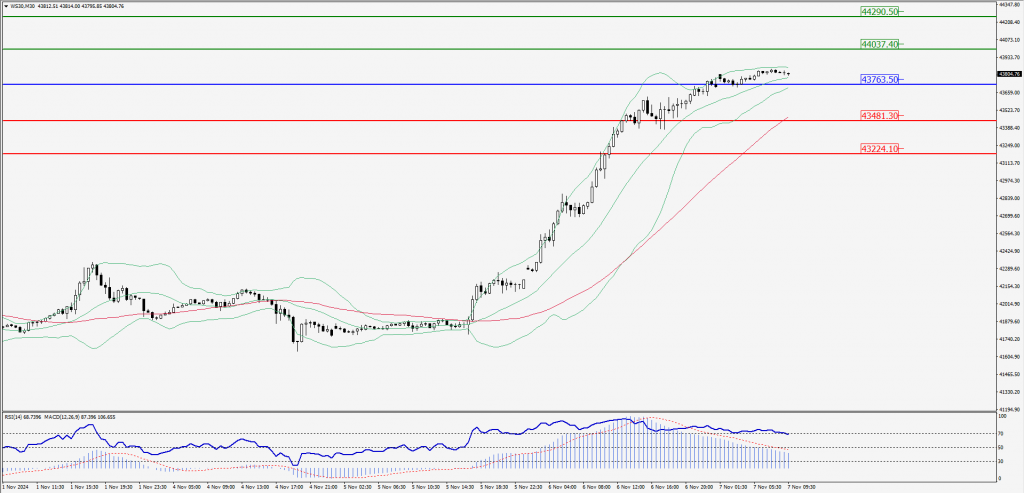
Green Lines Indicate Resistance Levels – Red Lines Indicate Support Levels
Light Blue is a Pivot Point – Black represents the price when the report was produced