Market Wrap: Stocks, Bonds, Commodities
The US dollar sagged near a one-week low versus major peers on Friday with job market indicators sending mixed signals ahead of crucial monthly payrolls data later in the day that is almost certain to set the pace for Federal Reserve policy easing.
The Dow Jones Industrial Average fail 219.22 points to 40,755.75, the S&P 500 loss 0.30% to 5,503.41 and the Nasdaq Composite ascend 43.36 points to 17,127.66.
MSCI’s index of Asia-Pacific stocks outside Japan is up 0.59% to 689.27 levels. The Australian index was higher by 0.39% to 8,013.40. Japanese Nikkei Index decrease 0.62% today.
European stocks were negative on Friday, with the Stoxx Europe 50 Index decrease 0.61% to 4,785.85 Germany’s DAX descend 0.79% to 18,448.15, and France’s CAC lower 0.48% to 7,396.18 and U.K.’s FTSE 100 loss 0.51% to 8,199.93.
Benchmark 10-year U.S. Treasury fail as demand for safe assets slipped again, today 10-year bond yields 0.90% to 3.6990.
Oil prices ticked up in Asian trading on Friday, with investors exercising caution ahead of key U.S. employment data as they weighed a big withdrawal from U.S. crude inventories and a delay to production hikes by OPEC+ producers.
Spot Brent crude oil increase 0.33% to $72.93 per barrel. US West Texas Intermediate crude is increase 0.39% to $69.42 a barrel.
The yellow metal gold is up 0.24% to 2,549.25 dollars per ounce.
Market Wrap: Forex
The benchmark S&P 500 index and the Dow ended lower in choppy trading on Thursday after a short-lived boost from a string of economic reports faded and investors eyed key jobs data due on Friday. The Nasdaq finished slightly higher.
Today, the U.S. dollar index measures the Greenback against a trade-weighted basket of six major currencies, which decrease 0.25% to 100.822.
The Euro US Dollar (EUR/USD) is a widely traded is up 0.08% today. This left the pair trading around $1.11190.
The Japanese yen was will move negative against the U.S. dollar on Friday. Today USD/JPY is trades pair that decrease 0.93% to the 142.110 level.
Another commodity-related currency mixed against the U.S dollar, AUD/USD loss 0.10% to 0.67340, and NZD/USD increase 0.03% to 0.62240 level.
EUR/USD Intraday: Trend on the upside
Our pivot point is at 1.11140
Preferable Price Action: Take buy positions above pivot level with targets at 1.11300 & 1.11440 in extension.
Alternative Price Action: Sell pivot looks for a further downside to 1.10970 & 1.10820.
Comment: RSI is above 50 levels and Pairs above its 20MA & 55MA.
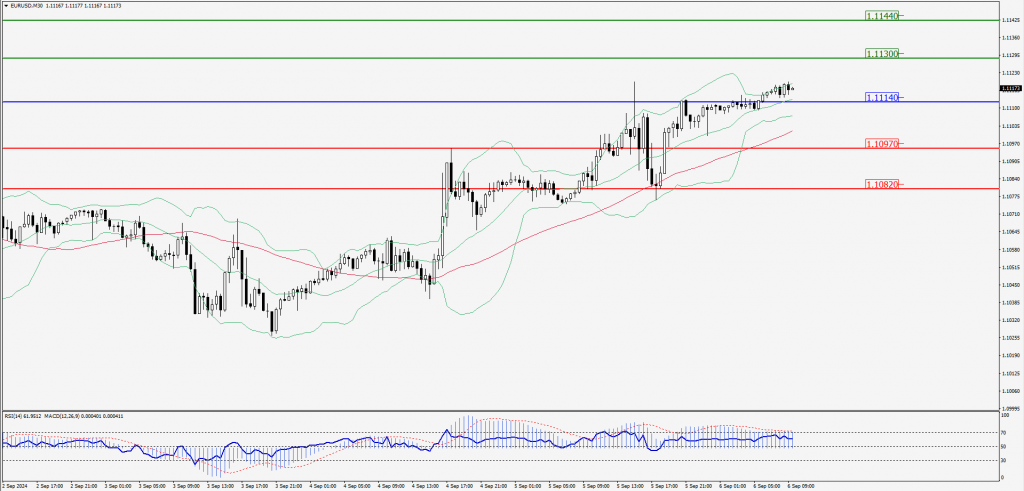
Green Lines Indicate Resistance Levels – Red Lines Indicate Support Levels
Light Blue is a Pivot Point – Black represents the price when the report was produced
GBP/USD Intraday: Trend on the upside
Our pivot point is at 1.31740
Preferable Price Action: Buy positions above pivot with targets at 1.31910 & 1.32050 in extension.
Alternative Price Action: The price below pivot would call for further downside to 1.31560 & 1.31400.
Comment: RSI is above 50 levels and Pairs above its 55MA.
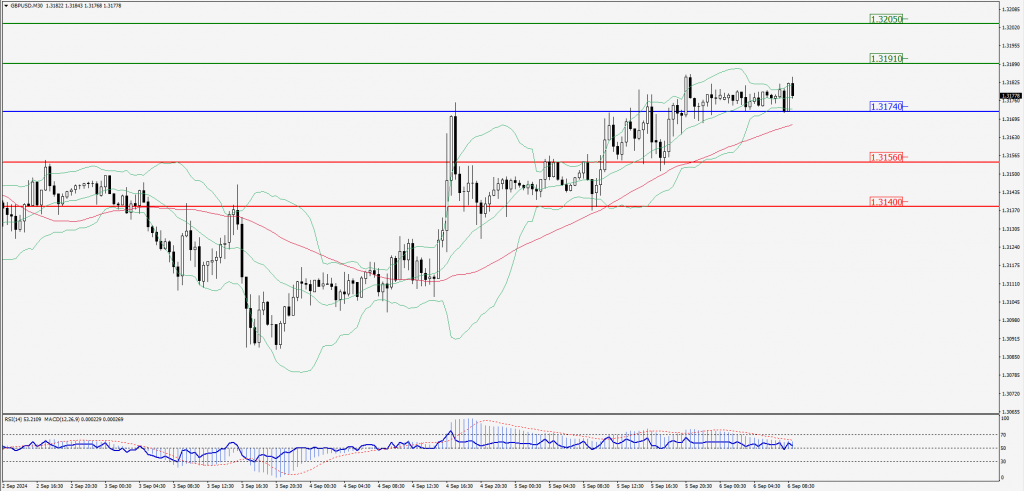
Green Lines Indicate Resistance Levels – Red Lines Indicate Support Levels
Light Blue is a Pivot Point – Black represents the price when the report was produced
USD/JPY Intraday: Trend on the downside
Our pivot point is at 142.760
Preferable Price Action: Sell position below pivot with the target at 141.910 and 141.130 in extension.
Alternative Price Action: The upside breakout of the pivot would call for 143.580 and 144.320.
Comment: MACD is below 50 levels and Pairs below its 55MA & 20MA.
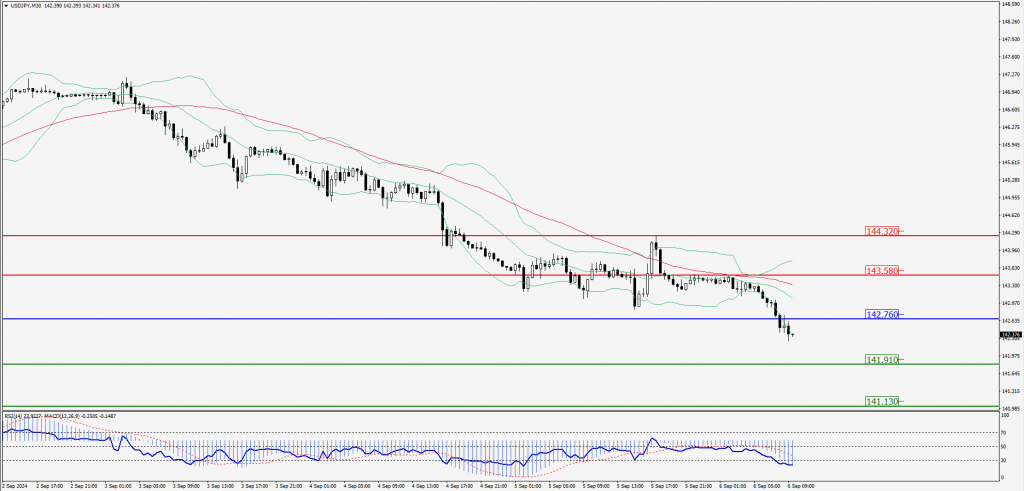
Green Lines Indicate Resistance Levels – Red Lines Indicate Support Levels
Light Blue is a Pivot Point – Black represents the price when the report was produced
AUD/USD Intraday: Trend on the downside
Our pivot point is at 0.67360
Preferable Price Action: Sell positions below pivot with targets at 0.67210 & 0.67070 in extension.
Alternative Price Action: Above pivot a further upside with 0.67510 & 0.67650 as targets.
Comment: RSI is below 50 levels and pairs below its 20MA.
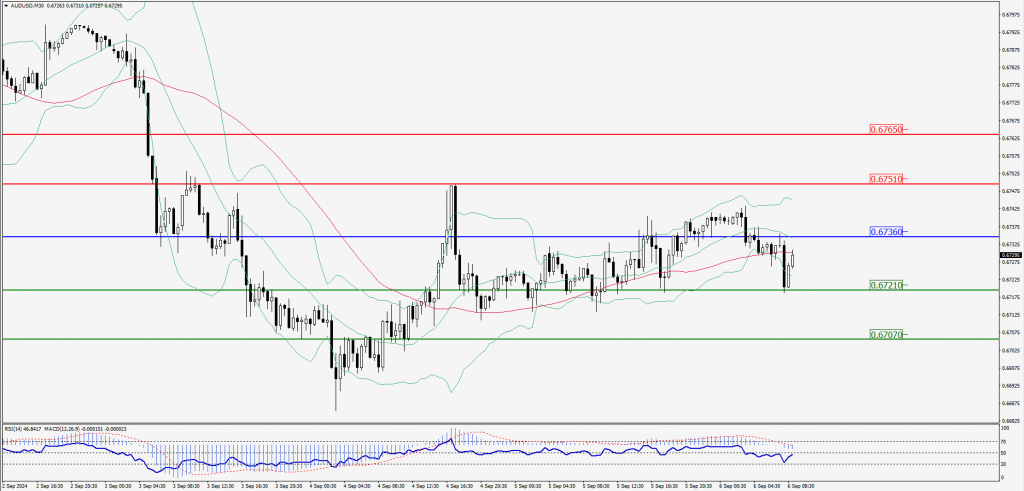
Green Lines Indicate Resistance Levels – Red Lines Indicate Support Levels
Light Blue is a Pivot Point – Black represents the price when the report was produced
CRUDEOIL Intraday: Trend on the upside
Our pivot point is at 68.84
Preferable Price Action: Above pivot buy oil with 69.56 & 70.29 as targets.
Alternative Price Action: Sell crude below pivot with targets at 68.08 and 67.39 in extension.
Comment: RSI is at above 50 levels and pairs above its 20MA.
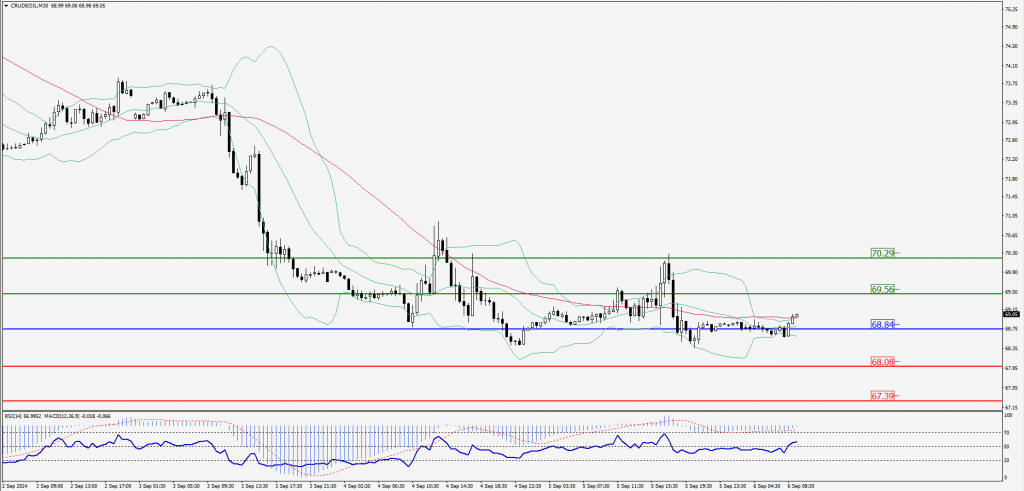
Green Lines Indicate Resistance Levels – Red Lines Indicate Support Levels
Light Blue is a Pivot Point – Black represents the price when the report was produced
XAU/USD Intraday: Trend on the upside
Our pivot point is at 2517.50
Preferable Price Action: Further upside to 2525.50 and 2532.10.
Alternative Price Action: If the price gives an downside breakout of a pivot, then the price extends to 2509.60 and 2502.90.
Comment: MACD is above 50 levels and pairs above its 55MA & 20MA.
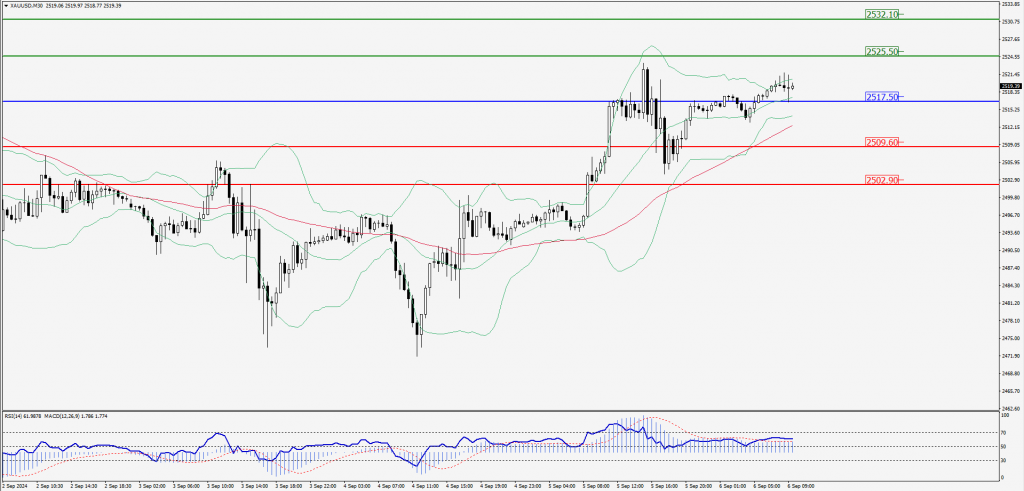
Green Lines Indicate Resistance Levels – Red Lines Indicate Support Levels
Light Blue is a Pivot Point – Black represents the price when the report was produced
Dow Jones Intraday: Trend on the downside
Our pivot point is 40,802.40
Preferable Price Action: Take sell positions below the pivot with targets at 40,670.40 & 40,542.80.
Alternative Price Action: Above 40,802.40 looks for further upside to 41,947.60 & 41,078.10.
Comment: RSI is below 50 levels and pairs below its 20MA & 55MA.
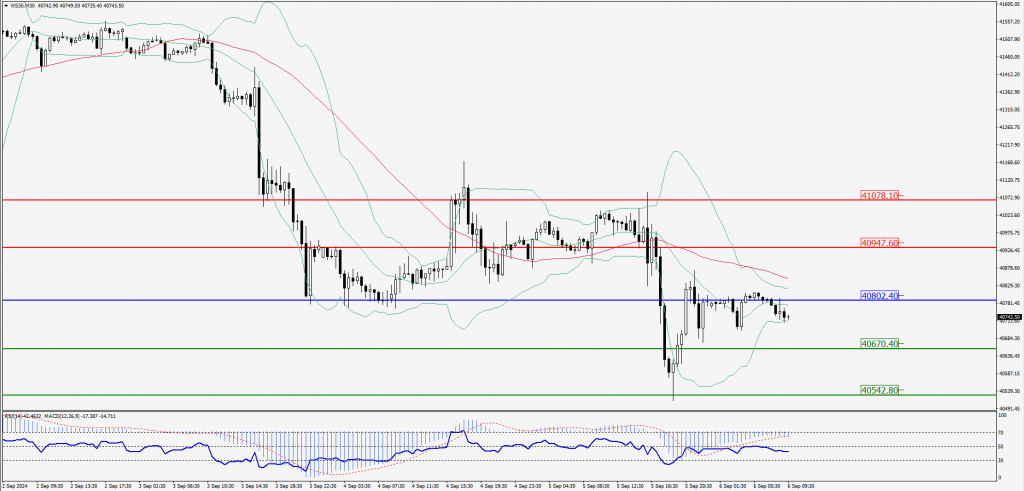
Green Lines Indicate Resistance Levels – Red Lines Indicate Support Levels
Light Blue is a Pivot Point – Black represents the price when the report was produced