Market Wrap: Stocks, Bonds, Commodities
US stocks finished slightly lower in choppy trading on Wednesday following labor market data and comments from a Federal Reserve official that bolster the case for an interest rate cut.
The Dow Jones Industrial Average rose 38.04 points to 40,974.97, the S&P 500 loss 0.16% to 5,520.07 and the Nasdaq Composite descend 50.00 points to 17,084.30.
MSCI’s index of Asia-Pacific stocks outside Japan is down 1.58% to 687.24 levels. The Australian index was higher by 0.40% to 7,982.40. Japanese Nikkei Index decrease 1.07% today.
European stocks were mixed on Thursday, with the Stoxx Europe 50 Index decrease 0.13% to 4,841.95 Germany’s DAX ascend 0.12% to 18,612.95, and France’s CAC lower 0.22% to 7,484.27 and U.K.’s FTSE 100 loss 0.02% to 8,267.75.
Benchmark 10-year U.S. Treasury fail as demand for safe assets slipped again, today 10-year bond yields 0.11% to 3.7640.
Oil was attempting to hold its line in early trade on Thursday after an overnight sell-off, as players grappled with weak demand alongside a possible delay to more supply entering the market next month.
Spot Brent crude oil increase 0.28% to $72.90 per barrel. US West Texas Intermediate crude is increase 0.27% to $69.39 a barrel.
The yellow metal gold is up 0.33% to 2,534.30 dollars per ounce.
Market Wrap: Forex
The dollar dipped on Thursday as traders ramped up bets for a supersized rate cut from the Federal Reserve later this month, with the yen a notable outperformer on safe-haven demand as concerns over the US economy’s growth outlook resurfaced.
Today, the U.S. dollar index measures the Greenback against a trade-weighted basket of six major currencies, which decrease 0.10% to 101.202.
The Euro US Dollar (EUR/USD) is a widely traded is up 0.04% today. This left the pair trading around $1.10860.
The Japanese yen was will move negative against the U.S. dollar on Thursday. Today USD/JPY is trades pair that decrease 0.20% to the 143.440 level.
Another commodity-related currency Mixed against the U.S dollar, AUD/USD loss 0.06% to 0.67200, and NZD/USD increase 0.04% to 0.62000 level.
EUR/USD Intraday: Trend on the upside
Our pivot point is at 1.10830
Preferable Price Action: Take buy positions above pivot level with targets at 1.10930 & 1.1000 in extension.
Alternative Price Action: Sell pivot looks for a further downside to 1.10740 & 1.10660.
Comment: RSI is above 50 levels and Pairs above its 20MA & 55MA.
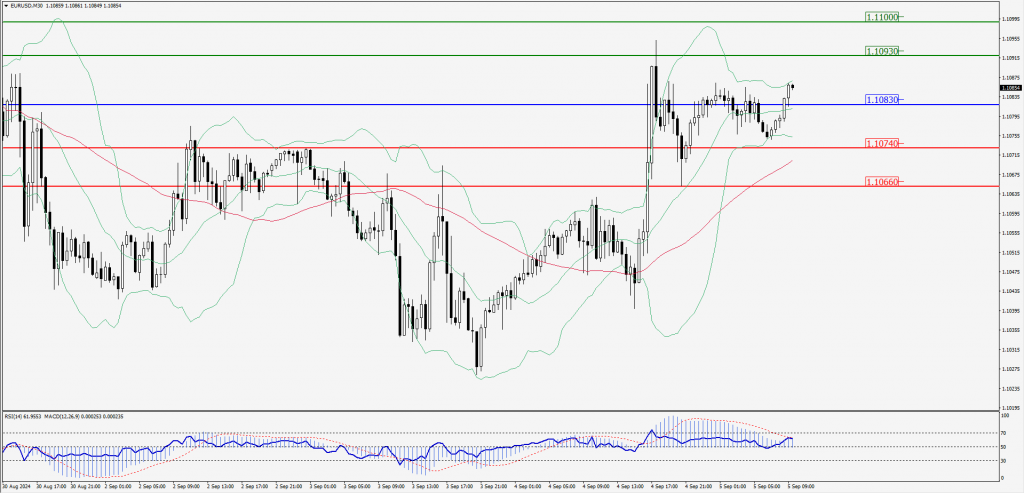
Green Lines Indicate Resistance Levels – Red Lines Indicate Support Levels
Light Blue is a Pivot Point – Black represents the price when the report was produced
GBP/USD Intraday: Trend on the upside
Our pivot point is at 1.31450
Preferable Price Action: Buy positions above pivot with targets at 1.31600 & 1.31740 in extension.
Alternative Price Action: The price below pivot would call for further downside to 1.31300 & 1.31160.
Comment: RSI is above 50 levels and Pairs above its 55MA.
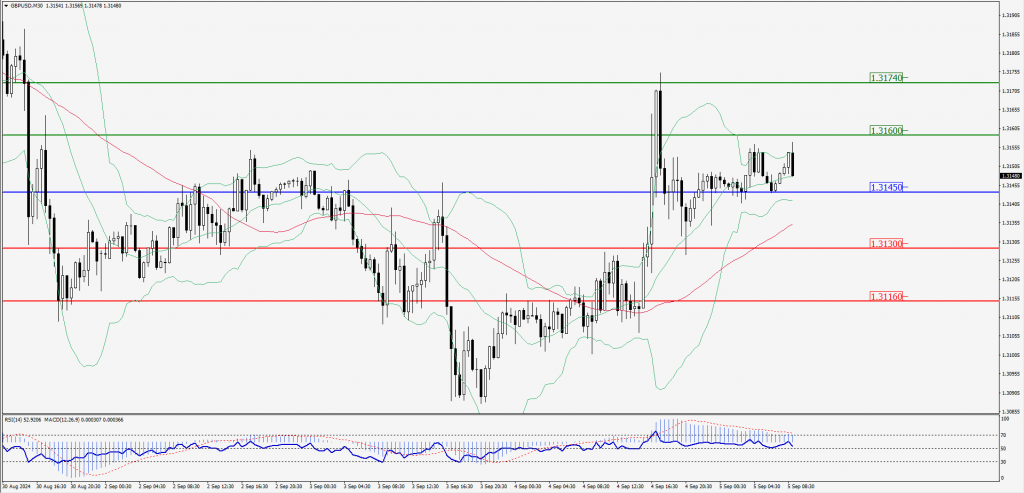
Green Lines Indicate Resistance Levels – Red Lines Indicate Support Levels
Light Blue is a Pivot Point – Black represents the price when the report was produced
USD/JPY Intraday: Trend on the downside
Our pivot point is at 143.390
Preferable Price Action: Sell position below pivot with the target at 142.710 and 142.130 in extension.
Alternative Price Action: The upside breakout of the pivot would call for 144.060 and 144.620.
Comment: MACD is below 50 levels and Pairs below its 55MA & 20MA.
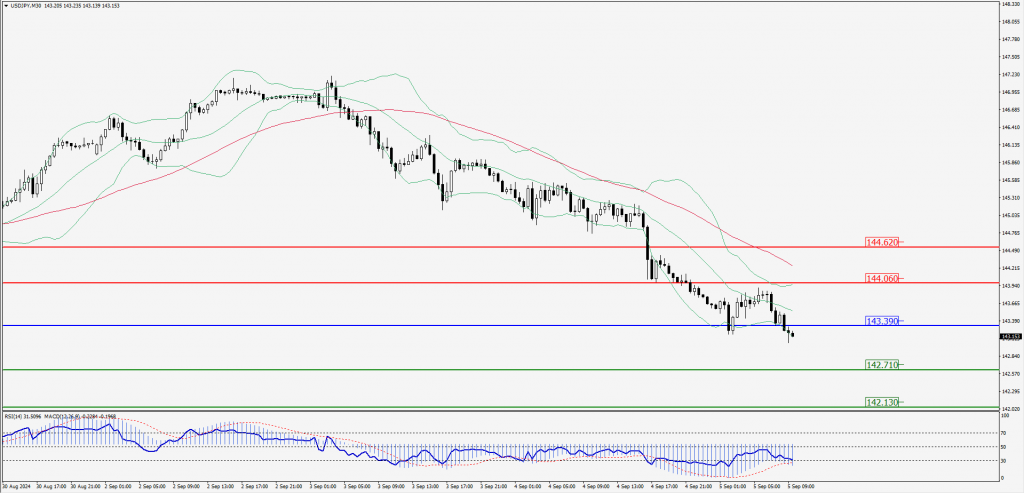
Green Lines Indicate Resistance Levels – Red Lines Indicate Support Levels
Light Blue is a Pivot Point – Black represents the price when the report was produced
AUD/USD Intraday: Trend on the upside
Our pivot point is at 0.67190
Preferable Price Action: Buy positions above pivot with targets at 0.67340 & 0.67490 in extension.
Alternative Price Action: Below pivot a further downside with 0.66040 & 0.66900 as targets.
Comment: RSI is above 50 levels and pairs above its 55MA.
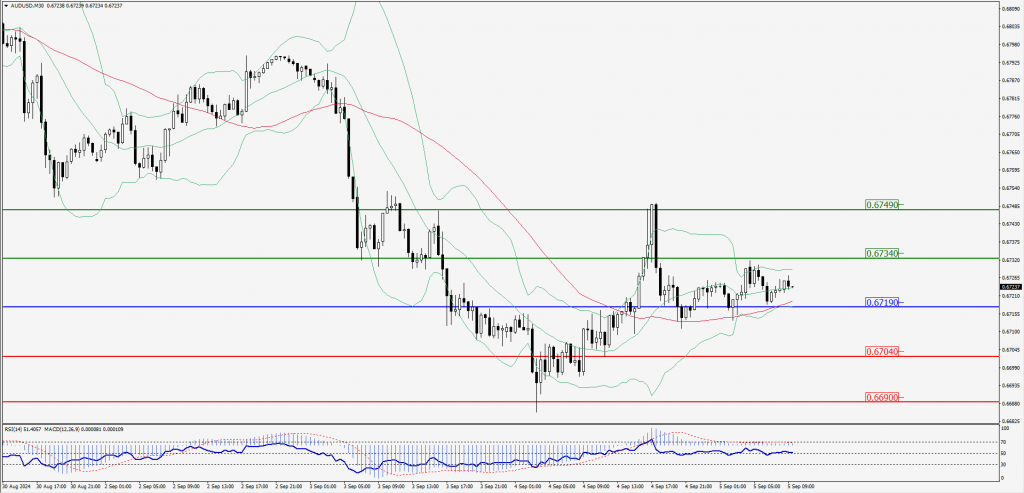
Green Lines Indicate Resistance Levels – Red Lines Indicate Support Levels
Light Blue is a Pivot Point – Black represents the price when the report was produced
CRUDEOIL Intraday: Trend on the upside
Our pivot point is at 68.87
Preferable Price Action: Above pivot buy oil with 70.08 & 71.17 as targets.
Alternative Price Action: Sell crude below pivot with targets at 67.73 and 66.67 in extension.
Comment: RSI is at above 50 levels and pairs above its 20MA.
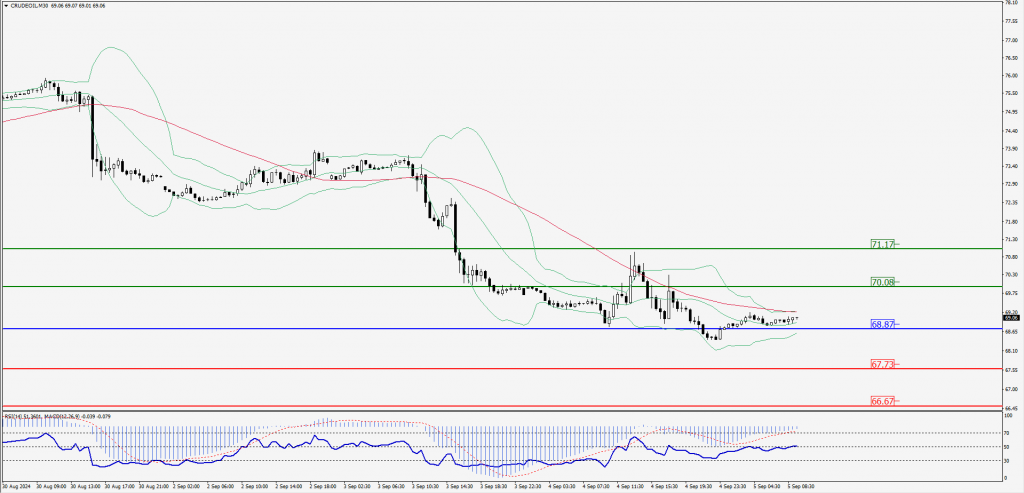
Green Lines Indicate Resistance Levels – Red Lines Indicate Support Levels
Light Blue is a Pivot Point – Black represents the price when the report was produced
XAU/USD Intraday: Major trend on the upside
Our pivot point is at 2501.80
Preferable Price Action: Further upside to 2510.10 and 2517.70.
Alternative Price Action: If the price gives an downside breakout of a pivot, then the price extends to 2493.70 and 2486.20.
Comment: MACD is above 50 levels and pairs above its 55MA & 20MA.
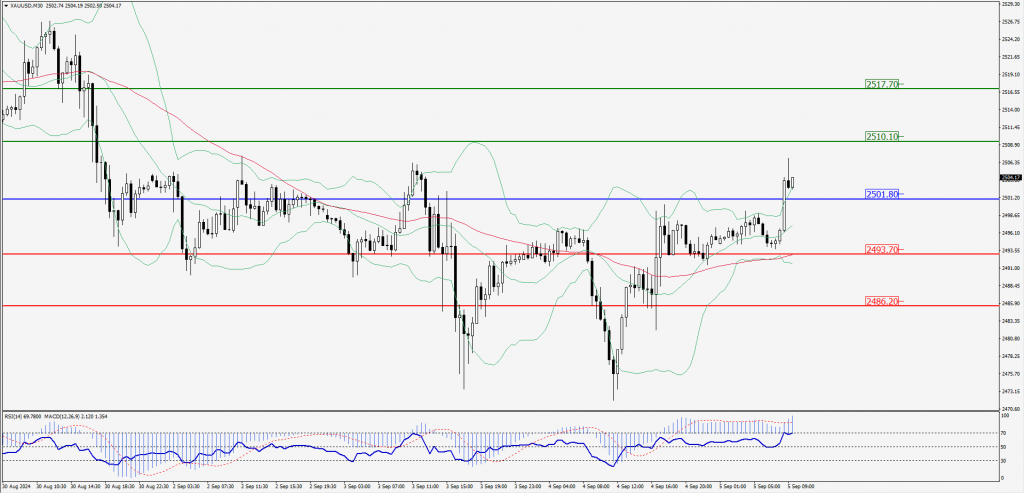
Green Lines Indicate Resistance Levels – Red Lines Indicate Support Levels
Light Blue is a Pivot Point – Black represents the price when the report was produced
Dow Jones Intraday: Trend on the downside
Our pivot point is 40,962.20
Preferable Price Action: Take sell positions below the pivot with targets at 40,870.60 & 40,774.30.
Alternative Price Action: Above 40,962.20 looks for further upside to 41,060.80 & 41,158.10.
Comment: RSI is below 50 levels and pairs below its 20MA.
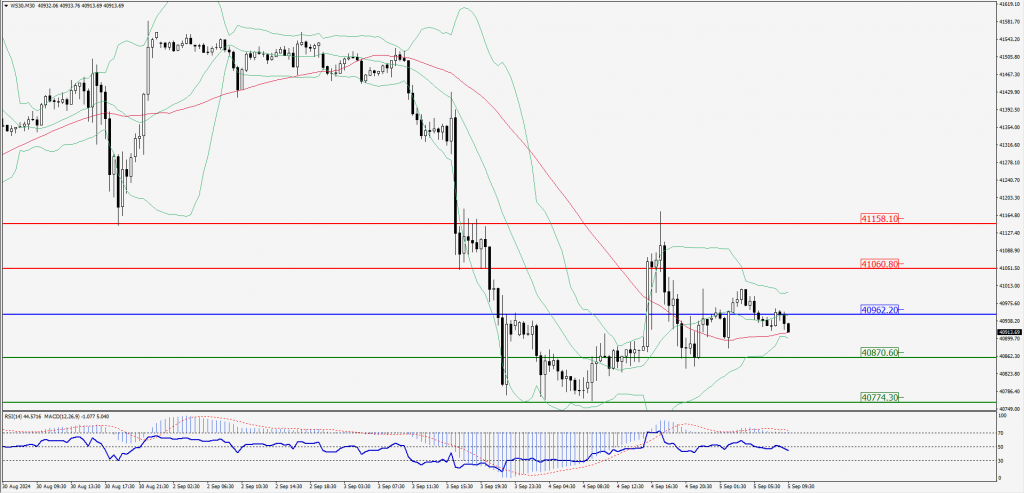
Green Lines Indicate Resistance Levels – Red Lines Indicate Support Levels
Light Blue is a Pivot Point – Black represents the price when the report was produced