Market Wrap: Stocks, Bonds, Commodities
US stock futures ticked higher on Wednesday night as all three major stock indices prepared to wrap a winning November.
The Dow Jones Industrial Average rose 13.44 points to 35,430.42, the S&P 500 lose 0.09% to 4,550.58 and the Nasdaq Composite subtract 23.27 points to 14,258.49.
MSCI’s index of Asia-Pacific stocks outside Japan is advance 0.23% to 619.87 levels. The Australian index was higher by 0.74% to 7,087.30. Japanese Nikkei Index ascend 0.43% today.
European stocks were positive on Thursday, with the Stoxx Europe 50 Index rose 0.52% to 4,370.65, Germany’s DAX ascend 1.09% to 16,166.45, and France’s CAC advance 0.24% to 7,267.63 and U.K.’s FTSE 100 subtract 0.43% to 7,423.46.
Benchmark 10-year U.S. Treasury fell as deman for safe assets ascend again, today 10-year bond yields positive 0.14% to 4.2720.
Oil prices rose on Wednesday as investors turned their attention to an OPEC+ meeting to decide on output policy, while supply disruption caused by a storm in the Black Sea and lower U.S. inventories drove buying.
Spot Brent crude oil ascend 0.28% to $83.11 per barrel. US West Texas Intermediate crude is up 0.36% to $78.14 a barrel.
The yellow metal gold is decline 0.09% to 2,045.20 dollars per ounce.
Market Wrap: Forex
The dollar climbed from more than three-month lows on Thursday after data showing the U.S. economy grew faster in the third quarter than initially reported helped investors consolidate positions following four days of losses.
Today, the U.S. dollar index measures the Greenback against a trade-weighted basket of six major currencies, which surged 0.08% to 102.757.
The Euro US Dollar (EUR/USD) is a widely traded pair that is up 0.01% today. This left the pair trading around $1.09690.
The Japanese yen was negative against the U.S. dollar on Thursday. Today USD/JPY is slipped 0.11% to the 147.070 level.
Another commodity-related currency positive against the U.S dollar, AUD/USD rose 0.38% to 0.66420, and NZD/USD surged 0.30% to 0.61720 level.
EUR/USD Intraday: Support level at 1.09730
Our pivot point is at 1.09730
Preferable Price Action: Take buy positions above pivot level with targets at 1.09930 & 1.10060 in extension.
Alternative Price Action: Below pivot looks for a further downside to 1.09560 & 1.09440.
Comment: RSI is above 50 levels and Pairs above 20MA.
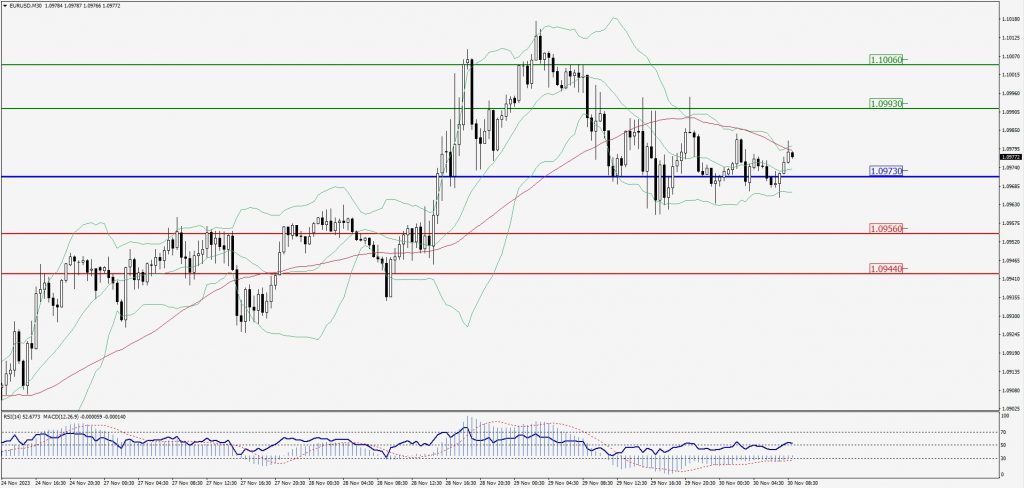
Green Lines Indicate Resistance Levels – Red Lines Indicate Support Levels
Light Blue is a Pivot Point – Black represents the price when the report was produced
GBP/USD Intraday: Trend on the upside
Our pivot point is at 1.26940
Preferable Price Action: Buy positions above pivot with targets at 1.27280 & 1.27510 in extension.
Alternative Price Action: The price below pivot would call for further downside to 1.26640 & 1.26430.
Comment: RSI is above 50 levels and Pairs above 55MA.
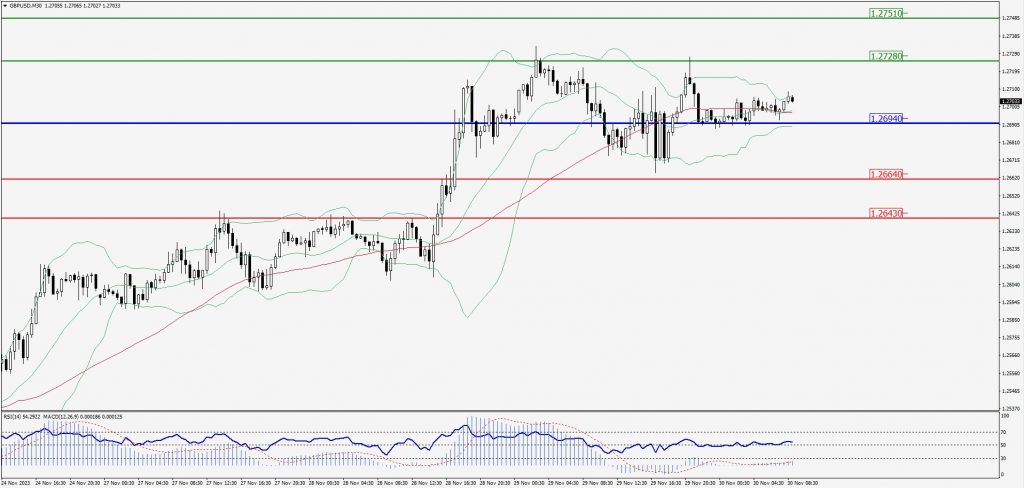
Green Lines Indicate Resistance Levels – Red Lines Indicate Support Levels
Light Blue is a Pivot Point – Black represents the price when the report was produced
USD/JPY Intraday: Trend on the downside
Our pivot point is at 147.200
Preferable Price Action: Sell position below pivot with the target at 146.620 and 146.260 in extension.
Alternative Price Action: The upside breakout of the pivot would call for 147.720 and 148.060.
Comment: MACD is below 50 level and Pairs below its 20MA & 55MA.
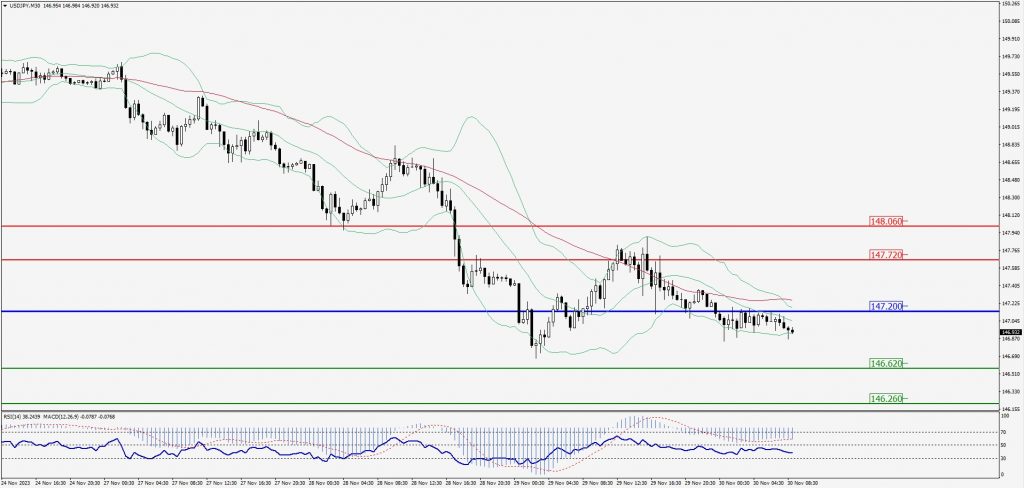
Green Lines Indicate Resistance Levels – Red Lines Indicate Support Levels
Light Blue is a Pivot Point – Black represents the price when the report was produced
AUD/USD Intraday: Trend on the upside
Our pivot point is at 0.66430
Preferable Price Action: Buy positions above pivot with targets at 0.66640 & 0.66780 in extension.
Alternative Price Action: Below pivot looks for a further downside with 0.66260 & 0.66150 as targets.
Comment: RSI is above 50 levels and Pairs above its 20MA & 55MA.
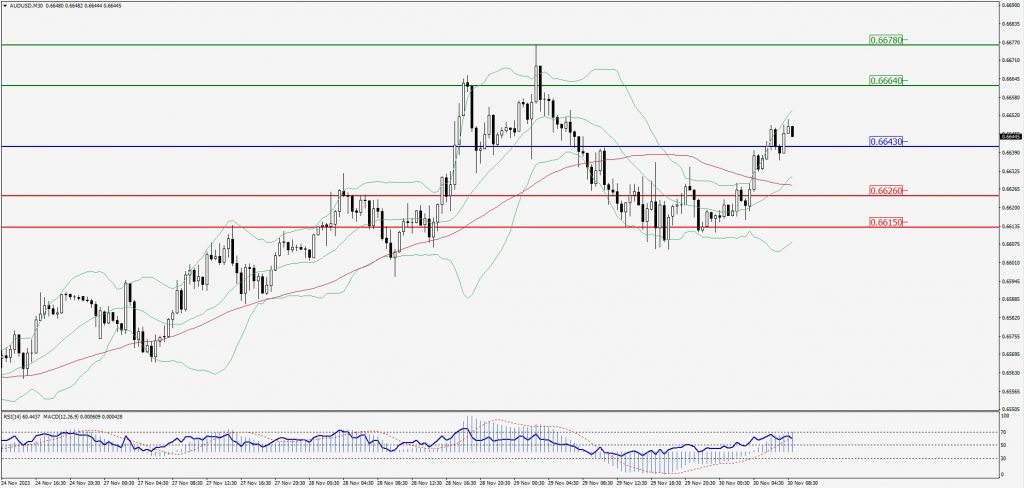
Green Lines Indicate Resistance Levels – Red Lines Indicate Support Levels
Light Blue is a Pivot Point – Black represents the price when the report was produced
CRUDEOIL Intraday: Trend on the upside
Our pivot point is at 78.06
Preferable Price Action: Above pivot buy oil with 79.01 & 79.59 as targets.
Alternative Price Action: Sell crude below pivot with targets at 77.30 and 76.77 in extension.
Comment: MACD is positive territory and Pairs above its 20MA & 55MA.
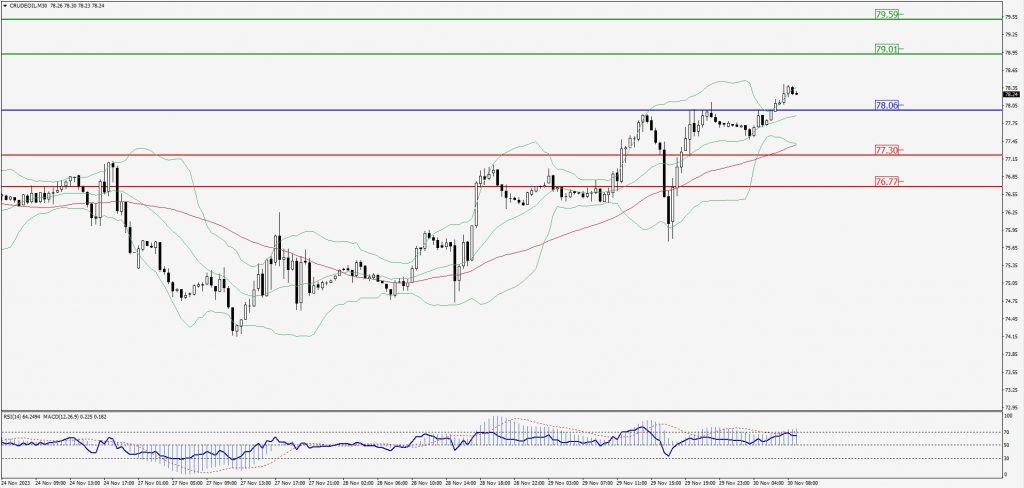
Green Lines Indicate Resistance Levels – Red Lines Indicate Support Levels
Light Blue is a Pivot Point – Black represents the price when the report was produced
XAU/USD Intraday: In a consolidation zone
Our pivot point is 2041.80
Preferable Price Action: Further upside to 2053.10 and 2060.40.
Alternative Price Action: If the price gives a downside breakout of a pivot, then the price extends to 2032.70 and 2025.20.
Comment: MACD is at 50 level and Pairs above 55MA.
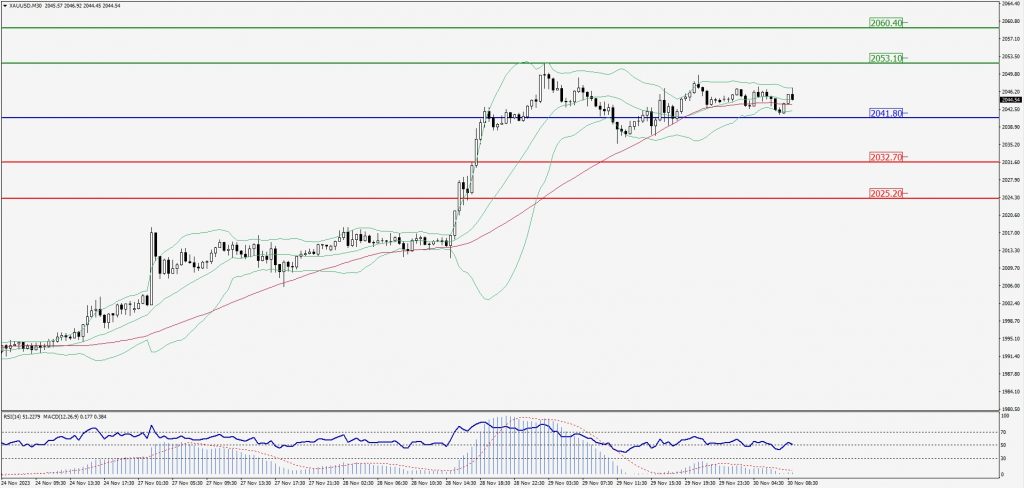
Green Lines Indicate Resistance Levels – Red Lines Indicate Support Levels
Light Blue is a Pivot Point – Black represents the price when the report was produced
Dow Jones Intraday: Trend on the upside
Our pivot point is 35,526.00
Preferable Price Action: Take buy positions above the pivot with targets at 35,586.00 & 35,625.00.
Alternative Price Action: Below 35,526.00 looks for further downside to 35,478.00 & 35,446.00.
Comment: RSI is above 50 levels and Pairs above its 20MA & 55MA.
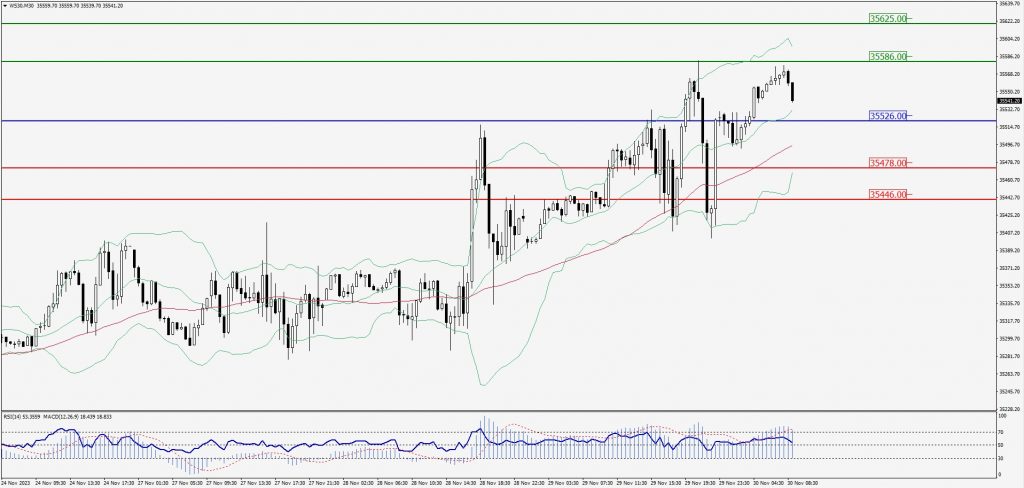
Green Lines Indicate Resistance Levels – Red Lines Indicate Support Levels
Light Blue is a Pivot Point – Black represents the price when the report was produced