Market Wrap: Stocks, Bonds, Commodities
Stocks rose Tuesday, resuming their November rally, as comments from a Federal Reserve official raised hope that the central bank may not need to raise interest rates further.
The Dow Jones Industrial Average rose 83.51 points to 35,416.98, the S&P 500 gain 0.10% to 4,554.89 and the Nasdaq Composite add 40.73 points to 14,281.76.
MSCI’s index of Asia-Pacific stocks outside Japan is decline 0.38% to 618.18 levels. The Australian index was higher by 0.29% to 7,035.30. Japanese Nikkei Index drop 0.30% today.
European stocks were positive on Wednesday, with the Stoxx Europe 50 Index rose 0.65% to 4,376.05, Germany’s DAX ascend 0.39% to 16,156.25, and France’s CAC advance 0.47% to 7,284.53 and U.K.’s FTSE 100 subtract 0.13% to 7,245.97.
Benchmark 10-year U.S. Treasury fell as deman for safe assets ascend again, today 10-year bond yields negative 0.99% to 4.2930.
Oil prices rose more than 2% on Wednesday, supported by expectations that the OPEC+ producer group may deepen and extend output cuts due to concern over softer global demand.
Spot Brent crude oil ascend 1.10% to $82.36 per barrel. US West Texas Intermediate crude is up 1.14% to $77.28 a barrel.
The yellow metal gold is decline 0.02% to 2,039.70 dollars per ounce.
Market Wrap: Forex
The U.S. dollar sank to its lowest in more than three months on Wednesday as investors continued to take the view that growth in the world’s largest economy is starting to slow down, with the market starting to price in a rate cut by the first half of the year.
Today, the U.S. dollar index measures the Greenback against a trade-weighted basket of six major currencies, which surged 0.12% to 102.775.
The Euro US Dollar (EUR/USD) is a widely traded pair that is down 0.13% today. This left the pair trading around $1.09760.
The Japanese yen was negative against the U.S. dollar on Wednesday. Today USD/JPY is surged 0.03% to the 147.530 level.
Another commodity-related currency mixed against the U.S dollar, AUD/USD fell 0.35% to 0.66250, and NZD/USD surged 0.07% to 0.61530 level.
EUR/USD Intraday: In a consolidation zone
Our pivot point is at 1.09900
Preferable Price Action: Take buy positions above pivot level with targets at 1.10190 & 1.10370 in extension.
Alternative Price Action: Below pivot looks for a further downside to 1.09680 & 1.09530.
Comment: RSI is at 50 levels and Pairs above 55MA.
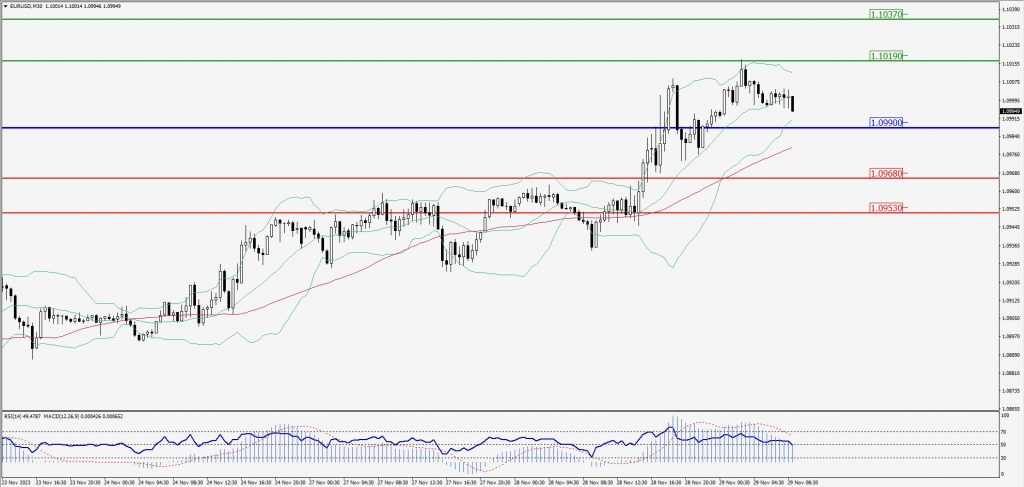
Green Lines Indicate Resistance Levels – Red Lines Indicate Support Levels
Light Blue is a Pivot Point – Black represents the price when the report was produced
GBP/USD Intraday: Support level at 1.26940
Our pivot point is at 1.26940
Preferable Price Action: Buy positions above pivot with targets at 1.27430 & 1.27770 in extension.
Alternative Price Action: The price below pivot would call for further downside to 1.26530 & 1.26240.
Comment: RSI is above 50 levels and Pairs above 55MA.
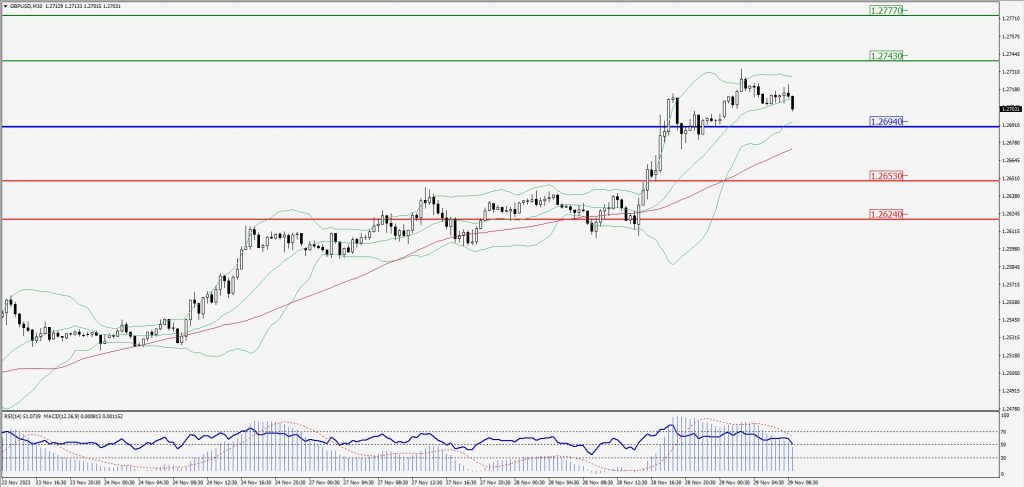
Green Lines Indicate Resistance Levels – Red Lines Indicate Support Levels
Light Blue is a Pivot Point – Black represents the price when the report was produced
USD/JPY Intraday: Trend on the downside
Our pivot point is at 147.480
Preferable Price Action: Sell position below pivot with the target at 146.840 and 146.510 in extension.
Alternative Price Action: The upside breakout of the pivot would call for 147.980 and 148.340.
Comment: MACD is below 50 level and Pairs below 55MA.
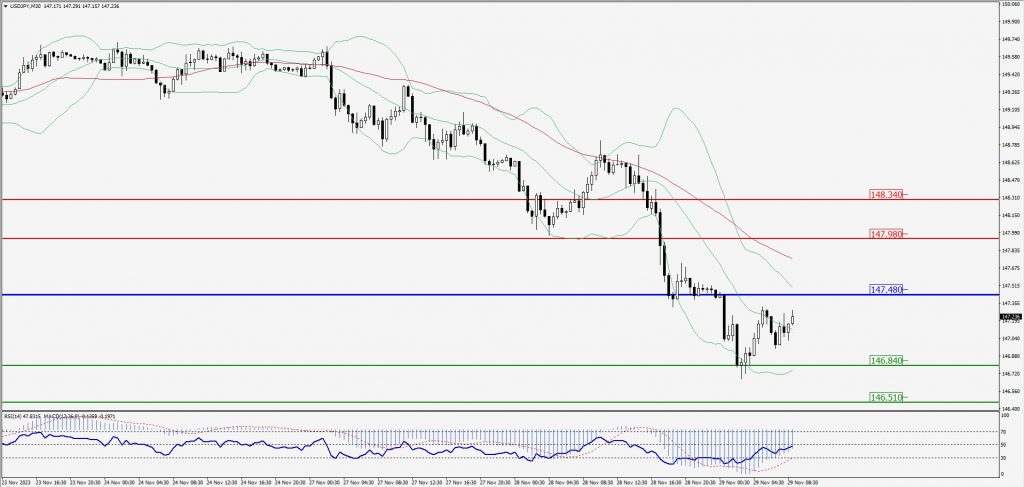
Green Lines Indicate Resistance Levels – Red Lines Indicate Support Levels
Light Blue is a Pivot Point – Black represents the price when the report was produced
AUD/USD Intraday: Trend on the downside
Our pivot point is at 0.66470
Preferable Price Action: Sell positions below pivot with targets at 0.66200 & 0.66030 in extension.
Alternative Price Action: Above pivot looks for a further upside with 0.66700 & 0.66870 as targets.
Comment: RSI is below 50 levels and Pairs below 20MA.
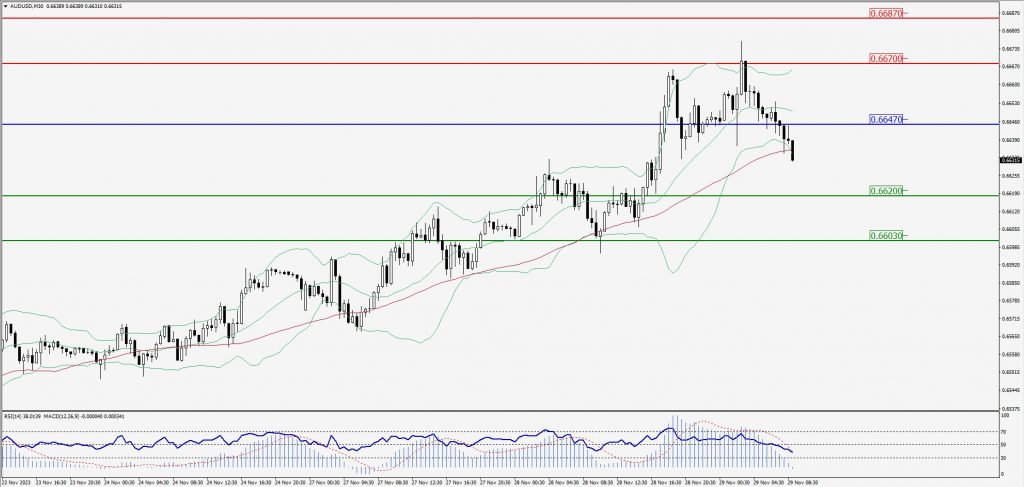
Green Lines Indicate Resistance Levels – Red Lines Indicate Support Levels
Light Blue is a Pivot Point – Black represents the price when the report was produced
CRUDEOIL Intraday: Trend on the upside
Our pivot point is at 76.52
Preferable Price Action: Above pivot buy oil with 76.92 & 77.23 as targets.
Alternative Price Action: Sell crude below pivot with targets at 76.20 and 75.96 in extension.
Comment: MACD is positive territory and Pairs above 55MA.
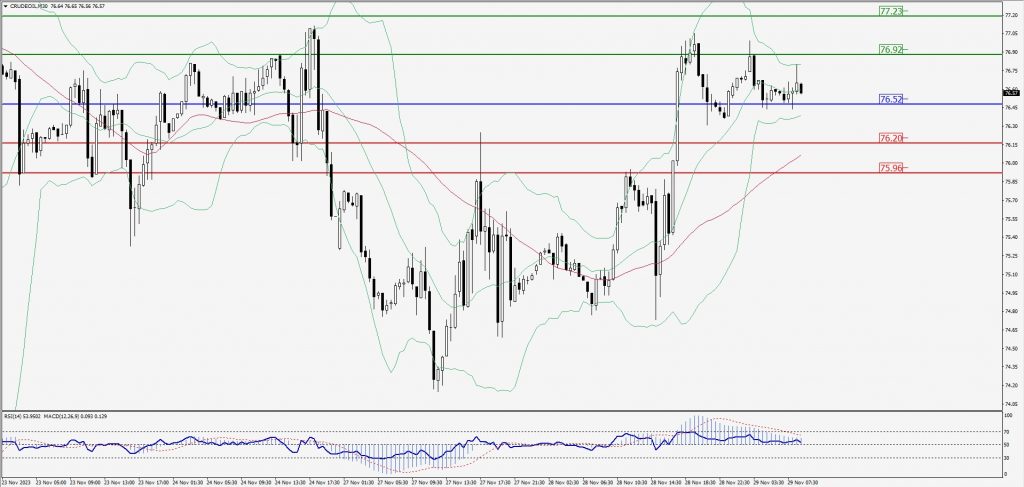
Green Lines Indicate Resistance Levels – Red Lines Indicate Support Levels
Light Blue is a Pivot Point – Black represents the price when the report was produced
XAU/USD Intraday: Trend on the upside
Our pivot point is 2041.80
Preferable Price Action: Further upside to 2053.10 and 2060.40.
Alternative Price Action: If the price gives a downside breakout of a pivot, then the price extends to 2032.70 and 2025.20.
Comment: MACD is above 50 level and Pairs above 55MA.
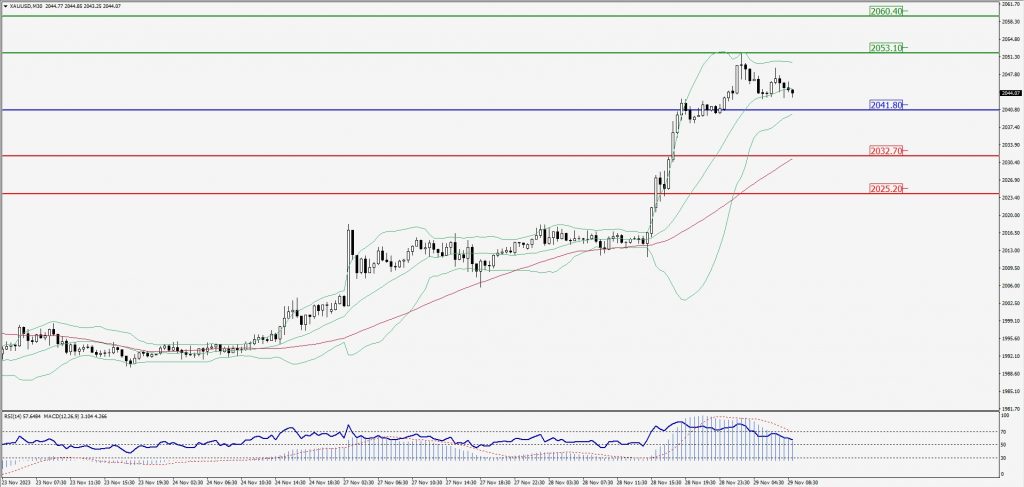
Green Lines Indicate Resistance Levels – Red Lines Indicate Support Levels
Light Blue is a Pivot Point – Black represents the price when the report was produced
Dow Jones Intraday: Trend on the upside
Our pivot point is 35,428.00
Preferable Price Action: Take buy positions above the pivot with targets at 35,480.00 & 35,518.00.
Alternative Price Action: Below 35,428.00 looks for further downside to 35,386.00 & 35,356.00.
Comment: RSI is above 50 levels and Pairs above its 20MA & 55MA.
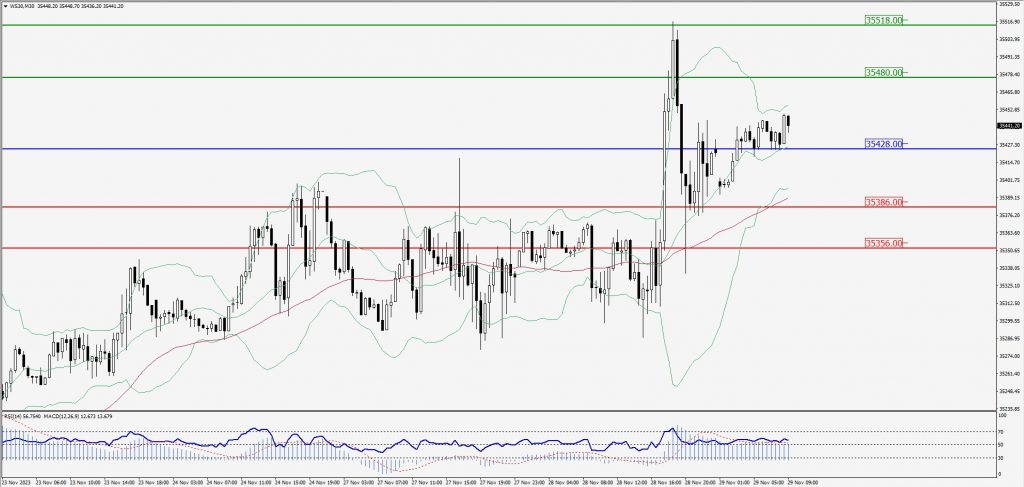
Green Lines Indicate Resistance Levels – Red Lines Indicate Support Levels
Light Blue is a Pivot Point – Black represents the price when the report was produced