Market Wrap: Stocks, Bonds, Commodities
Most Asian currencies edged higher on Friday as the dollar weakened on persistent expectations of a rate cut by the U.S. Federal Reserve in December, while the Japanese yen surged after hotter-than-expected inflation data from Tokyo.
The Dow Jones Industrial Average fail 138.25 points to 44,722.06, the S&P 500 loss 0.38% to 5,998.70 and the Nasdaq Composite down 115.10 points to 19,060.48.
MSCI’s index of Asia-Pacific stocks outside Japan is down 0.77% to 703.41 levels. The Australian index was lower by 0.10% to 8,436.20. Japanese Nikkei Index decrease 0.52% today.
European stocks were mixed on Friday, with the Stoxx Europe 50 Index decrease 0.07% to 4,755.15 Germany’s DAX descend 0.01% to 19.422.25, and France’s CAC higher 0.04% to 7,181.97 and U.K.’s FTSE 100 loss 0.01% to 8,280.21.
Benchmark 10-year U.S. Treasury fail as demand for safe assets slipped again, today 10-year bond yields 0.16% to 4.2510.
Oil prices rose slightly on Friday following a potential renewal of supply risk as Israel and Hezbollah traded accusations of ceasefire violations, and as a delay to an OPEC+ meeting left investors awaiting a decision on its output policy.
Spot Brent crude oil decrease 0.23% to $72.61 per barrel. US West Texas Intermediate crude is increase 0.23% to $68.88 a barrel.
The yellow metal gold is up 0.65% to 2,682.09 dollars per ounce.
Market Wrap: Forex
The Japanese yen hit its strongest level against the dollar in just over a month on Friday as higher-than-expected inflation data from Tokyo reinforced expectations for a December rate hike by the Bank of Japan.
Today, the U.S. dollar index measures the Greenback against a trade-weighted basket of six major currencies, which either descend 0.15% to 105.887.
The Euro US Dollar (EUR/USD) is a widely traded is up 0.15% today. This left the pair trading around $1.05690.
The Japanese yen was will move negative against the U.S. dollar on Friday. Today USD/JPY is trades pair that decrease 0.91% to the 150.16 level.
Another commodity-related currency positive against the U.S dollar, AUD/USD gain 0.19% to 0.65120, and NZD/USD increase 0.45% to 0.59150 level.
EUR/USD Intraday: Trend on the upside
Our pivot point is at 1.05740
Preferable Price Action: Take buy positions above pivot level with targets at 1.05990 & 1.06180 in extension.
Alternative Price Action: Sell pivot looks for a further downside to 1.05500 & 1.05290.
Comment: RSI is above 50 levels and pairs above its 20MA & 55MA.
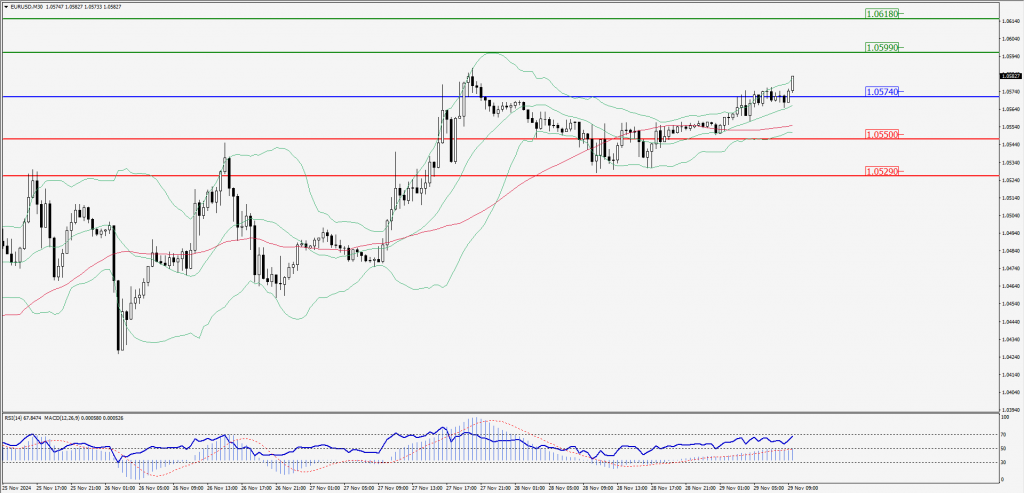
Green Lines Indicate Resistance Levels – Red Lines Indicate Support Levels
Light Blue is a Pivot Point – Black represents the price when the report was produced
GBP/USD Intraday: Major trend on the upside
Our pivot point is at 1.27180
Preferable Price Action: Buy positions above pivot with targets at 1.27570 & 1.27850 in extension.
Alternative Price Action: The price below pivot would call for further downside to 1.26810 & 1.26480.
Comment: RSI is above 50 levels and pairs above its 20MA & 55MA.
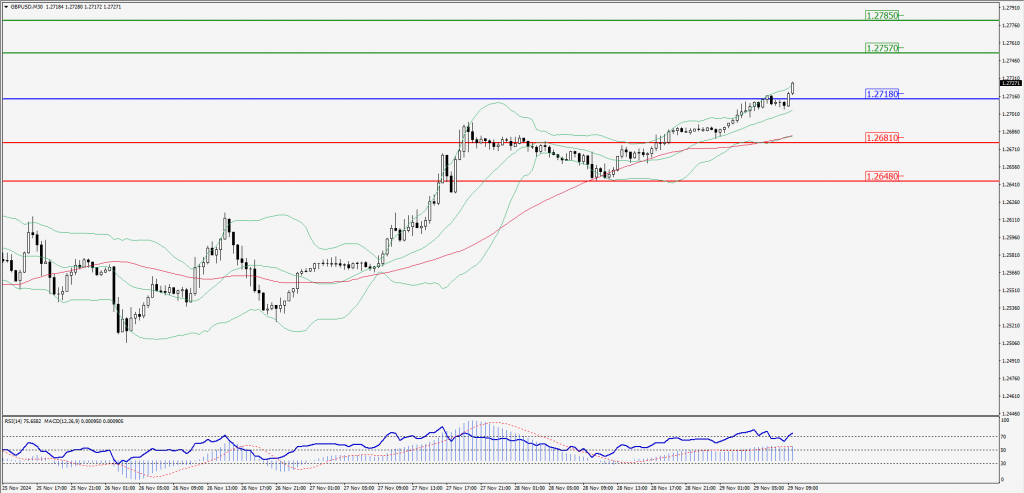
Green Lines Indicate Resistance Levels – Red Lines Indicate Support Levels
Light Blue is a Pivot Point – Black represents the price when the report was produced
USD/JPY Intraday: Major trend on the downside
Our pivot point is at 150.090
Preferable Price Action: Sell position below pivot with the target at 149.340 and 148.650 in extension.
Alternative Price Action: The upside breakout of the pivot would call for 150.890 and 151.640.
Comment: MACD is below 50 levels and pairs below its 20MA & 55MA.
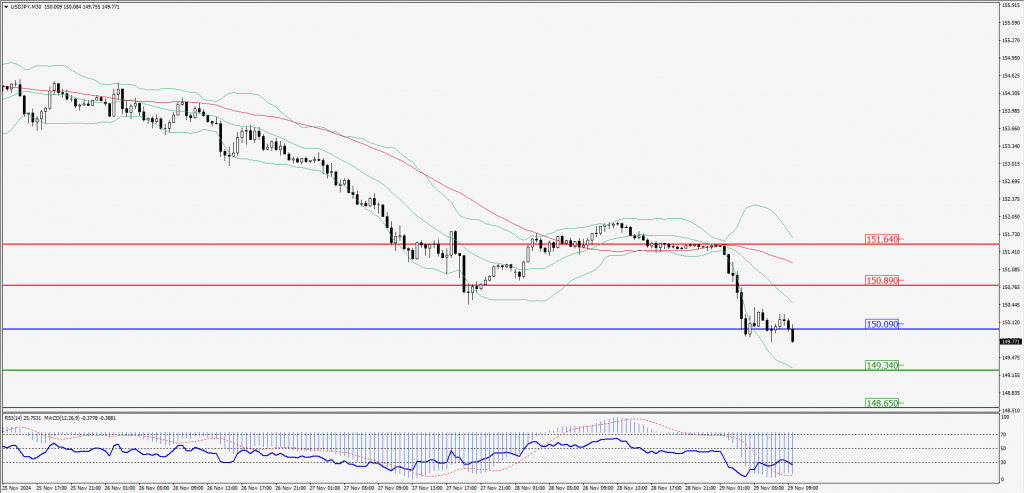
Green Lines Indicate Resistance Levels – Red Lines Indicate Support Levels
Light Blue is a Pivot Point – Black represents the price when the report was produced
AUD/USD Intraday: Trend on the upside
Our pivot point is at 0.65180
Preferable Price Action: Buy positions above pivot with targets at 0.65300 & 0.65410 in extension.
Alternative Price Action: Below pivot a further downside with 0.65050 & 0.64930 as targets.
Comment: RSI is above 50 levels and pairs above its 55MA & 20MA.
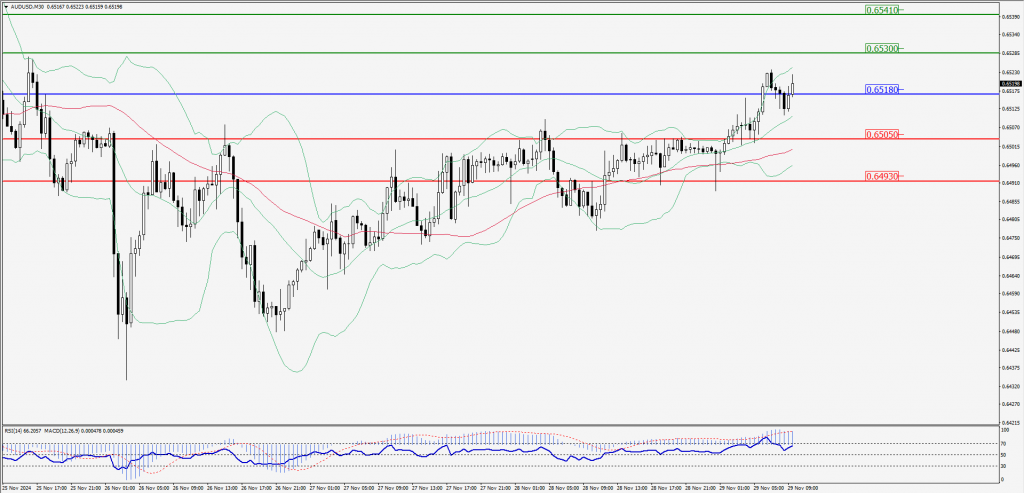
Green Lines Indicate Resistance Levels – Red Lines Indicate Support Levels
Light Blue is a Pivot Point – Black represents the price when the report was produced
CRUDEOIL Intraday: Trend on the downside
Our pivot point is at 68.89
Preferable Price Action: Below pivot sell oil with 68.49 & 68.14 as targets.
Alternative Price Action: Buy crude above pivot with targets at 69.28 & 69.65 in extension.
Comment: RSI is at below 50 levels and pairs below its 20MA.
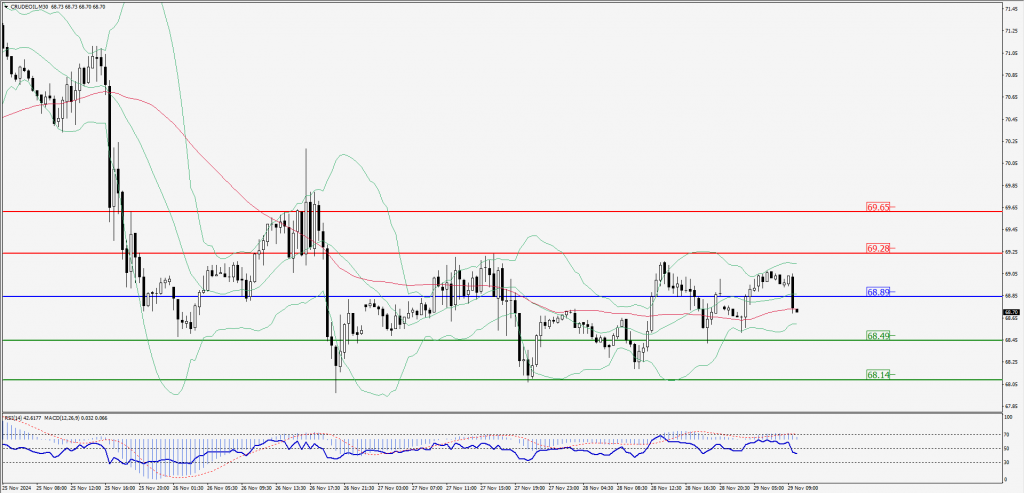
Green Lines Indicate Resistance Levels – Red Lines Indicate Support Levels
Light Blue is a Pivot Point – Black represents the price when the report was produced
XAU/USD Intraday: Major trend on the upside
Our pivot point is at 2660.10
Preferable Price Action: Further upside to 2672.40 and 2682.90.
Alternative Price Action: If the price gives an downside breakout of a pivot, then the price extends to 2648.30 and 2638.00.
Comment: MACD is above 50 levels and pairs above its 20MA.
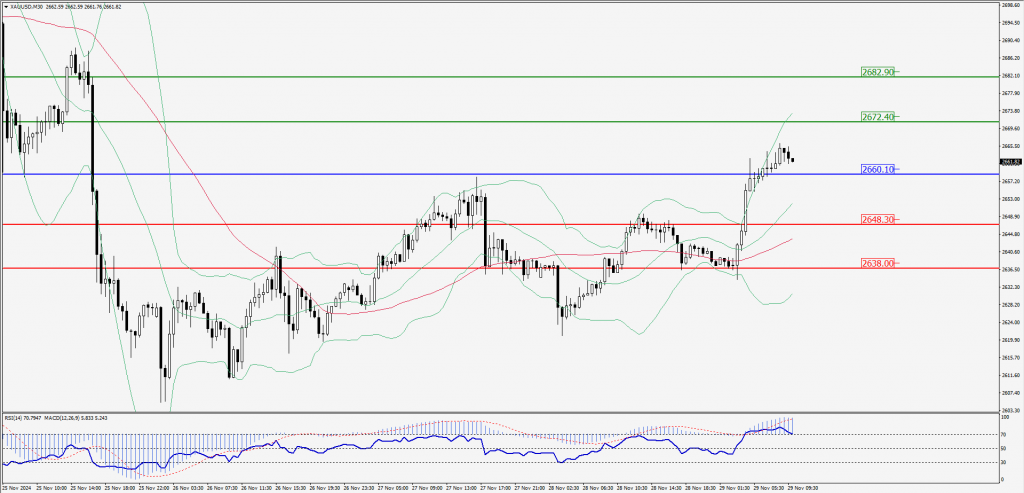
Green Lines Indicate Resistance Levels – Red Lines Indicate Support Levels
Light Blue is a Pivot Point – Black represents the price when the report was produced
Dow Jones Intraday: Trend on the downside
Our pivot point is 44,862.00
Preferable Price Action: Take sell positions below the pivot with targets at 44,790.30 & 44,724.40.
Alternative Price Action: Below 44,862.00 looks for further upside to 44,933.70 & 44,994.60.
Comment: RSI is below 50 levels and pairs below its 20MA.
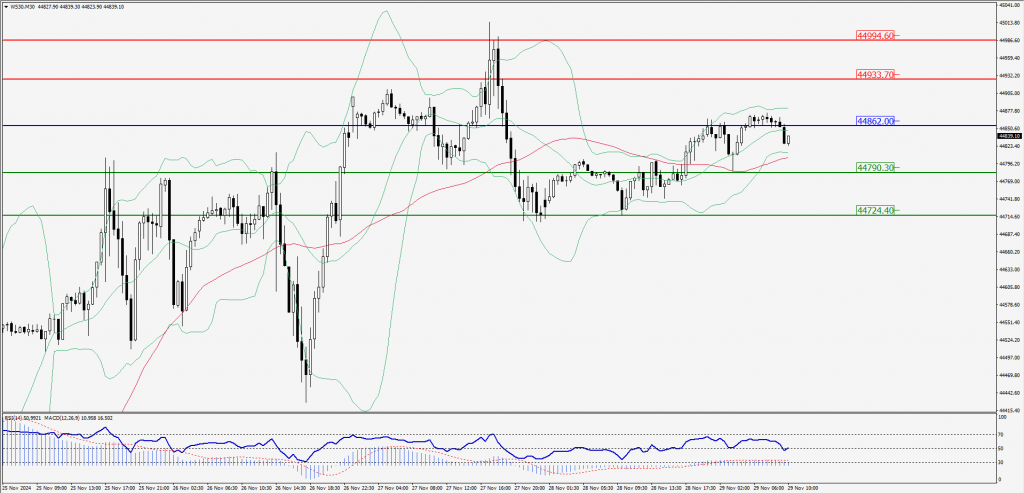
Green Lines Indicate Resistance Levels – Red Lines Indicate Support Levels
Light Blue is a Pivot Point – Black represents the price when the report was produced