Market Wrap: Stocks, Bonds, Commodities
The Chinese yuan hit a four-month low against a rallying dollar on Monday as Asian currencies fell sharply on U.S. President-elect Donald Trump’s latest threat to impose hefty tariffs on BRICS nations.
The Dow Jones Industrial Average rose 188.59 points to 44,910.65, the S&P 500 gain 0.56% to 6,032.40 and the Nasdaq Composite up 157.69 points to 19,218.17.
MSCI’s index of Asia-Pacific stocks outside Japan is up 0.68% to 708.80 levels. The Australian index was higher by 0.14% to 8,447.90. Japanese Nikkei Index increase 0.92% today.
European stocks were negative on Monday, with the Stoxx Europe 50 Index decrease 0.59% to 4,775.95 Germany’s DAX descend 0.02% to 19,625.05, and France’s CAC lower 0.83% to 7,174.98 and U.K.’s FTSE 100 loss 0.09% to 8,280.00.
Benchmark 10-year U.S. Treasury rose as demand for safe assets slipped again, today 10-year bond yields 0.24% to 4.1990.
Oil prices rose on Monday, supported by upbeat factory activity in China, the world’s second largest oil consumer, and as Israel resumed attacks on Lebanon despite a ceasefire pact, stoking tension in the Middle East.
Spot Brent crude oil increase 0.24% to $72.39 per barrel. US West Texas Intermediate crude is increase 0.82% to $68.56 a barrel.
The yellow metal gold is down 1.01% to 2,654.04 dollars per ounce.
Market Wrap: Forex
The dollar pushed higher again on Monday in what is shaping up to be a critical week for the prospect of U.S. rate cuts, while drawing verbal support from U.S. President-elect Donald Trump.
Today, the U.S. dollar index measures the Greenback against a trade-weighted basket of six major currencies, which either ascend 0.48% to 106.335.
The Euro US Dollar (EUR/USD) is a widely traded is down 0.64% today. This left the pair trading around $1.05070.
The Japanese yen was will move positive against the U.S. dollar on Monday. Today USD/JPY is trades pair that increase 0.29% to the 150.18 level.
Another commodity-related currency negative against the U.S dollar, AUD/USD loss 0.18% to 0.64980, and NZD/USD decrease 0.25% to 0.59000 level.
EUR/USD Intraday: Trend on the downside
Our pivot point is at 1.05410
Preferable Price Action: Take sell positions below pivot level with targets at 1.05240 & 1.05080 in extension.
Alternative Price Action: Buy pivot looks for a further upside to 1.05580 & 1.05740.
Comment: RSI is below 50 levels and pairs below its 20MA & 55MA.
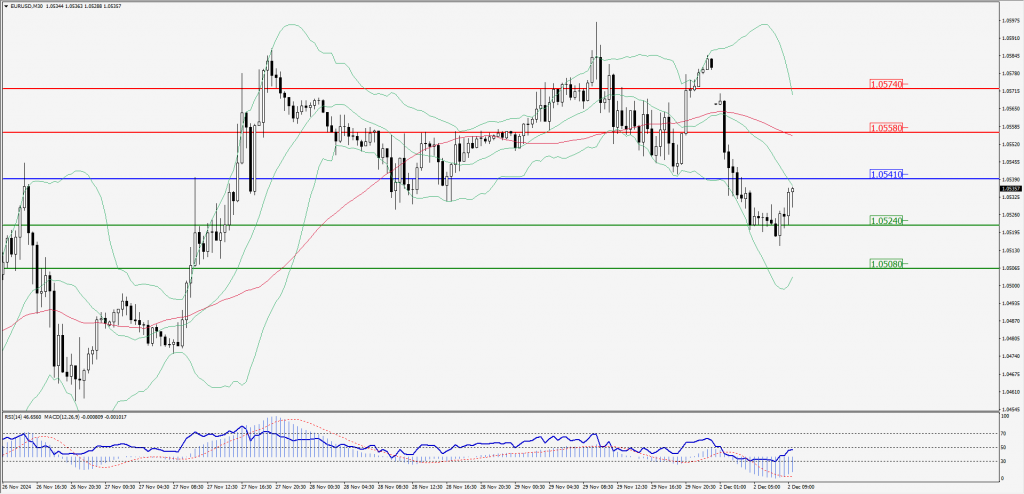
Green Lines Indicate Resistance Levels – Red Lines Indicate Support Levels
Light Blue is a Pivot Point – Black represents the price when the report was produced
GBP/USD Intraday: Trend on the upside
Our pivot point is at 1.26980
Preferable Price Action: Buy positions above pivot with targets at 1.27240 & 1.27490 in extension.
Alternative Price Action: The price below pivot would call for further downside to 1.26700 & 1.26460.
Comment: RSI is above 50 levels and pairs above its 20MA.
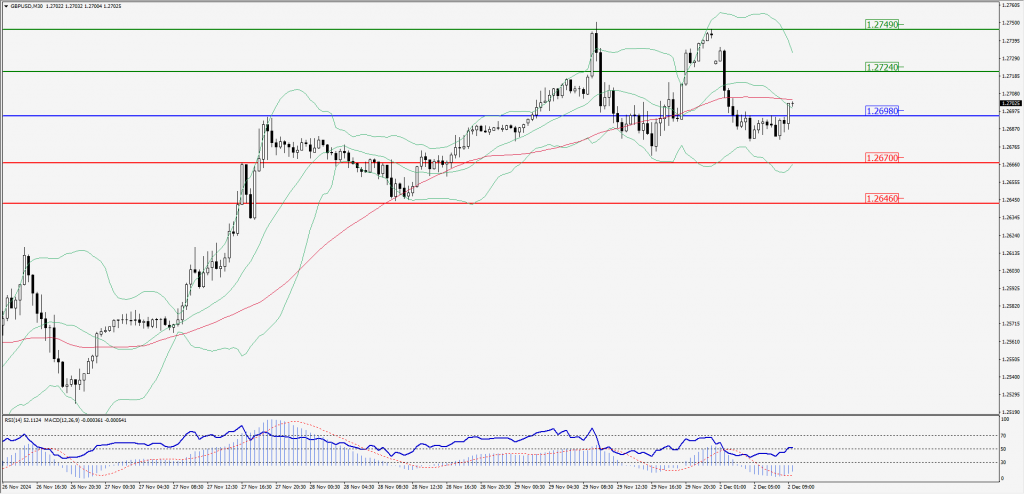
Green Lines Indicate Resistance Levels – Red Lines Indicate Support Levels
Light Blue is a Pivot Point – Black represents the price when the report was produced
USD/JPY Intraday: Trend on the downside
Our pivot point is at 150.450
Preferable Price Action: Sell position below pivot with the target at 149.890 and 149.380 in extension.
Alternative Price Action: The upside breakout of the pivot would call for 151.010 and 151.490.
Comment: MACD is below 50 levels and pairs below its 55MA.
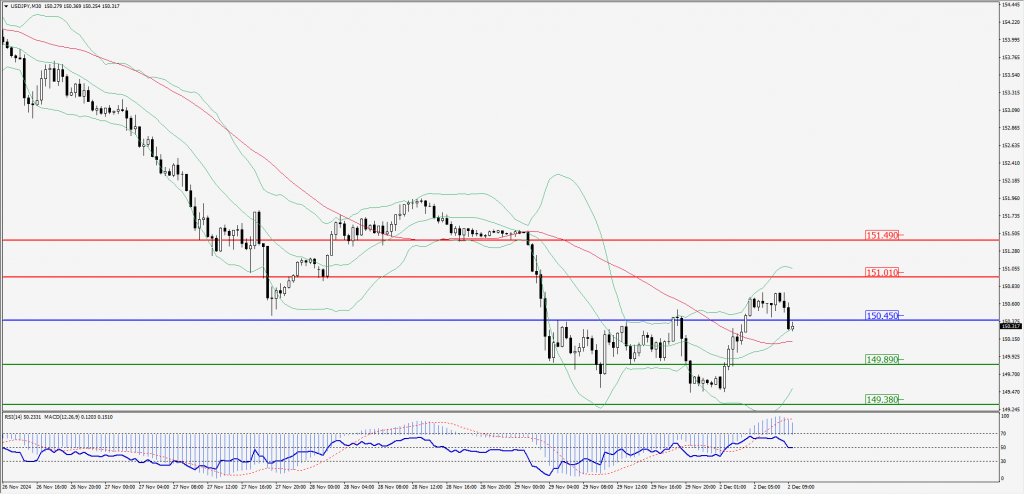
Green Lines Indicate Resistance Levels – Red Lines Indicate Support Levels
Light Blue is a Pivot Point – Black represents the price when the report was produced
AUD/USD Intraday: Support level at 0.65040
Our pivot point is at 0.65040
Preferable Price Action: Buy positions above pivot with targets at 0.65140 & 0.65220 in extension.
Alternative Price Action: Below pivot a further downside with 0.64940 & 0.64860 as targets.
Comment: RSI is above 50 levels and pairs above its 20MA.
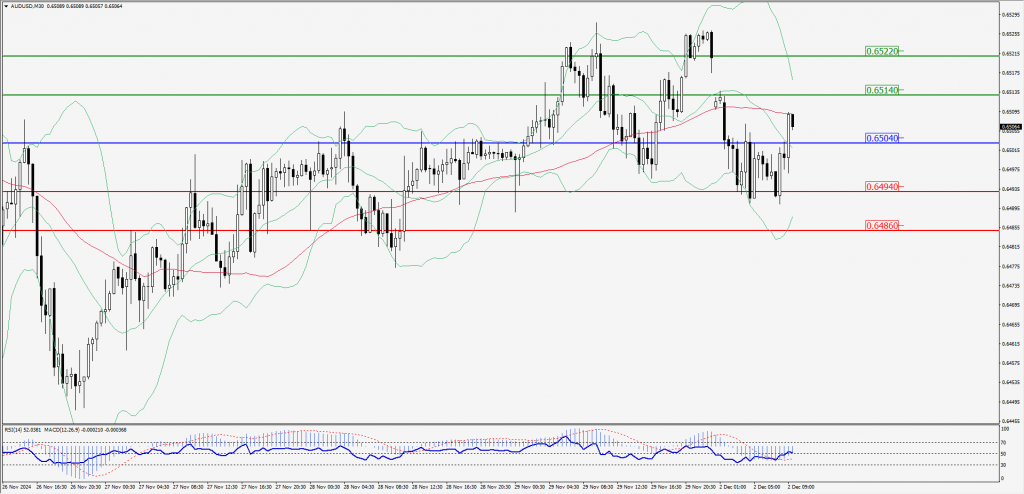
Green Lines Indicate Resistance Levels – Red Lines Indicate Support Levels
Light Blue is a Pivot Point – Black represents the price when the report was produced
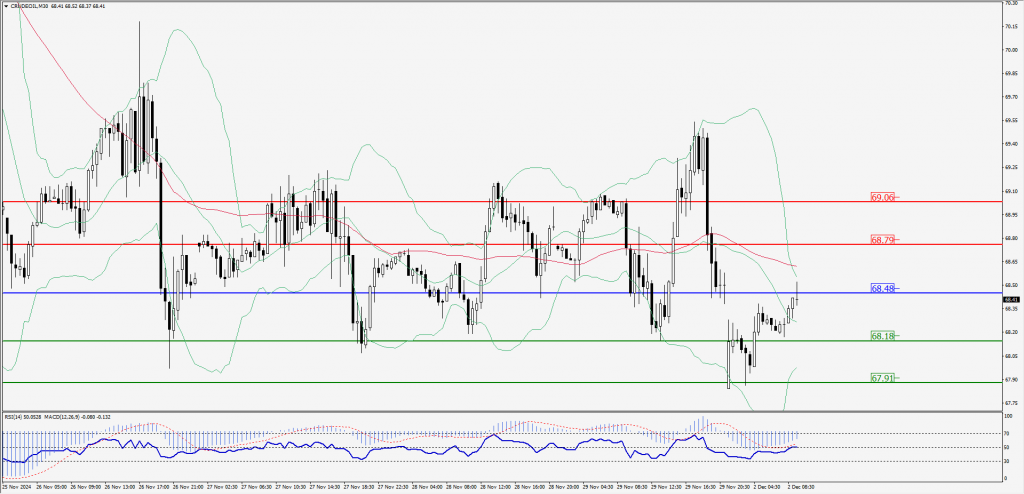
CRUDEOIL Intraday: Trend on the downside
Our pivot point is at 68.45
Preferable Price Action: Below pivot sell oil with 68.18 & 67.91 as targets.
Alternative Price Action: Buy crude above pivot with targets at 68.79 & 69.06 in extension.
Comment: RSI is at below 50 levels and pairs below its 20MA.
Green Lines Indicate Resistance Levels – Red Lines Indicate Support Levels
Light Blue is a Pivot Point – Black represents the price when the report was produced
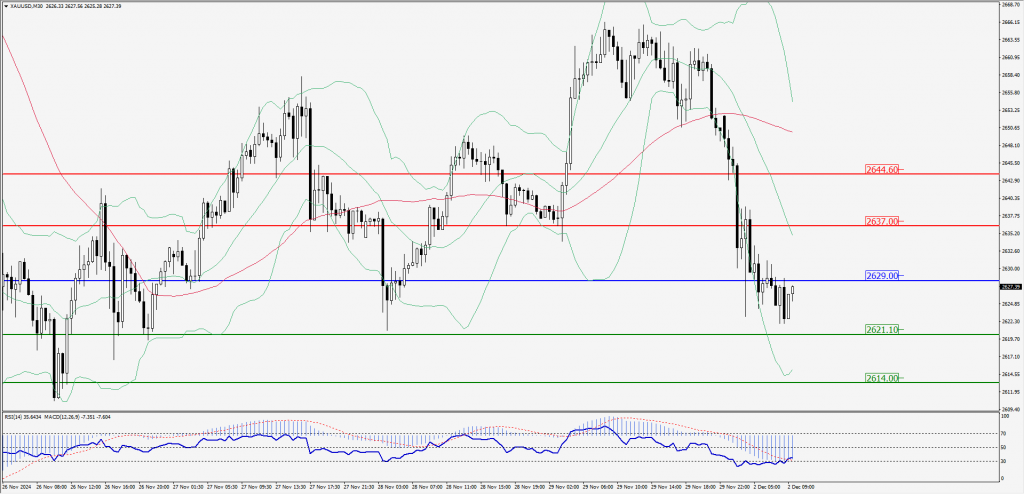
XAU/USD Intraday: Trend on the downside
Our pivot point is at 2629.00
Preferable Price Action: Further downside to 2621.10 and 2614.00.
Alternative Price Action: If the price gives an upside breakout of a pivot, then the price extends to 2637.00 and 2644.60.
Comment: MACD is below 50 levels and pairs below its 20MA & 55MA.
Green Lines Indicate Resistance Levels – Red Lines Indicate Support Levels
Light Blue is a Pivot Point – Black represents the price when the report was produced
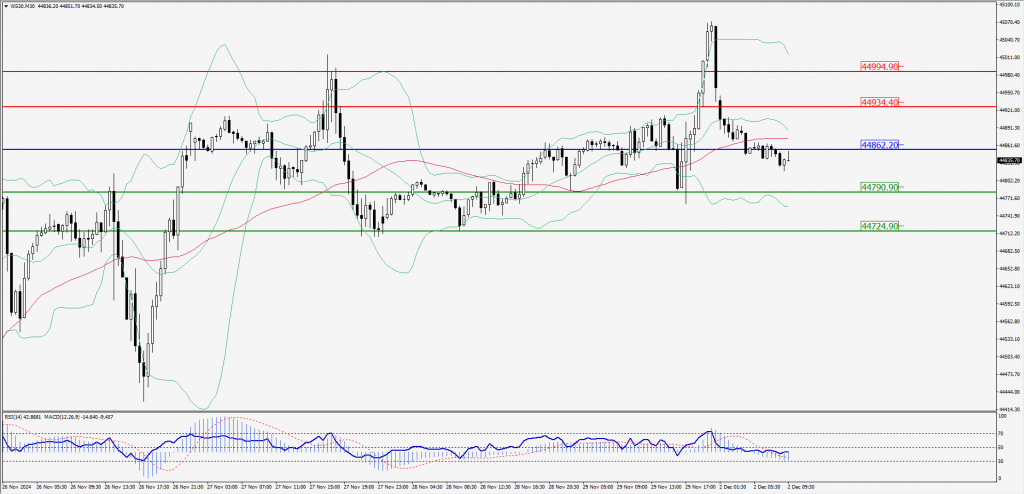
Dow Jones Intraday: Trend on the downside
Our pivot point is 44,862.20
Preferable Price Action: Take sell positions below the pivot with targets at 44,790.90 & 44,724.90.
Alternative Price Action: Below 44,862.20 looks for further upside to 44,934.40 & 44,994.90.
Comment: RSI is below 50 levels and pairs below its 20MA & 55MA.
Green Lines Indicate Resistance Levels – Red Lines Indicate Support Levels
Light Blue is a Pivot Point – Black represents the price when the report was produced