Market Wrap: Stocks, Bonds, Commodities
Wall Street ended sharply higher on Thursday after a strong quarterly report from Meta Platforms lifted beaten-down technology and growth stocks and offset worries about the US economy’s contraction in the first quarter.
The S&P 500 gain (2.47%) ended at 4,287.50 points, while the Nasdaq Composite up 3.06% to 12,871.53. The Dow Jones Industrial was rose 1.85% to 33,916.39.
MSCI’s index of Asia-Pacific stocks outside Japan is ascend 2.62% to 687.59 levels. Australian index higher 1.06% to 7,435.20. Japanese Nikkei Index surge 1.75% to 26,847.90.
European stocks were positive on Friday, with the Stoxx Europe 50 Index gain 1.32% to 3,827.85, Germany’s DAX ascend 1.24% to 14,156.80, and France’s CAC up 1.23% to 6,589.43, and U.K.’s FTSE 100 decrease 0.39% to 7,540.27.
Benchmark 10-year U.S. Treasury fell as demand for safe assets ascend again, today 10-year bond yields Negative 2.8370.
Oil edged lower on Friday as China’s COVID-19 lockdowns weighed on the outlook for crude demand, although supply disruption fears as Western sanctions curb crude and products exports from Russia underpinned prices.
Spot Brent crude oil fell 1.07% to $108.41 per barrel. US West Texas Intermediate crude is up 0.68% to $106.05 a barrel.
The yellow metal gold is advance 1.35% to 1,915.15 dollars per ounce.
Market Wrap: Forex
The dollar edged down from its recent 20-year high on Friday but was still on track for its best month since 2015, having been boosted by a combination of expectations for U.S. rate hikes and growth concerns in China and Europe.
Today, the U.S. dollar index measures the Greenback against a trade-weighted basket of six major currencies, which is a fell of 0.68% to 102.950.
The Euro US Dollar (EUR/USD) is a widely traded pair that is up 0.70% today. This left the pair trading around $1.05650.
The Japanese yen was positive against the U.S. dollar on Friday as the stock up. Today USD/JPY is fell 0.72% to 129.890 level.
Another commodity-related currency positivie against the U.S dollar, AUD/USD ascend 0.92 to 0.71580, and NZD/USD higher 0.65% to 0.65310 level.
EUR/USD Intraday: In a Consolidation Zone
Our pivot point is at 1.05270
Preferable Price Action: Take Buy positions above pivot level with targets at 1.05950 & 1.06440 in extension.
Alternative Price Action: Below pivot looks for a further downside to 1.04530 & 1.04090.
Comment: RSI above 50 levels and Pair above its 20MA & 55MA.
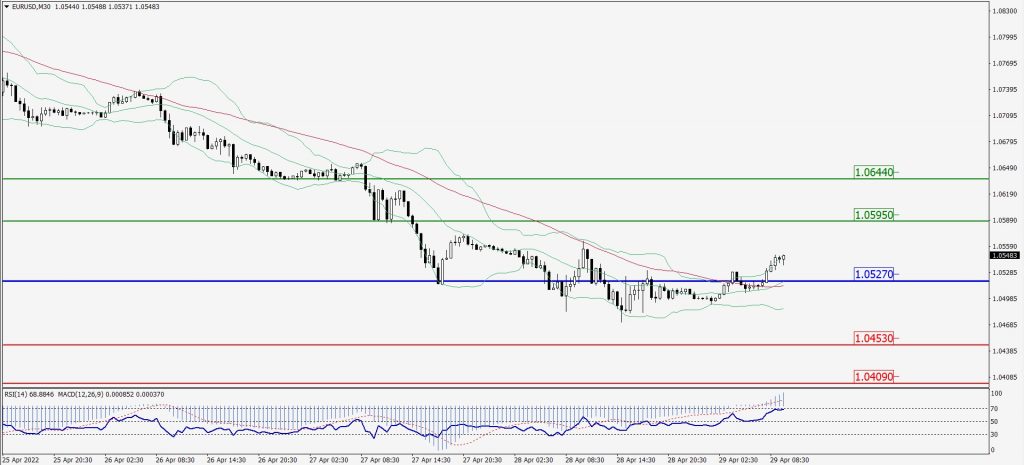
Green Lines Indicate Resistance Levels – Red Lines Indicate Support Levels
Light Blue is a Pivot Point – Black represents the price when the report was produced
GBP/USD Intraday: In a Consolidation Zone
Our pivot point is at 1.24980
Preferable Price Action: Buy positions above pivot with targets at 1.26770 & 1.28300 in extension.
Alternative Price Action: The price below pivot would call for further downside to 1.23240 & 1.21880.
Comment: RSI above 50 levels and Pair above 20MA.
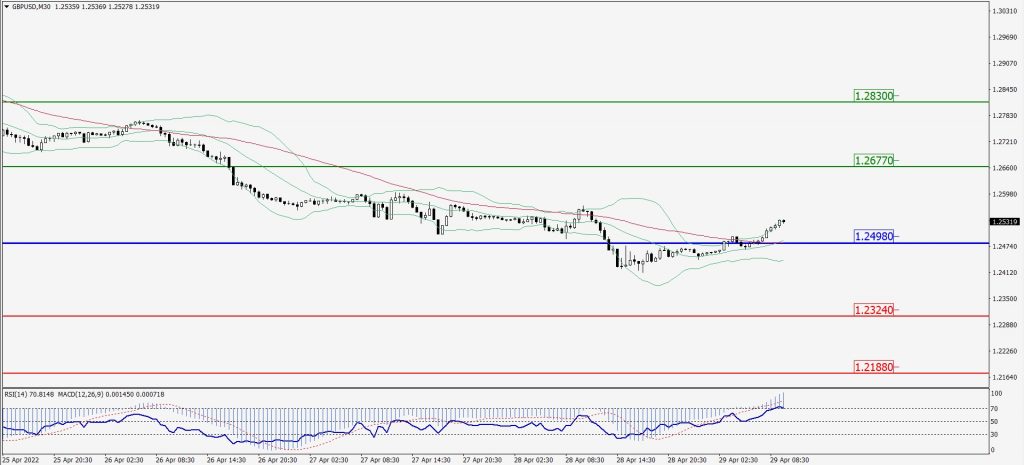
Green Lines Indicate Resistance Levels – Red Lines Indicate Support Levels
Light Blue is a Pivot Point – Black represents the price when the report was produced
USD/JPY Intraday: Trend on The Downside
Our pivot point is at 130.900
Preferable Price Action: Sell position below pivot with the target at 129.270 and 127.930 in extension.
Alternative Price Action: The upside breakout of the pivot would call for 132.530 and 133.620.
Comment: MACD in negative territory and Pair below its 20MA & 55MA.
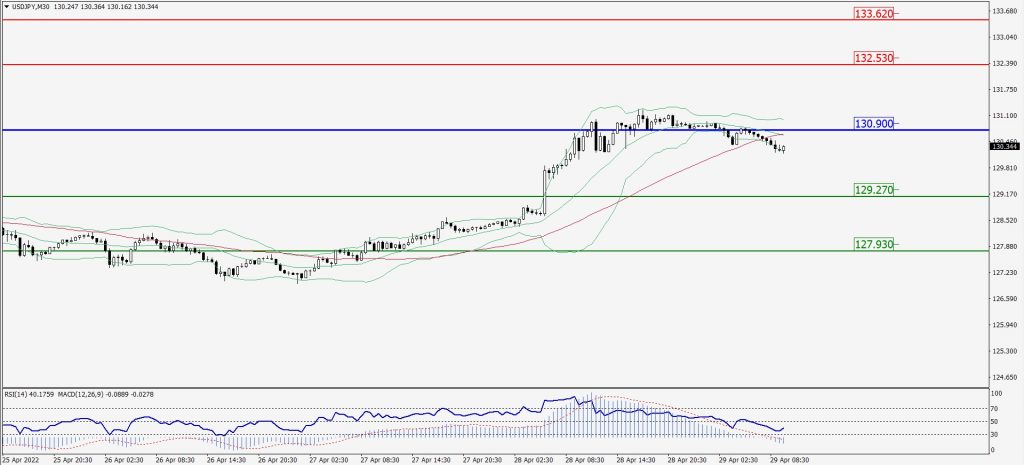
Green Lines Indicate Resistance Levels – Red Lines Indicate Support Levels
Light Blue is a Pivot Point – Black represents the price when the report was produced
AUD/USD Intraday: In a Consolidation Zone
Our pivot point is at 0.71030
Preferable Price Action: Buy Positions above pivot with targets at 0.72750 & 0.74030 in extension.
Alternative Price Action: Below pivot looks for a further downside with 0.69540 & 0.68100 as targets.
Comment: RSI above 50 levels and Pair above its 20MA & 55MA.
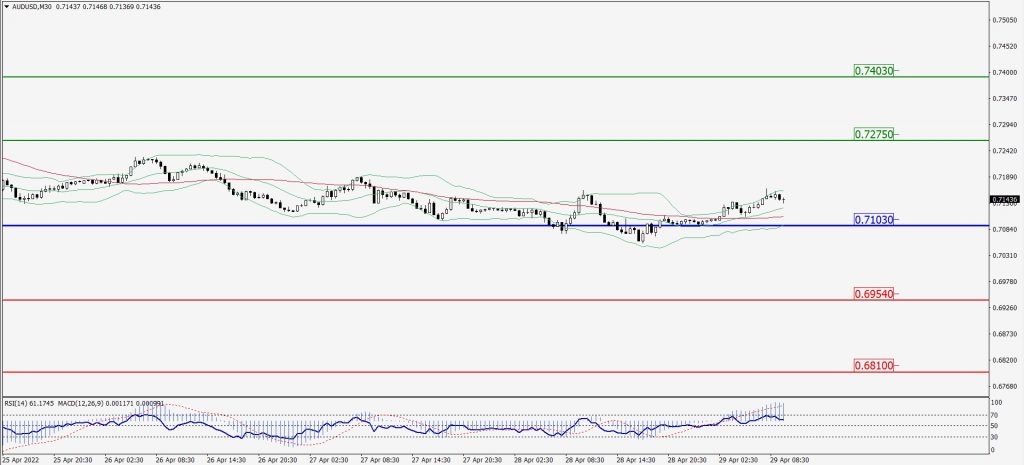
Green Lines Indicate Resistance Levels – Red Lines Indicate Support Levels
Light Blue is a Pivot Point – Black represents the price when the report was produced
CRUDEOIL Intraday: Major Support Level at 103.60
Our pivot point is at 103.60
Preferable Price Action: Above pivots buy oil with 107.50 & 110.20 as targets.
Alternative Price Action: Sell crude below pivot with targets at 100.00 and 97.00 in extension.
Comment: MACD is in the positive territory and Pair above its 20MA & 55MA.
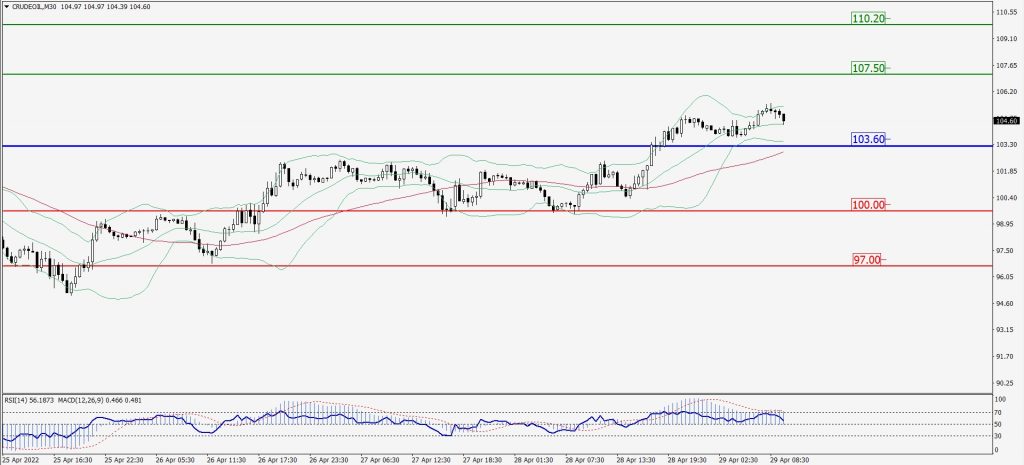
Green Lines Indicate Resistance Levels – Red Lines Indicate Support Levels
Light Blue is a Pivot Point – Black represents the price when the report was produced
XAU/USD Intraday: Major Trend on The Upside
Our pivot point is 1905.70
Preferable Price Action: Further upside to 1935.50 and 1954.40.
Alternative Price Action: If the price gives a downside breakout of a pivot, then the price extends to 1877.20 and 1856.60.
Comment: MACD is positive territory and Pair above its 20MA & 55MA.
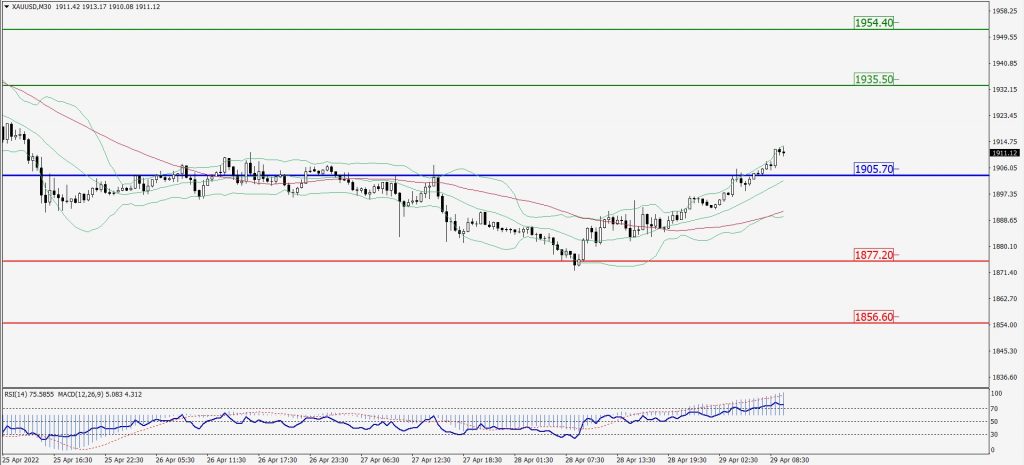
Green Lines Indicate Resistance Levels – Red Lines Indicate Support Levels
Light Blue is a Pivot Point – Black represents the price when the report was produced
Dow Jones Intraday: In a Consolidation Zone
Our pivot point is 33,718.00
Preferable Price Action: Take buy positions above pivot with targets at 34,583.00 & 35,049.00.
Alternative Price Action: Below 33,718.00 looks for further downside to 33,063.00 & 32,618.00.
Comment: RSI above 50 levels and pair above its 20MA & 55MA.
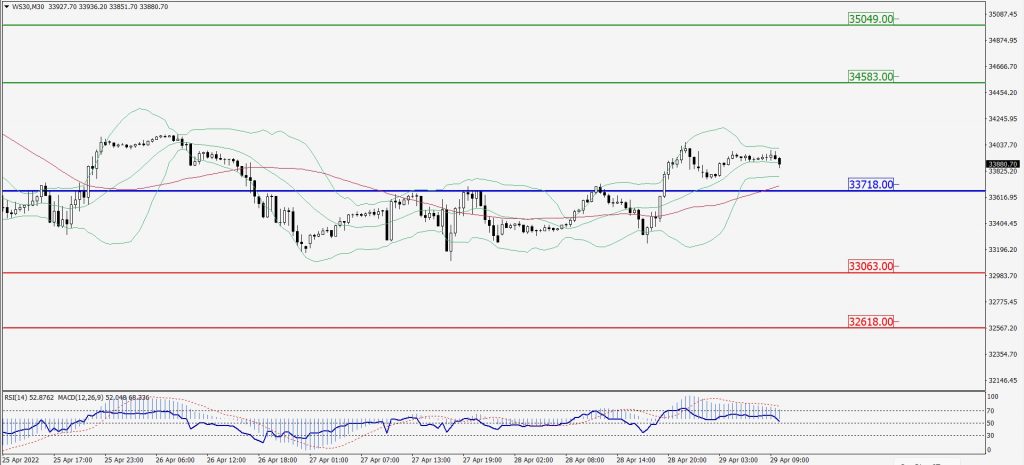
Green Lines Indicate Resistance Levels – Red Lines Indicate Support Levels
Light Blue is a Pivot Point – Black represents the price when the report was produced