Market Wrap: Stocks, Bonds, Commodities
The S&P 500 ended higher on Wednesday following a steep drop the day before, with strong revenue forecasts from Microsoft and Visa helping to alleviate worries about slowing global economic growth and rising interest rates.
The S&P 500 gain (0.21%) ended at 4,183.96 points, while the Nasdaq Composite down 0.01% to 12,488.93. The Dow Jones Industrial was rose 0.19% to 33,301.93.
MSCI’s index of Asia-Pacific stocks outside Japan is ascend 0.95% to 669.27 levels. Australian index higher 1.32% to 7,356.90. Japanese Nikkei Index surge 1.75% to 26,847.90.
European stocks were positive on Thursday, with the Stoxx Europe 50 Index gain 1.80% to 3,803.85, Germany’s DAX ascend 1.89% to 14,055.80, and France’s CAC up 1.83% to 6,564.39, and U.K.’s FTSE 100 increase 0.90% to 7,492.27.
Benchmark 10-year U.S. Treasury fell as demand for safe assets ascend again, today 10-year bond yields Negative 2.8010.
Oil prices dipped on Wednesday as a soaring dollar made barrels more expensive and as coronavirus outbreaks cloud the economic outlook in China, the world’s biggest importer of crude oil.
Spot Brent crude oil fell 0.60% to $104.41 per barrel. US West Texas Intermediate crude is down 0.38% to $101.64 a barrel.
The yellow metal gold is decline 0.28% to 1,883.61 dollars per ounce.
Market Wrap: Forex
The U.S. dollar soared in early European trade Thursday, climbing through a key psychological level versus the Japanese yen as the Bank of Japan maintained its very accommodative monetary policy stance.
Today, the U.S. dollar index measures the Greenback against a trade-weighted basket of six major currencies, which is a rose of 0.20% to 103.160.
The Euro US Dollar (EUR/USD) is a widely traded pair that is down 0.02% today. This left the pair trading around $1.05540.
The Japanese yen was positive against the U.S. dollar on Thursday as the stock up. Today USD/JPY is rose 1.73% to 130.660 level.
Another commodity-related currency mixed against the U.S dollar, AUD/USD ascend 0.39 to 0.71540, and NZD/USD lower 0.14% to 0.65360 level.
EUR/USD Intraday: Trend on The Downside
Our pivot point is at 1.05740
Preferable Price Action: Take Sell positions below pivot level with targets at 1.04390 & 1.03410 in extension.
Alternative Price Action: Above pivot looks for a further upside to 1.07040 & 1.08080.
Comment: RSI below 50 levels and Pair below its 20MA & 55MA.
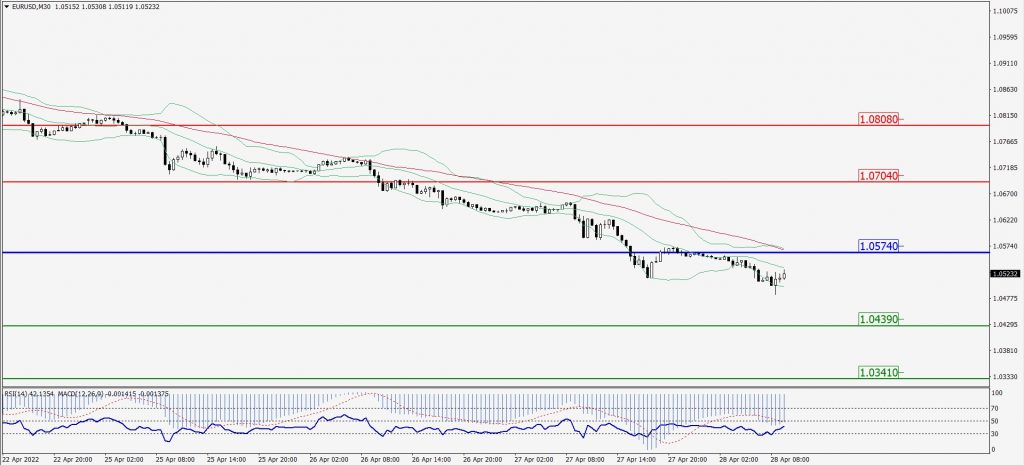
Green Lines Indicate Resistance Levels – Red Lines Indicate Support Levels
Light Blue is a Pivot Point – Black represents the price when the report was produced
GBP/USD Intraday: In a Consolidation Zone
Our pivot point is at 1.24990
Preferable Price Action: Buy positions above pivot with targets at 1.26680 & 1.27980 in extension.
Alternative Price Action: The price below pivot would call for further downside to 1.23610 & 1.22330.
Comment: RSI above 50 levels and Pair above 20MA.
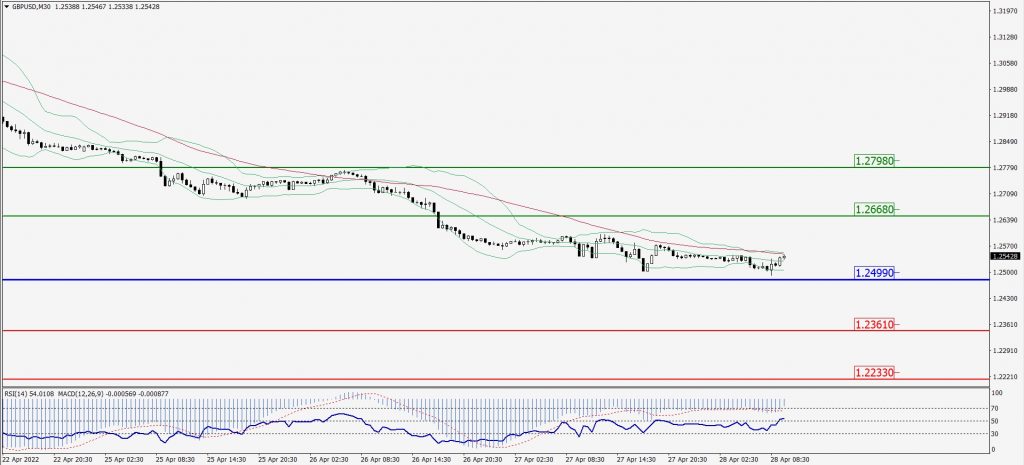
Green Lines Indicate Resistance Levels – Red Lines Indicate Support Levels
Light Blue is a Pivot Point – Black represents the price when the report was produced
USD/JPY Intraday: Major Trend on The Upside
Our pivot point is at 130.050
Preferable Price Action: Buy position above pivot with the target at 131.740 and 133.080 in extension.
Alternative Price Action: The downside breakout of the pivot would call for 128.390 and 127.020.
Comment: MACD in positive territory and Pair above its 20MA & 55MA.
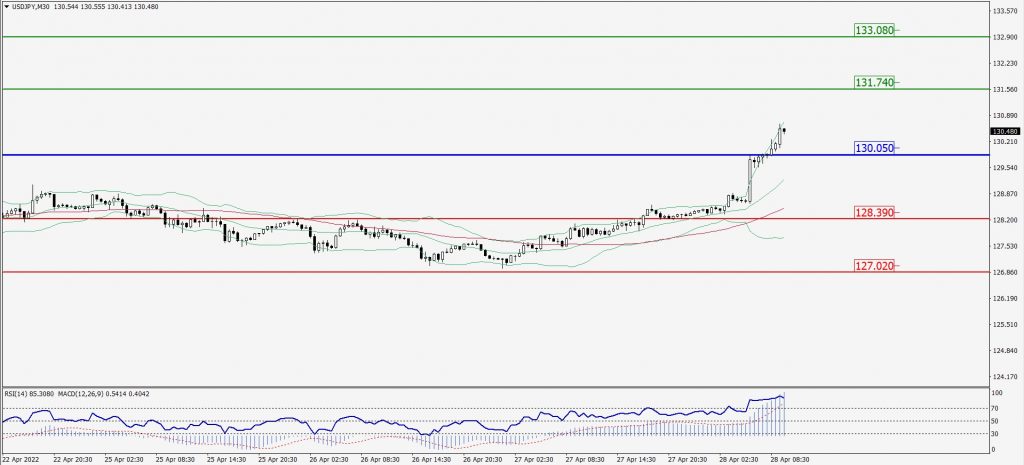
Green Lines Indicate Resistance Levels – Red Lines Indicate Support Levels
Light Blue is a Pivot Point – Black represents the price when the report was produced
AUD/USD Intraday: In a Consolidation Zone
Our pivot point is at 0.71870
Preferable Price Action: Sell Positions below pivot with targets at 0.69970 & 0.68580 in extension.
Alternative Price Action: Above pivot looks for a further upside with 0.73430 & 0.74740 as targets.
Comment: RSI at 50 levels and Pair below 55MA.
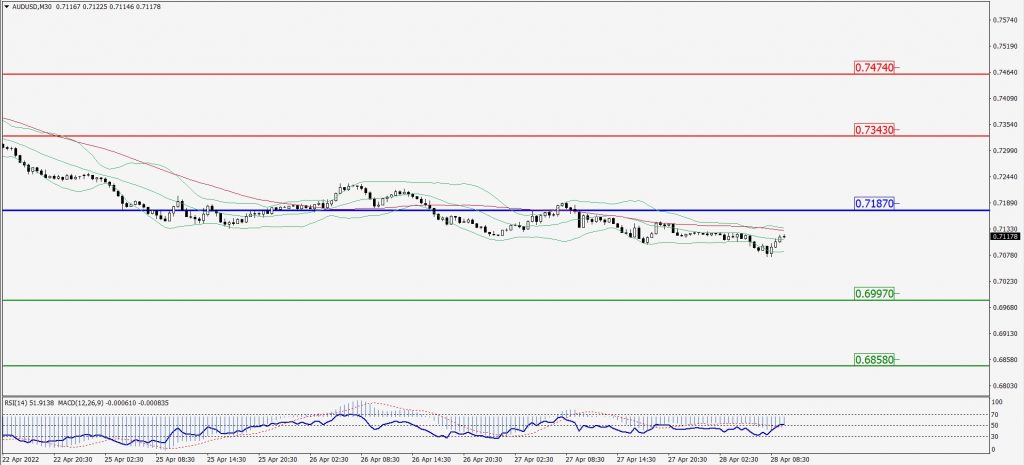
Green Lines Indicate Resistance Levels – Red Lines Indicate Support Levels
Light Blue is a Pivot Point – Black represents the price when the report was produced
CRUDEOIL Intraday: Major Support Level at 99.90
Our pivot point is at 99.90
Preferable Price Action: Above pivots buy oil with 104.30 & 107.10 as targets.
Alternative Price Action: Sell crude below pivot with targets at 96.40 and 93.60 in extension.
Comment: MACD is in the positive territory and Pair above 20MA.
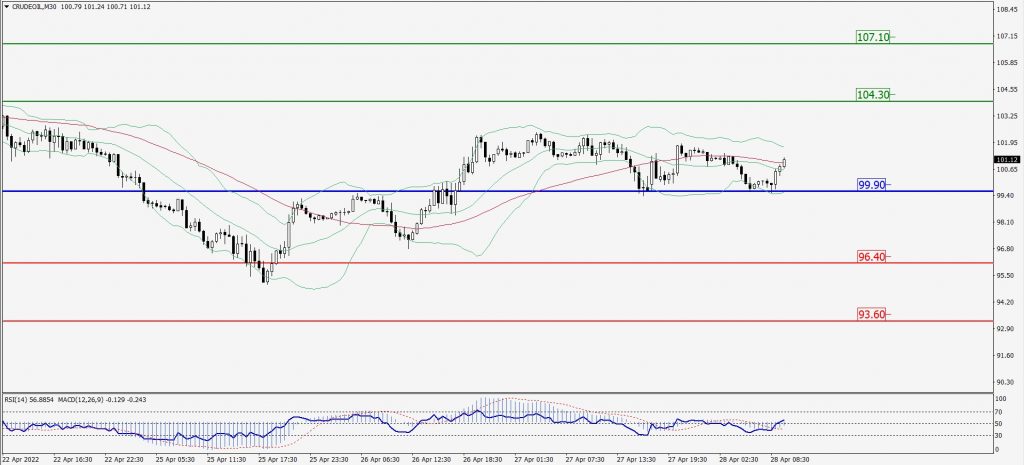
Green Lines Indicate Resistance Levels – Red Lines Indicate Support Levels
Light Blue is a Pivot Point – Black represents the price when the report was produced
XAU/USD Intraday: May Trend Reverse From 1878.40
Our pivot point is 1878.40
Preferable Price Action: Further upside to 1908.80 and 1929.80.
Alternative Price Action: If the price gives a downside breakout of a pivot, then the price extends to 1853.80 and 1838.10.
Comment: MACD is positive territory and Pair above 20MA.
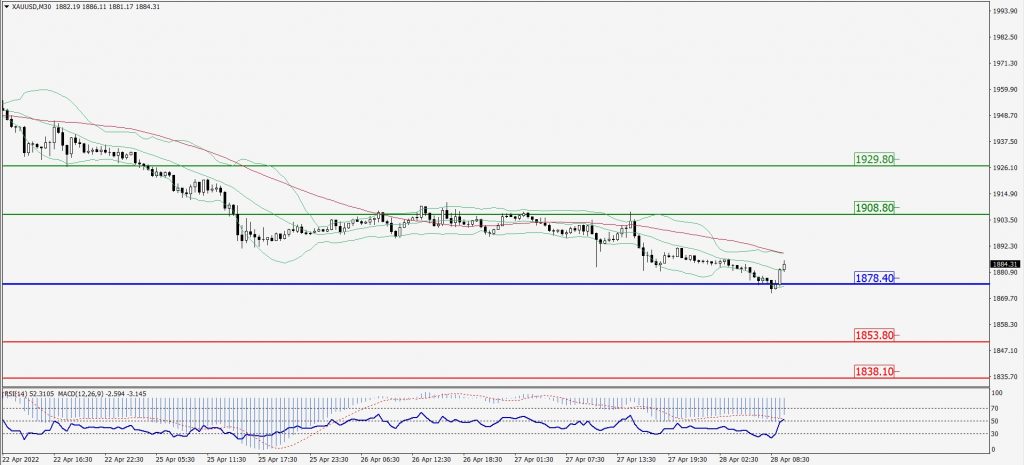
Green Lines Indicate Resistance Levels – Red Lines Indicate Support Levels
Light Blue is a Pivot Point – Black represents the price when the report was produced
Dow Jones Intraday: In a Consolidation Zone
Our pivot point is 33,394.00
Preferable Price Action: Take buy positions above pivot with targets at 34,137.00 & 34,661.00.
Alternative Price Action: Below 33,394.00 looks for further downside to 32,751.00 & 32,315.00.
Comment: RSI above 50 levels and pair above its 20MA & 55MA.
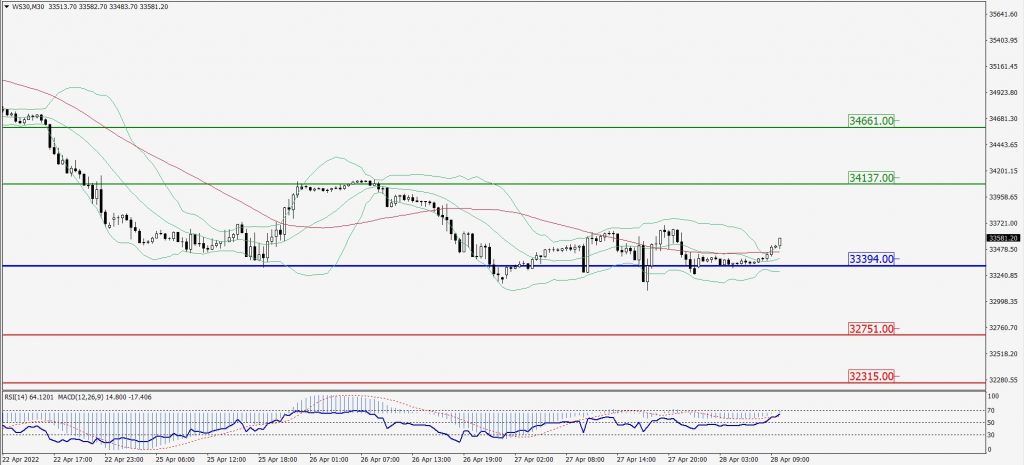
Green Lines Indicate Resistance Levels – Red Lines Indicate Support Levels
Light Blue is a Pivot Point – Black represents the price when the report was produced