Market Wrap: Stocks, Bonds, Commodities
Wall Street closed higher on Monday ahead of a packed week of earnings from megacap companies and the final stretch before the Nov. 5 presidential election, while sentiment improved after energy supplies were not disrupted by weekend developments in the Middle East.
The Dow Jones Industrial Average rise 273.17 points to 42,387.57, the S&P 500 gain 0.27% to 5,823.52 and the Nasdaq Composite up 0.26 points to 18,567.19.
MSCI’s index of Asia-Pacific stocks outside Japan is down 0.13% to 737.77 levels. The Australian index was higher by 0.34% to 8,249.20. Japanese Nikkei Index increase 0.60% today.
European stocks were positive on Tuesday, with the Stoxx Europe 50 Index increase 0.56% to 4,970.55 Germany’s DAX ascend 0.35% to 19.531.62, and France’s CAC higher 0.79% to 7,556.94 and U.K.’s FTSE 100 gain 0.45% to 8,285.62.
Benchmark 10-year U.S. Treasury rose as demand for safe assets slipped again, today 10-year bond yields 0.09% to 4.2780.
Oil prices gained some lost ground on Tuesday after falling 6% in the previous session after Saturday’s retaliatory strike by Israel against Iran’s military bypassed oil and nuclear facilities, not disrupting energy supplies.
Spot Brent crude oil increase 0.46% to $71.33 per barrel. US West Texas Intermediate crude is increase 0.47% to $67.70 a barrel.
The yellow metal gold is up 0.34% to 2,765.15 dollars per ounce.
Market Wrap: Forex
The dollar eased a touch, though remained not too far from its recent high ahead of major U.S. data releases later in the week that could determine the path for Federal Reserve policy.
Today, the U.S. dollar index measures the Greenback against a trade-weighted basket of six major currencies, which either up or down 0.02% to 104.182.
The Euro US Dollar (EUR/USD) is a widely traded is either up or down 0.01% today. This left the pair trading around $1.08120.
The Japanese yen was will move negative against the U.S. dollar on Tuesday. Today USD/JPY is trades pair that decrease 0.05% to the 153.21 level.
Another commodity-related currency negative against the U.S dollar, AUD/USD loss 0.27% to 0.65650, and NZD/USD decrease 0.08% to 0.59760 level.
EUR/USD Intraday: Trend on the downside
Our pivot point is at 1.08120
Preferable Price Action: Take sell positions below pivot level with targets at 1.08020 & 1.07930 in extension.
Alternative Price Action: Buy pivot looks for a further upside to 1.08220 & 1.08220.
Comment: RSI is below 50 levels.
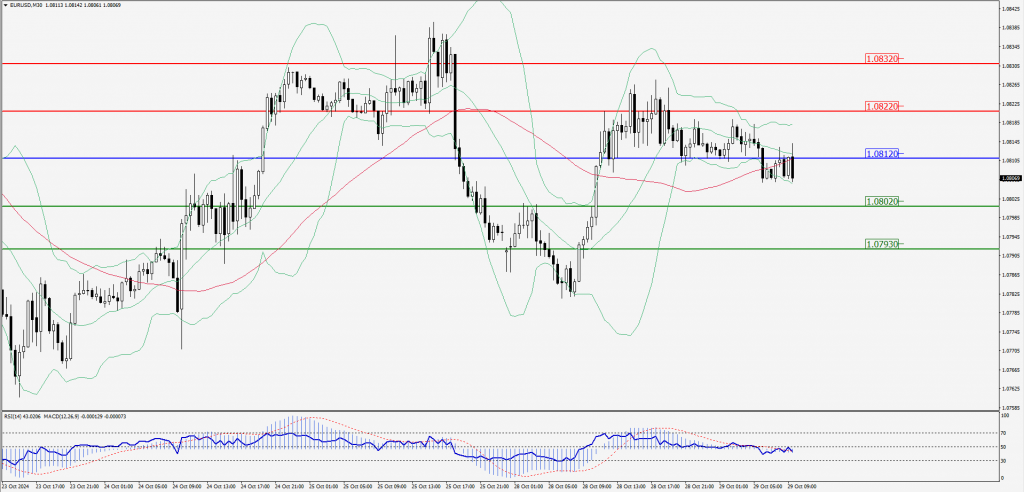
Green Lines Indicate Resistance Levels – Red Lines Indicate Support Levels
Light Blue is a Pivot Point – Black represents the price when the report was produced
GBP/USD Intraday: Trend on the upside
Our pivot point is at 1.29650
Preferable Price Action: Buy positions above pivot with targets at 1.29790 & 1.29900 in extension.
Alternative Price Action: The price below pivot would call for further downside to 1.29520 & 1.2410.
Comment: RSI is above 50 levels.
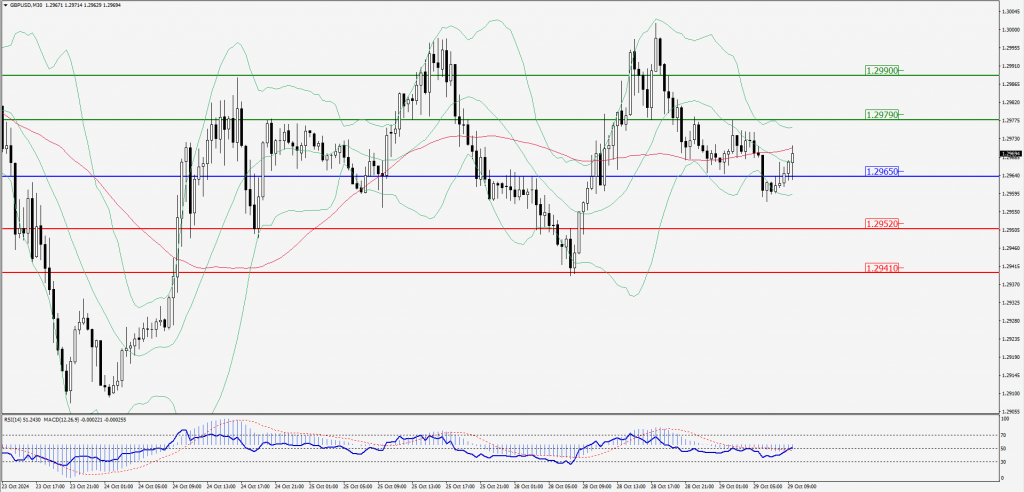
Green Lines Indicate Resistance Levels – Red Lines Indicate Support Levels
Light Blue is a Pivot Point – Black represents the price when the report was produced
USD/JPY Intraday: Trend on the upside
Our pivot point is at 153.090
Preferable Price Action: Buy position above pivot with the target at 153.370 and 153.610 in extension.
Alternative Price Action: The downside breakout of the pivot would call for 152.800 and 152.530.
Comment: MACD is above 50 levels.
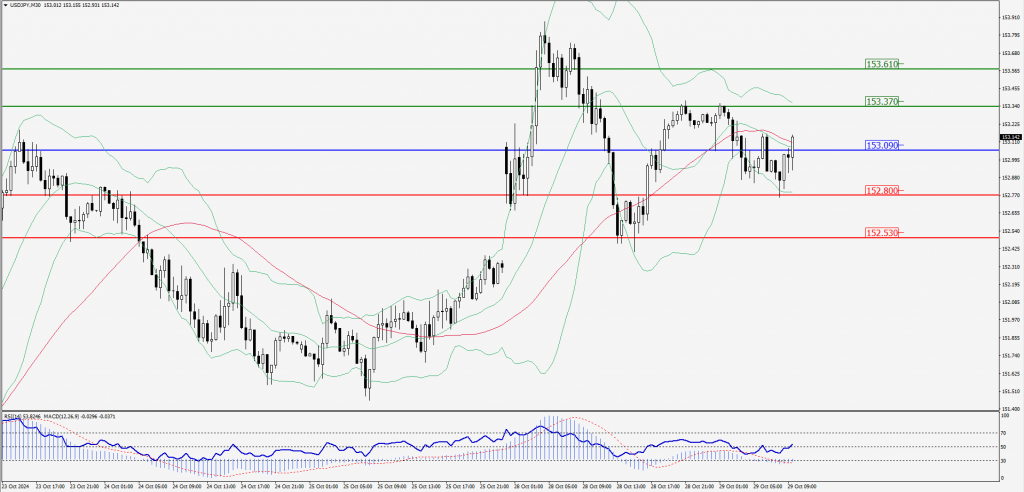
Green Lines Indicate Resistance Levels – Red Lines Indicate Support Levels
Light Blue is a Pivot Point – Black represents the price when the report was produced
AUD/USD Intraday: Trend on the downside
Our pivot point is at 0.65740
Preferable Price Action: Sell positions below pivot with targets at 0.65600 & 0.65470 in extension.
Alternative Price Action: Above pivot a further upside with 0.65900 & 0.66050 as targets.
Comment: RSI is below 50 levels and pairs below its 55MA & 20MA.
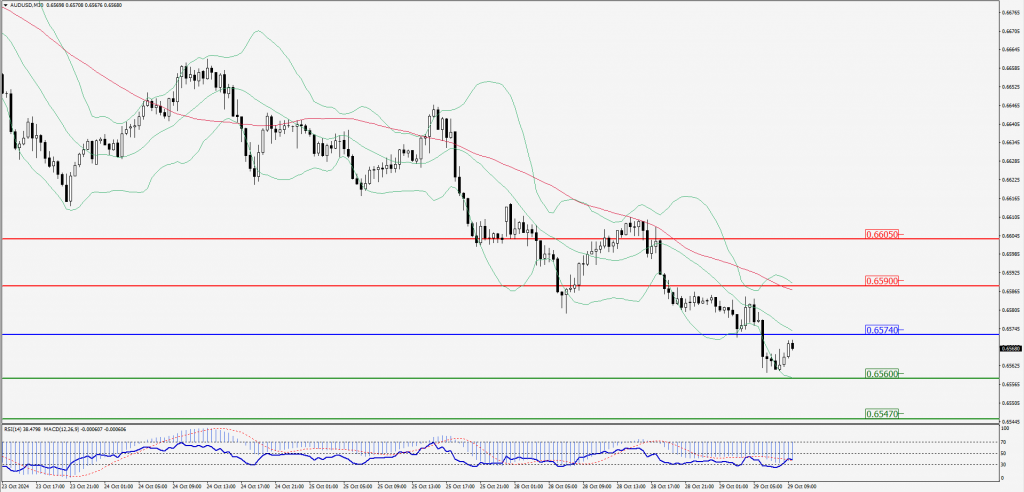
Green Lines Indicate Resistance Levels – Red Lines Indicate Support Levels
Light Blue is a Pivot Point – Black represents the price when the report was produced
CRUDEOIL Intraday: Trend on the downside
Our pivot point is at 67.59
Preferable Price Action: Below pivot sell oil with 66.91 & 66.34 as targets.
Alternative Price Action: Buy crude above pivot with targets at 68.29 & 68.87 in extension.
Comment: RSI is at below 50 levels and pairs below its 55MA & 20MA.
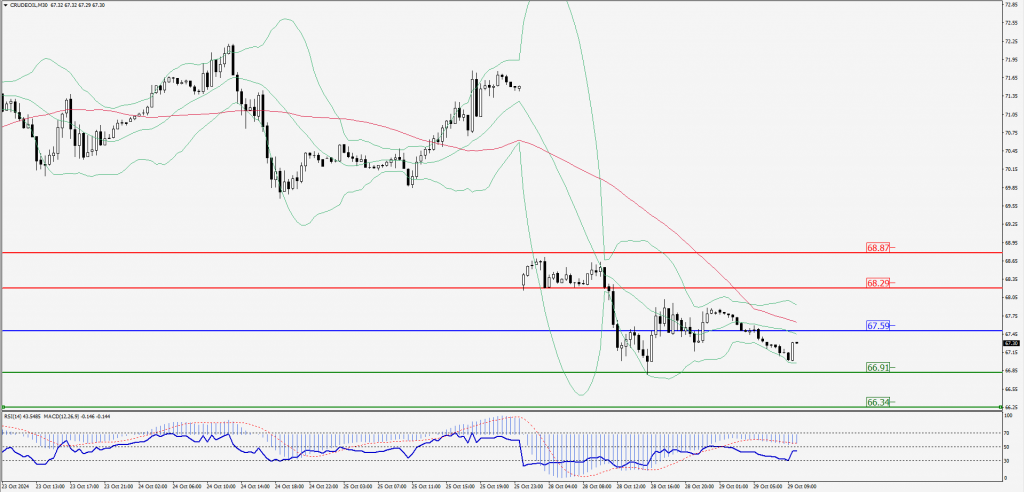
Green Lines Indicate Resistance Levels – Red Lines Indicate Support Levels
Light Blue is a Pivot Point – Black represents the price when the report was produced
XAU/USD Intraday: Trend on the upside
Our pivot point is at 2752.60
Preferable Price Action: Further upside to 2759.50 and 2765.60.
Alternative Price Action: If the price gives an downside breakout of a pivot, then the price extends to 2745.60 and 2738.40.
Comment: MACD is above 50 levels and pairs above its 55MA & 20MA.
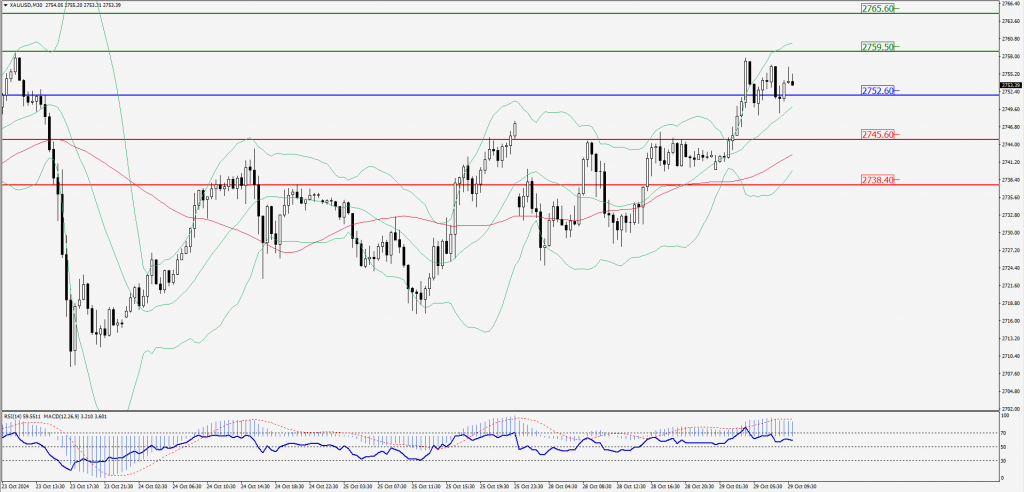
Green Lines Indicate Resistance Levels – Red Lines Indicate Support Levels
Light Blue is a Pivot Point – Black represents the price when the report was produced
Dow Jones Intraday: Trend on the upside
Our pivot point is 42,397.20
Preferable Price Action: Take buy positions above the pivot with targets at 42,498.80 & 42,588.30.
Alternative Price Action: Below 42,397.20 looks for further downside to 42,294.40 & 42,201.60.
Comment: RSI is above 50 levels and pairs above its 20MA and 55MA.
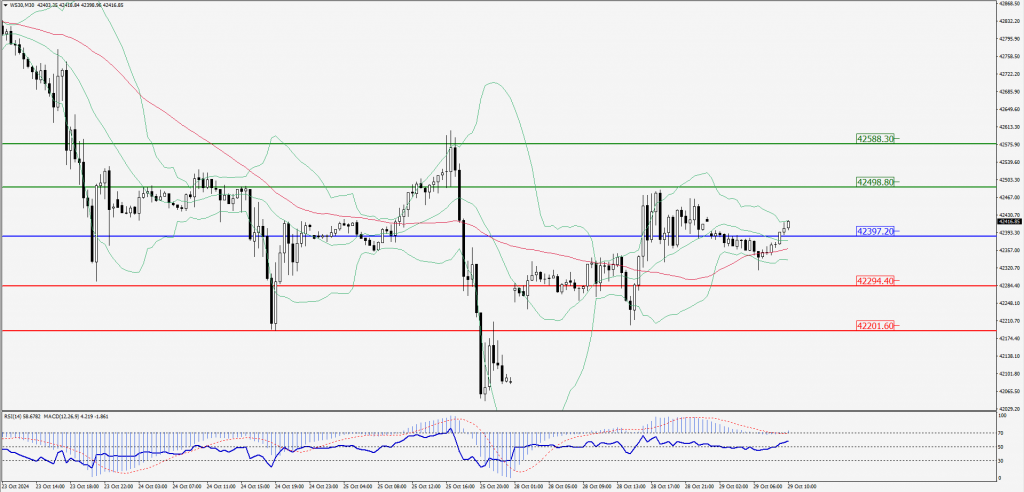
Green Lines Indicate Resistance Levels – Red Lines Indicate Support Levels
Light Blue is a Pivot Point – Black represents the price when the report was produced