Market Wrap: Stocks, Bonds, Commodities
Most Asian currencies firmed on Monday as the dollar fell sharply from recent highs after soft labor data, with focus turning squarely to the upcoming presidential election and a Federal Reserve meeting.
The Dow Jones Industrial Average rise 288.73 points to 42,052.19, the S&P 500 gain 0.41% to 5,728.80 and the Nasdaq Composite up 0.80 points to 18,239.92.
MSCI’s index of Asia-Pacific stocks outside Japan is up 0.92% to 734.72 levels. The Australian index was higher by 0.56% to 8,164.60. Japanese Nikkei Index decrease 2.63% today.
European stocks were positive on Monday, with the Stoxx Europe 50 Index decrease 0.12% to 4,871.75 Germany’s DAX descend 0.15% to 19.224.15, and France’s CAC lower 0.02% to 7,407.53 and U.K.’s FTSE 100 gain 0.48% to 8,216.78.
Benchmark 10-year U.S. Treasury fail as demand for safe assets slipped again, today 10-year bond yields 1.29% to 4.3110.
Oil prices rose sharply in Asian trade on Monday after the OPEC+ said it will delay a planned output hike in December by at least a month, citing recent pressure on prices from weak demand.
Spot Brent crude oil increase 1.71% to $74.81 per barrel. US West Texas Intermediate crude is increase 2.53% to $71.25 a barrel.
The yellow metal gold is down 0.12% to 2,746.00 dollars per ounce.
Market Wrap: Forex
The dollar slid in Asia on Monday as investors braced for a potential pivot this week for the global economy as the United States chooses a new leader, and as it likely cuts interest rates again with major implications for bond yields.
Today, the U.S. dollar index measures the Greenback against a trade-weighted basket of six major currencies, which either up or down 0.49% to 103.77.
The Euro US Dollar (EUR/USD) is a widely traded is either up or up 0.53% today. This left the pair trading around $1.08920.
The Japanese yen was will move negative against the U.S. dollar on Monday. Today USD/JPY is trades pair that decrease 0.64% to the 152.00 level.
Another commodity-related currency negative against the U.S dollar, AUD/USD gain 0.47% to 0.65900, and NZD/USD increase 0.44% to 0.59890 level.
EUR/USD Intraday: Trend on the upside
Our pivot point is at 1.08910
Preferable Price Action: Take buy positions above pivot level with targets at 1.09090 & 1.09280 in extension.
Alternative Price Action: Sell pivot looks for a further downside to 1.08730 & 1.08540.
Comment: RSI is above 50 levels and pairs above its 55MA & 20MA.
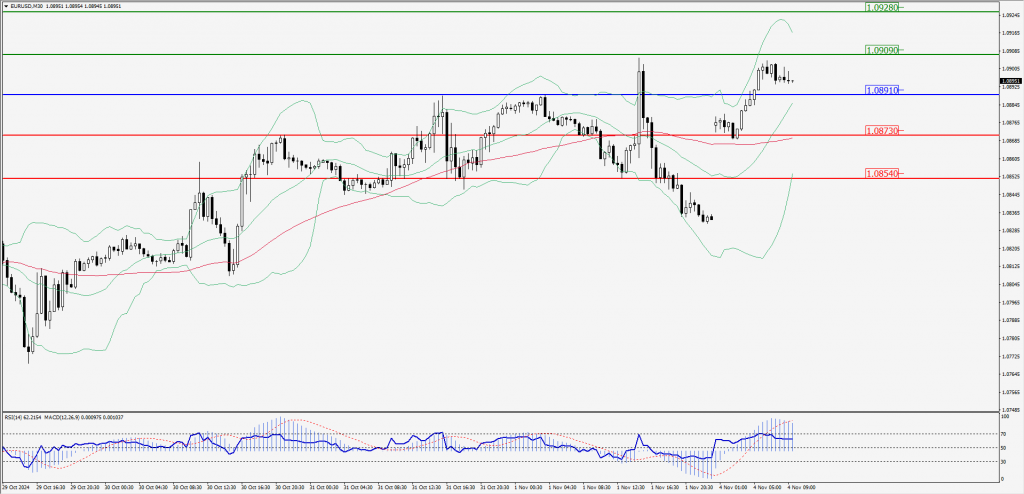
Green Lines Indicate Resistance Levels – Red Lines Indicate Support Levels
Light Blue is a Pivot Point – Black represents the price when the report was produced
GBP/USD Intraday: Trend on the upside
Our pivot point is at 1.29860
Preferable Price Action: Buy positions above pivot with targets at 1.30090 & 1.30310 in extension.
Alternative Price Action: The price below pivot would call for further downside to 1.29630 & 1.29410.
Comment: RSI is above 50 levels and pairs above its 55MA & 20MA.
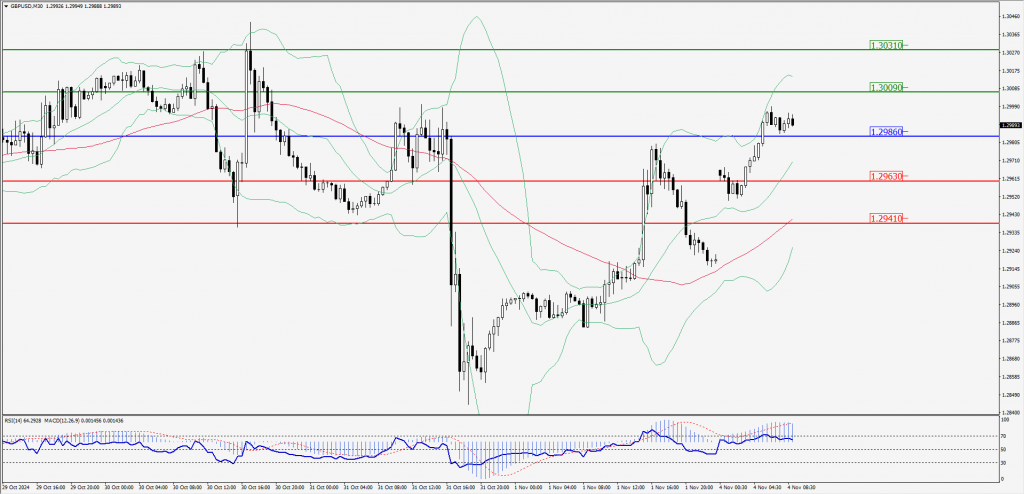
Green Lines Indicate Resistance Levels – Red Lines Indicate Support Levels
Light Blue is a Pivot Point – Black represents the price when the report was produced
USD/JPY Intraday: Trend on the downside
Our pivot point is at 152.180
Preferable Price Action: Sell position below pivot with the target at 151.870 and 151.600 in extension.
Alternative Price Action: The upside breakout of the pivot would call for 152.490 and 152.780.
Comment: MACD is below 50 levels and pairs below its 55MA.
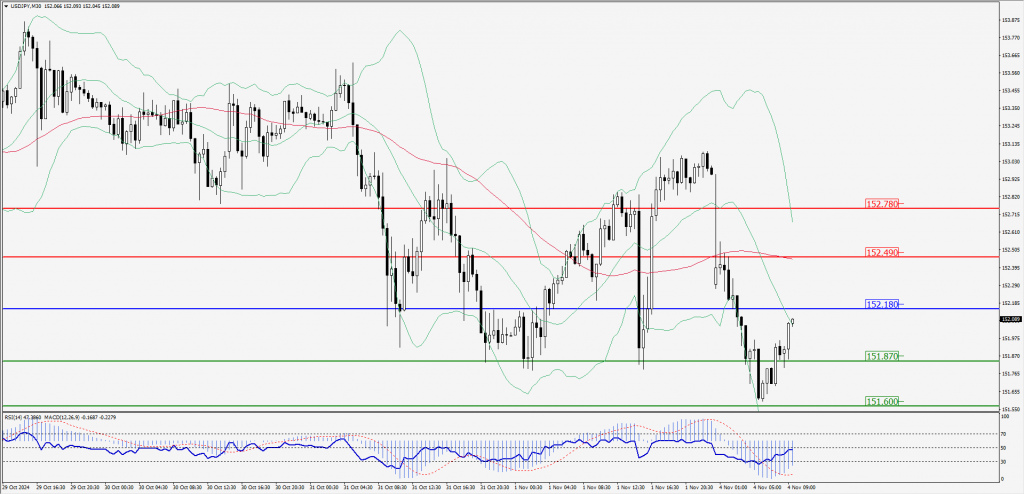
Green Lines Indicate Resistance Levels – Red Lines Indicate Support Levels
Light Blue is a Pivot Point – Black represents the price when the report was produced
AUD/USD Intraday: Trend on the upside
Our pivot point is at 0.66000
Preferable Price Action: Buy positions above pivot with targets at 0.66100 & 0.66200 in extension.
Alternative Price Action: Below pivot a further downside with 0.65900 & 0.65800 as targets.
Comment: RSI is above 50 levels and pairs above its 55MA & 20MA.
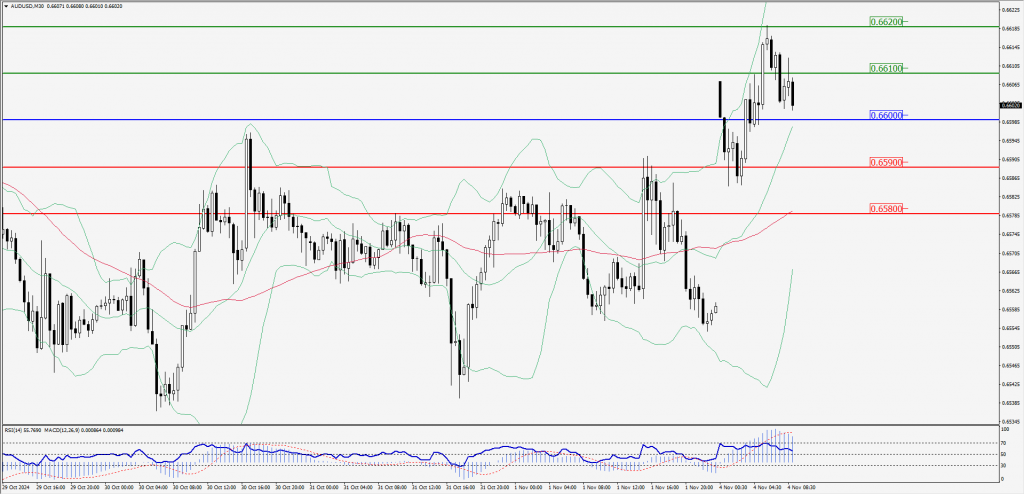
Green Lines Indicate Resistance Levels – Red Lines Indicate Support Levels
Light Blue is a Pivot Point – Black represents the price when the report was produced
CRUDEOIL Intraday: Trend on the upside
Our pivot point is at 70.51
Preferable Price Action: Above pivot buy oil with 70.93 & 71.38 as targets.
Alternative Price Action: Sell crude below pivot with targets at 70.08 & 69.67 in extension.
Comment: RSI is at above 50 levels and pairs above its 55MA & 20MA.
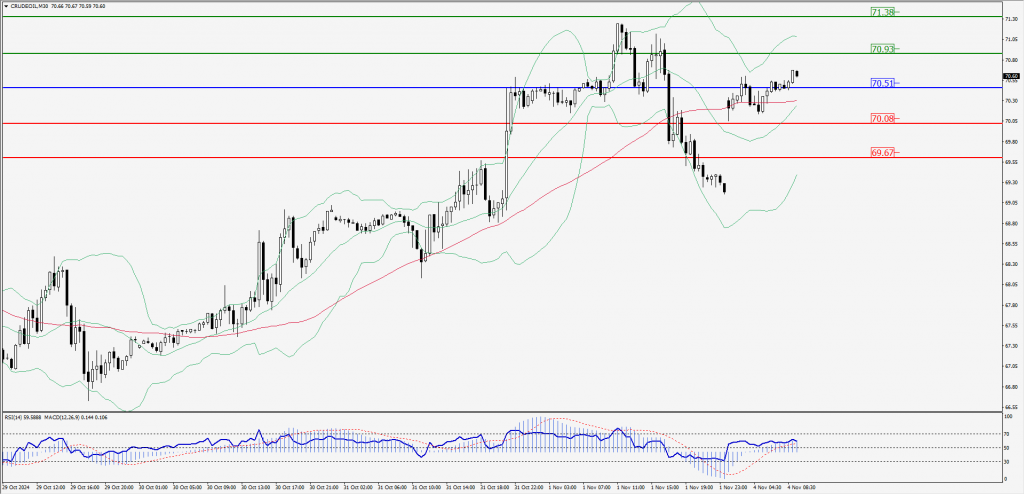
Green Lines Indicate Resistance Levels – Red Lines Indicate Support Levels
Light Blue is a Pivot Point – Black represents the price when the report was produced
XAU/USD Intraday: Trend on the upside
Our pivot point is at 2740.50
Preferable Price Action: Further upside to 2746.70 and 2752.20.
Alternative Price Action: If the price gives an downside breakout of a pivot, then the price extends to 2734.70 and 2729.40.
Comment: MACD is above 50 levels.
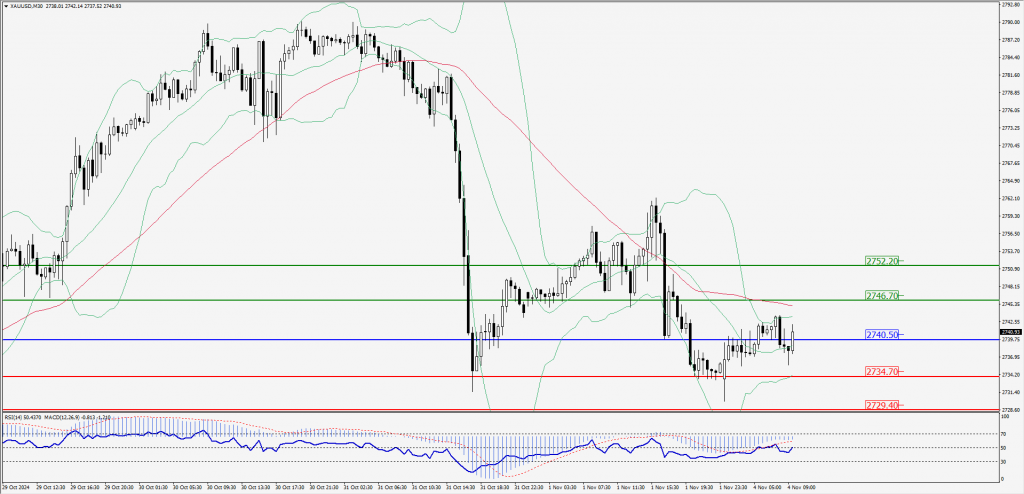
Green Lines Indicate Resistance Levels – Red Lines Indicate Support Levels
Light Blue is a Pivot Point – Black represents the price when the report was produced
Dow Jones Intraday: Trend on the upside
Our pivot point is 42,019.50
Preferable Price Action: Take buy positions above the pivot with targets at 42,123.60 & 42,219.70.
Alternative Price Action: Below 42,019.50 looks for further downside to 41,916.70 & 41,820.50.
Comment: RSI is above 50 levels and pairs above its 20MA and 55MA.
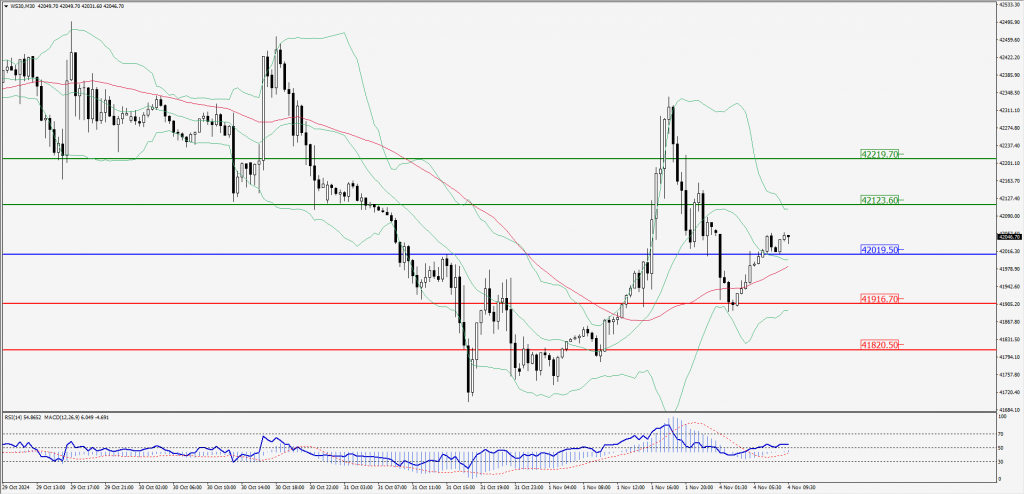
Green Lines Indicate Resistance Levels – Red Lines Indicate Support Levels
Light Blue is a Pivot Point – Black represents the price when the report was produced