Market Wrap: Stocks, Bonds, Commodities
US stocks were higher on Wednesday, with the Dow leading gains and the S&P 500 setting a closing record, paced drugmaker Merck, while investors looked towards the next piece of inflation data and the Federal Reserve commentary for signals on the rate path.
The Dow Jones Industrial Average rose 477.75 points to 39,760.08, the S&P 500 gain 0.86% to 5,248.49 and the Nasdaq Composite surged 83.82 points to 16,399.52.
MSCI’s index of Asia-Pacific stocks outside Japan is advance 0.33% to 652.88 levels. The Australian index was higher by 0.99% to 7,896.90. Japanese Nikkei Index drop 1.57% today.
European stocks were positive on Thursday, with the Stoxx Europe 50 Index rose 0.31% to 5,097.35, Germany’s DAX ascend 0.20% to 18,512.35, and France’s CAC advance 0.47% to 8,242.49 and U.K.’s FTSE 100 add 0.33% to 7,957.65.
Benchmark 10-year U.S. Treasury rose as demand for safe assets drop again, today 10-year bond yields positive 0.60% to 4.2230.
Oil prices were broadly level on Wednesday, after official numbers were released for U.S. crude stockpile and signs the OPEC+ producer group is unlikely to change its output policy at a technical meeting next week.
Spot Brent crude oil ascend 0.43% to $85.79 per barrel. US West Texas Intermediate crude is up 0.59% to $81.81 a barrel.
The yellow metal gold is advance 0.18% to 2,216.35 dollars per ounce.
Market Wrap: Forex
The U.S. dollar consolidated against major currency peers on Thursday as traders braced for key economic data, after a Federal Reserve official said he wasn’t in a hurry to cut rates amid sticky inflation.
Today, the U.S. dollar index measures the Greenback against a trade-weighted basket of six major currencies, which surged 0.26% to 104.330.
The Euro US Dollar (EUR/USD) is a widely traded pair that is down 0.30% today. This left the pair trading around $1.07930.
The Japanese yen was positive against the U.S. dollar on Thursday. Today USD/JPY is surged 0.07% to the 151.430 level.
Another commodity-related currency negative against the U.S dollar, AUD/USD fell 0.61% to 0.64930, and NZD/USD slipped 0.67% to 0.59630 level.
EUR/USD Intraday: Trend on the downside
Our pivot point is at 1.08240
Preferable Price Action: Take sell positions below pivot level with targets at 1.08150 & 1.08080 in extension.
Alternative Price Action: Above pivot looks for a further upside to 1.08330 & 1.08400.
Comment: RSI is below 50 levels and Pairs below 55MA.
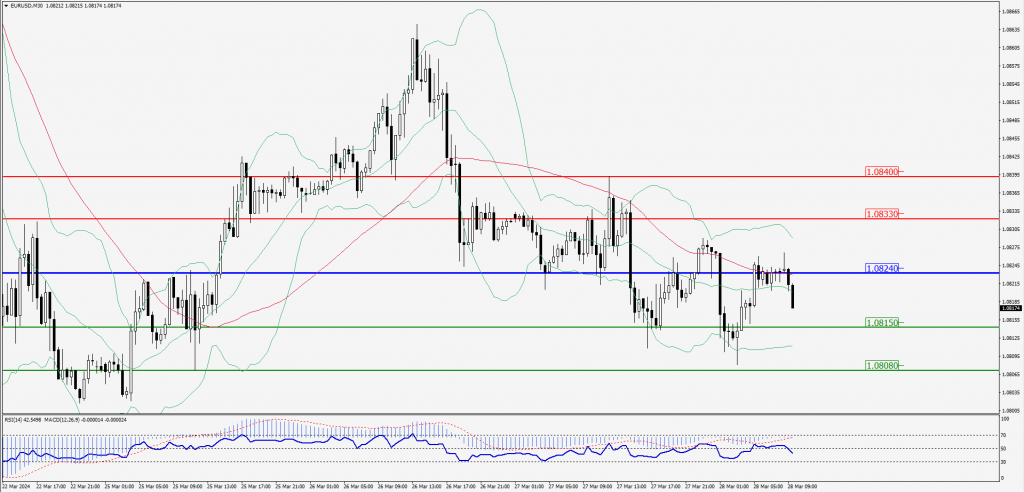
Green Lines Indicate Resistance Levels – Red Lines Indicate Support Levels
Light Blue is a Pivot Point – Black represents the price when the report was produced
GBP/USD Intraday: Trend on the downside
Our pivot point is at 1.26320
Preferable Price Action: Sell positions below pivot with targets at 1.26180 & 1.26060 in extension.
Alternative Price Action: The price above pivot would call for further upside to 1.26460 & 1.26570.
Comment: RSI is at 50 levels.
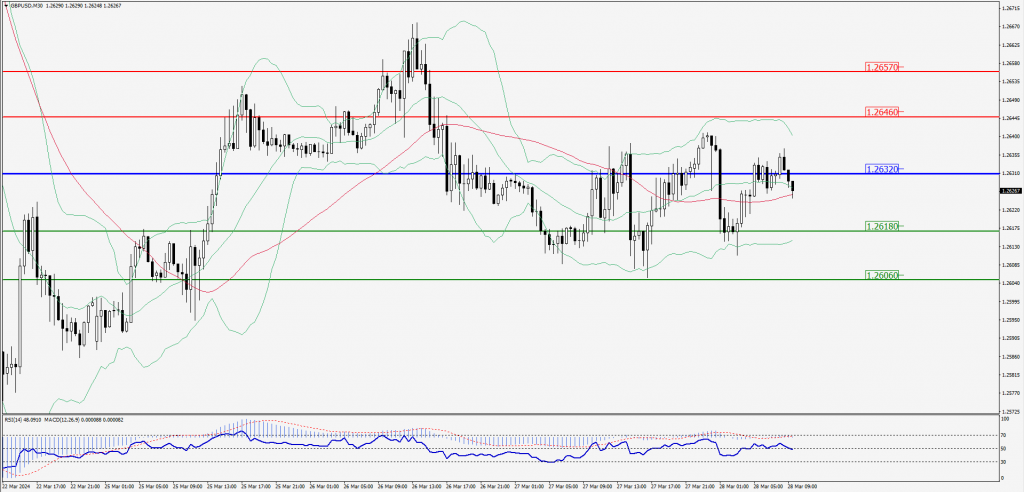
Green Lines Indicate Resistance Levels – Red Lines Indicate Support Levels
Light Blue is a Pivot Point – Black represents the price when the report was produced
USD/JPY Intraday: Major resistance level at 151.390
Our pivot point is at 151.390
Preferable Price Action: Sell position below pivot with the target at 151.250 and 151.140 in extension.
Alternative Price Action: The upside breakout of the pivot would call for 151.530 and 151.650.
Comment: MACD is below 50 levels and Pairs below 55MA.
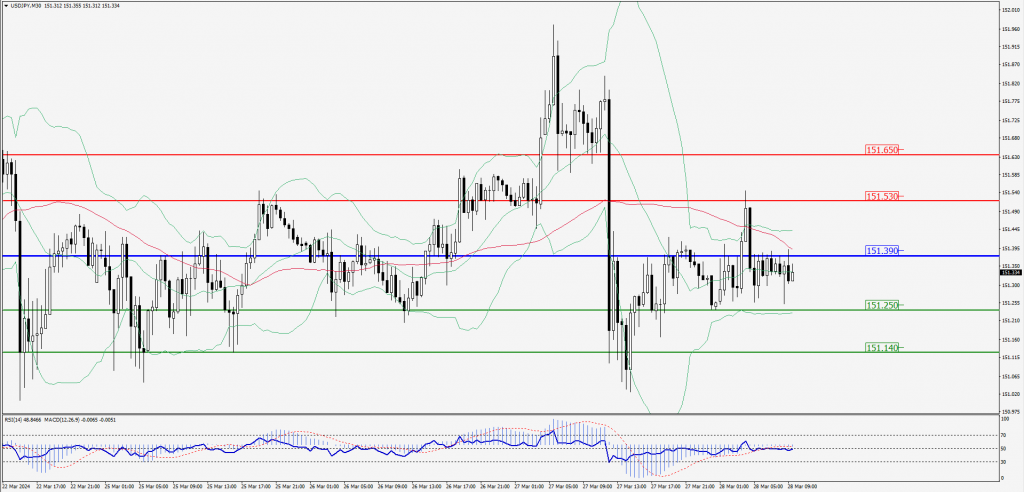
Green Lines Indicate Resistance Levels – Red Lines Indicate Support Levels
Light Blue is a Pivot Point – Black represents the price when the report was produced
AUD/USD Intraday: Trend on the downside
Our pivot point is at 0.65240
Preferable Price Action: Sell positions below pivot with targets at 0.65160 & 0.65100 in extension.
Alternative Price Action: Above pivot looks for a further upside with 0.65320 & 0.65380 as targets.
Comment: RSI is below 50 levels and pairs below its 20MA & 55MA.
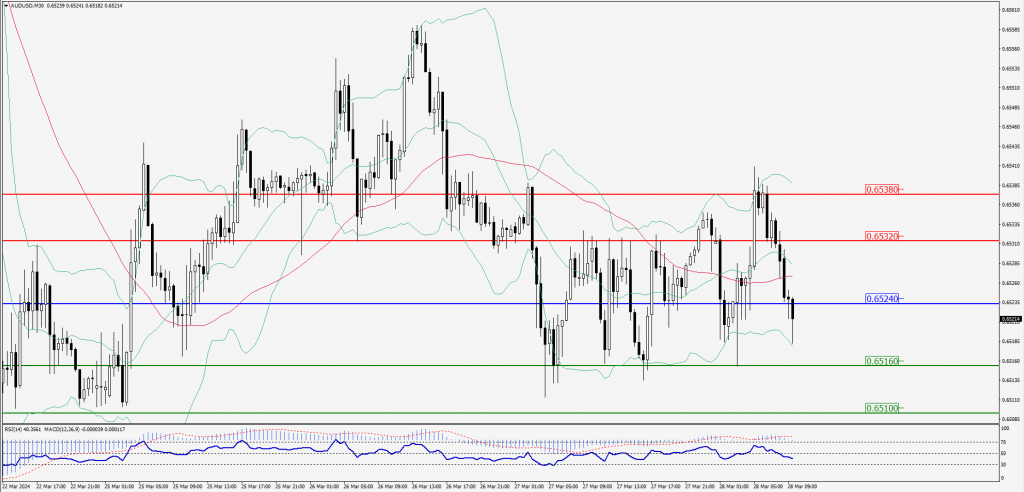
Green Lines Indicate Resistance Levels – Red Lines Indicate Support Levels
Light Blue is a Pivot Point – Black represents the price when the report was produced
CRUDEOIL Intraday: Support level at 81.42
Our pivot point is at 81.42
Preferable Price Action: Above pivot buy oil with 81.70 & 81.95 as targets.
Alternative Price Action: Sell crude below pivot with targets at 81.09 and 80.85 in extension.
Comment: MACD is positive territory and Pairs above 55MA.
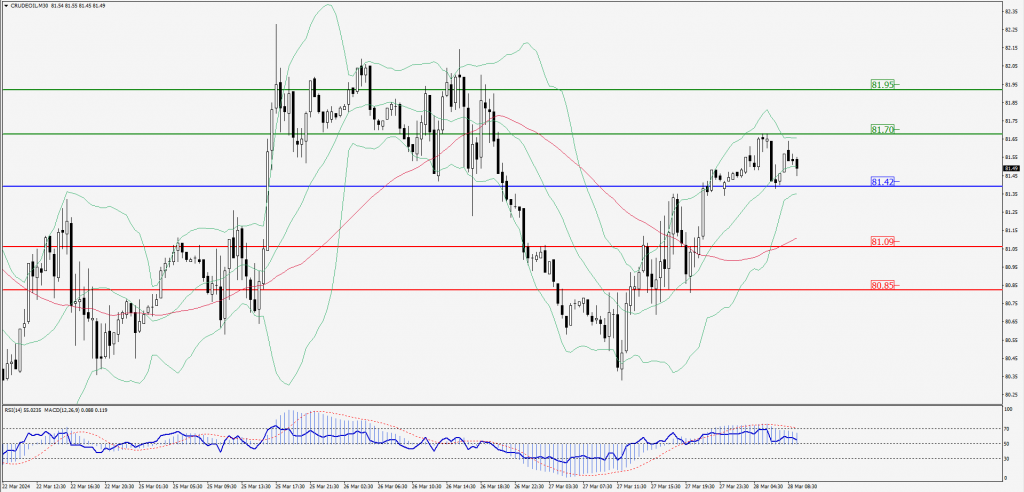
Green Lines Indicate Resistance Levels – Red Lines Indicate Support Levels
Light Blue is a Pivot Point – Black represents the price when the report was produced
XAU/USD Intraday: Trend on the upside
Our pivot point is 2195.80
Preferable Price Action: Further upside to 2202.20 and 2207.30.
Alternative Price Action: If the price gives an downside breakout of a pivot, then the price extends to 2189.20 and 2183.90.
Comment: MACD is above 50 levels and pairs above its 20MA & 55MA.
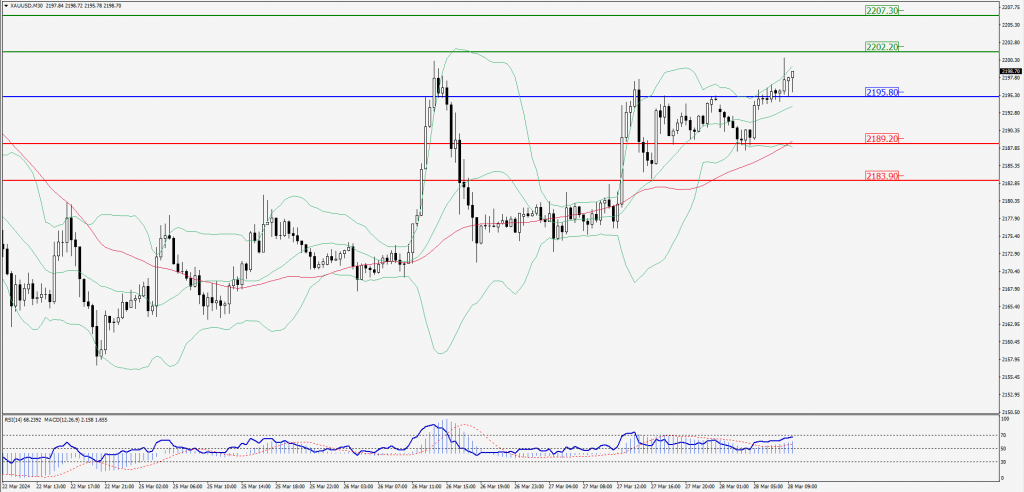
Green Lines Indicate Resistance Levels – Red Lines Indicate Support Levels
Light Blue is a Pivot Point – Black represents the price when the report was produced
Dow Jones Intraday: Trend on the upside
Our pivot point is 39,708.00
Preferable Price Action: Take buy positions above the pivot with targets at 39,789.40 & 39,858.30.
Alternative Price Action: Below 39,708.00 looks for further downside to 39,625.00 & 39,555.30.
Comment: RSI is above 50 levels and Pairs above 55MA.
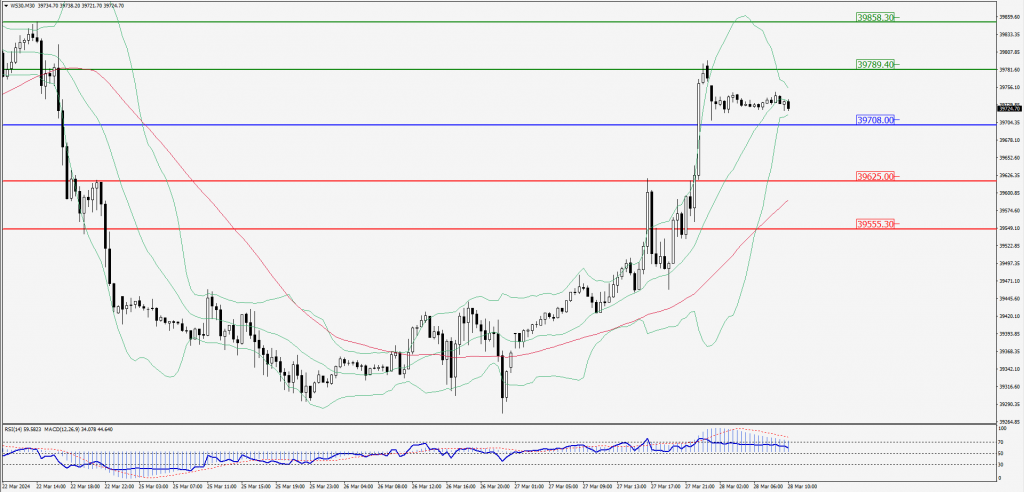
Green Lines Indicate Resistance Levels – Red Lines Indicate Support Levels
Light Blue is a Pivot Point – Black represents the price when the report was produced