Market Wrap: Stocks, Bonds, Commodities
US stocks slipped on Tuesday, giving up modest gains late in the session to send the Dow and S&P 500 to their third straight decline, as investors awaited economic data in a holiday-shortened week to gauge the Federal Reserve’s policy path.
The Dow Jones Industrial Average fell 31.31 points to 39,282.33, the S&P 500 lose 0.28% to 5,203.58 and the Nasdaq Composite slipped 68.77 points to 16,315.70.
MSCI’s index of Asia-Pacific stocks outside Japan is decline 0.44% to 651.41 levels. The Australian index was higher by 0.73% to 7,819.60. Japanese Nikkei Index ascend 0.73% today.
European stocks were mixed on Tuesday, with the Stoxx Europe 50 Index rose 0.06% to 5,067.25, Germany’s DAX ascend 0.07% to 18,411.26, and France’s CAC decline 0.11% to 8,176.13 and U.K.’s FTSE 100 subtract 0.34% to 7,904.21.
Benchmark 10-year U.S. Treasury fell as demand for safe assets drop again, today 10-year bond yields positive 0.21% to 4.2420.
Oil prices were little changed on Wednesday as investors took a more mixed view toward the loss of Russian refinery capacity after recent Ukrainian attacks while a slightly weaker U.S. dollar offered some support.
Spot Brent crude oil drop 1.07% to $84.71 per barrel. US West Texas Intermediate crude is down 1.13% to $80.70 a barrel.
The yellow metal gold is advance 0.14% to 2,180.40 dollars per ounce.
Market Wrap: Forex
Most Asian currencies retreated on Wednesday, with the Japanese yen hitting its weakest level since 1990 as the dollar firmed ahead of more cues on inflation and the Federal Reserve later this week.
Today, the U.S. dollar index measures the Greenback against a trade-weighted basket of six major currencies, which slipped 0.05% to 103.940.
The Euro US Dollar (EUR/USD) is a widely traded pair that is up 0.12% today. This left the pair trading around $1.08370.
The Japanese yen was negative against the U.S. dollar on Wednesday. Today USD/JPY is slipped 0.24% to the 151.190 level.
Another commodity-related currency mixed against the U.S dollar, AUD/USD fell 0.05% to 0.65300, and NZD/USD surged 0.08% to 0.60080 level.
EUR/USD Intraday: Trend on the downside
Our pivot point is at 1.08372
Preferable Price Action: Take sell positions below pivot level with targets at 1.08200 & 1.08070 in extension.
Alternative Price Action: Above pivot looks for a further upside to 1.08530 & 1.08660.
Comment: RSI is below 50 levels and Pairs below 55MA.
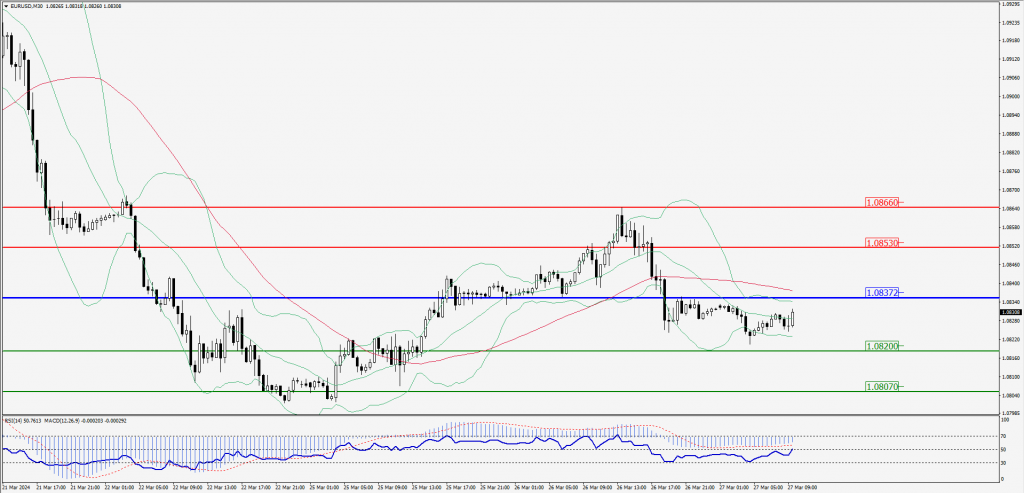
Green Lines Indicate Resistance Levels – Red Lines Indicate Support Levels
Light Blue is a Pivot Point – Black represents the price when the report was produced
GBP/USD Intraday: Resistance level at 1.26330
Our pivot point is at 1.26330
Preferable Price Action: Sell positions below pivot with targets at 1.25990 & 1.25740 in extension.
Alternative Price Action: The price above pivot would call for further upside to 1.26650 & 1.26930.
Comment: RSI is below 50 levels and Pairs below 55MA.
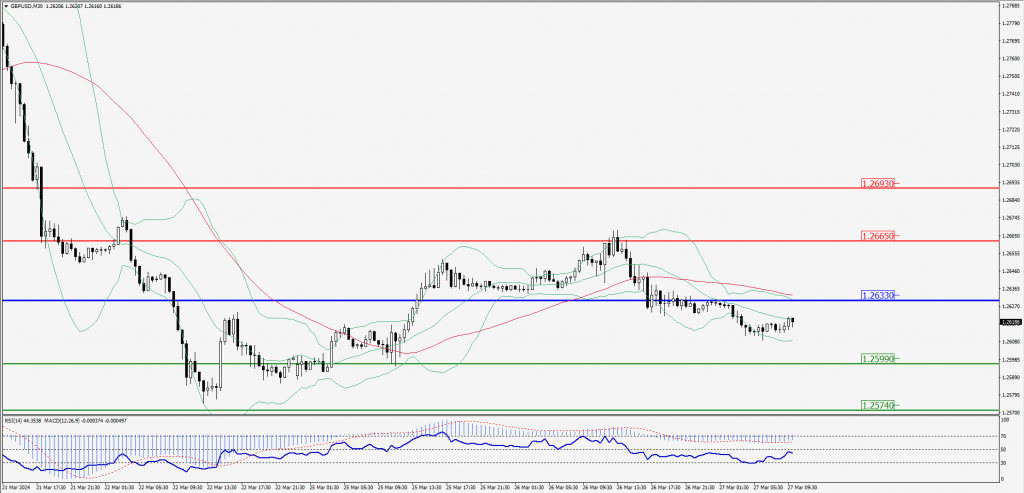
Green Lines Indicate Resistance Levels – Red Lines Indicate Support Levels
Light Blue is a Pivot Point – Black represents the price when the report was produced
USD/JPY Intraday: Trend on the upside
Our pivot point is at 151.670
Preferable Price Action: Buy position above pivot with the target at 151.840 and 151.970 in extension.
Alternative Price Action: The downside breakout of the pivot would call for 151.510 and 151.390.
Comment: MACD is above 50 levels and Pairs above its 20MA & 55MA.
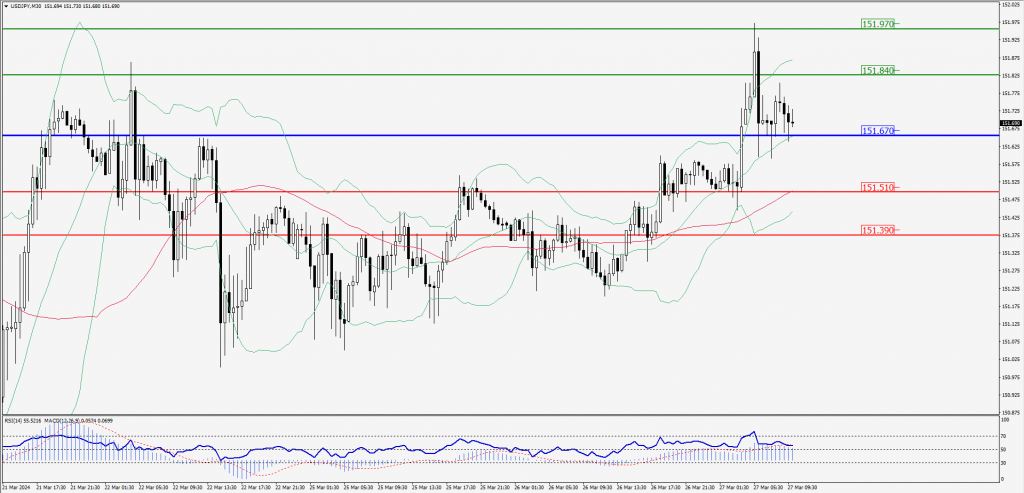
Green Lines Indicate Resistance Levels – Red Lines Indicate Support Levels
Light Blue is a Pivot Point – Black represents the price when the report was produced
AUD/USD Intraday: Trend on the upside
Our pivot point is at 0.65370
Preferable Price Action: Buy positions above pivot with targets at 0.65520 & 0.65640 in extension.
Alternative Price Action: Below pivot looks for a further downside with 0.65220 & 0.65110 as targets.
Comment: RSI is above 50 levels and pairs above 20MA.
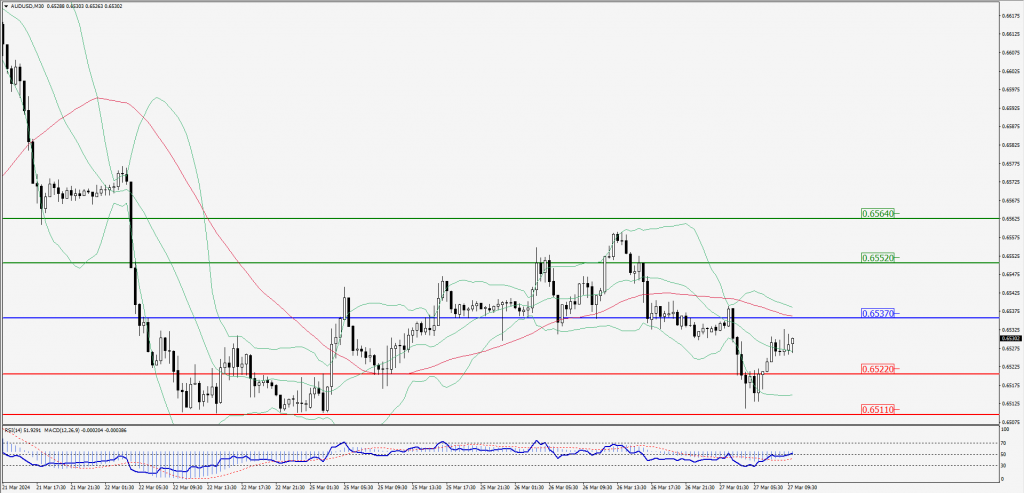
Green Lines Indicate Resistance Levels – Red Lines Indicate Support Levels
Light Blue is a Pivot Point – Black represents the price when the report was produced
CRUDEOIL Intraday: Major trend on the downside
Our pivot point is at 80.77
Preferable Price Action: Below pivot sell oil with 80.45 & 80.20 as targets.
Alternative Price Action: Buy crude above pivot with targets at 81.05 and 81.32 in extension.
Comment: MACD is negative territory and Pairs below its 20MA & 55MA.
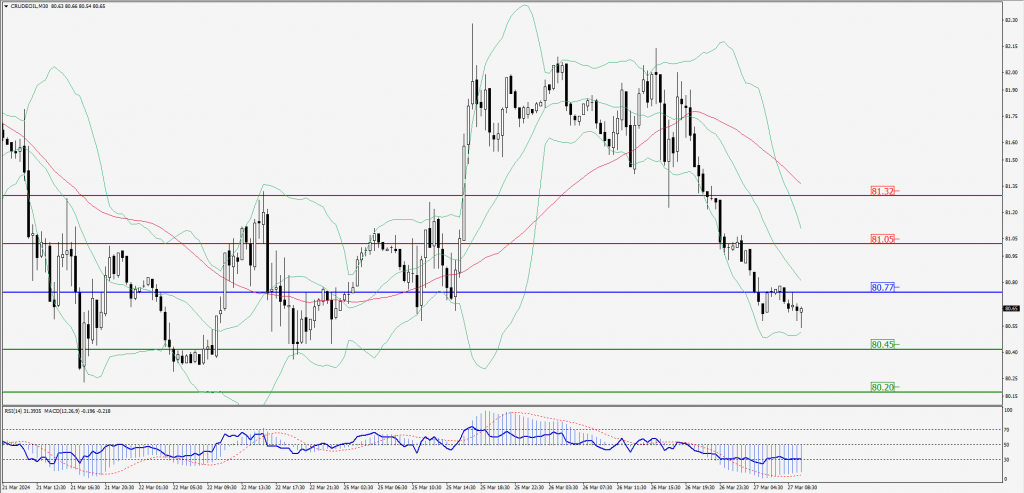
Green Lines Indicate Resistance Levels – Red Lines Indicate Support Levels
Light Blue is a Pivot Point – Black represents the price when the report was produced
XAU/USD Intraday: Support level at 2176.50
Our pivot point is 2176.50
Preferable Price Action: Further upside to 2184.40 and 2191.40.
Alternative Price Action: If the price gives an downside breakout of a pivot, then the price extends to 2168.50 and 2161.80.
Comment: MACD is at 50 level.
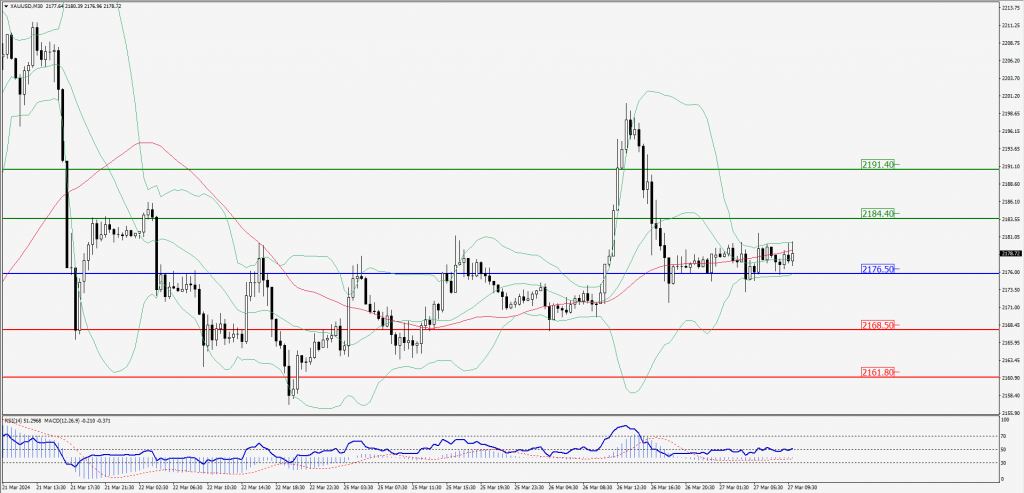
Green Lines Indicate Resistance Levels – Red Lines Indicate Support Levels
Light Blue is a Pivot Point – Black represents the price when the report was produced
Dow Jones Intraday: Trend on the upside
Our pivot point is 39,407.90
Preferable Price Action: Take buy positions above the pivot with targets at 39,512.00 & 39,592.30.
Alternative Price Action: Below 39,407.90 looks for further downside to 39,304.80 & 39,233.40.
Comment: RSI is above 50 levels and Pairs above its 20MA & 55MA.
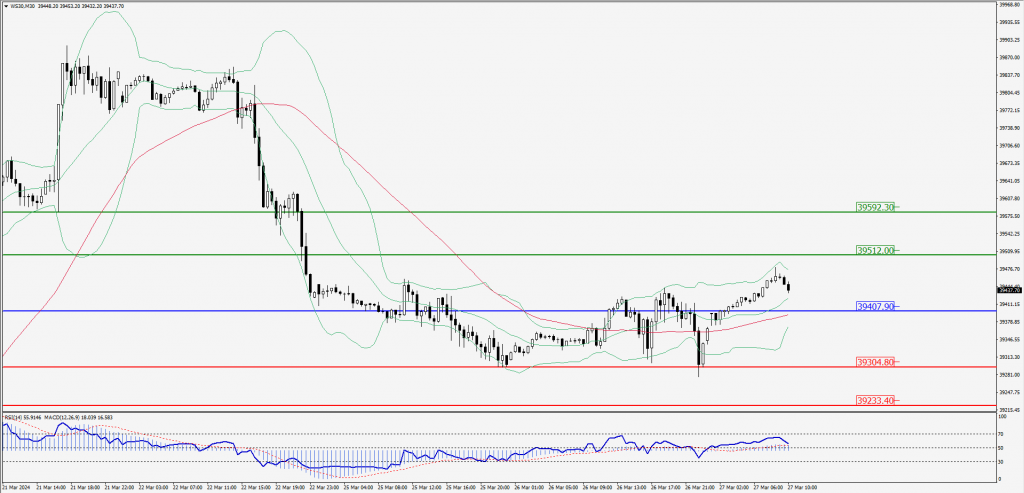
Green Lines Indicate Resistance Levels – Red Lines Indicate Support Levels
Light Blue is a Pivot Point – Black represents the price when the report was produced