Market Wrap: Stocks, Bonds, Commodities
The Dow and S&P 500 edged higher on September 24 and ended a turbulent week with slight increases, helped by gains in Tesla and Facebook that offset a tumble by Nike.
The Dow Jones Industrial Average rose 33.18 points (0.10%) to 34,798, the S&P 500 gained 6.5 points (0.15%) to 4,455.48 and the Nasdaq Composite index flat to 15,047.70.
Asian shares nudged higher on Monday as risk sentiment turned for the better, though a surge in oil prices to three-year highs could inflame inflation fears and aggravate the recent hawkish turn by some major central banks.
MSCI’s index of Asia-Pacific stocks outside Japan lost 0.05% to 808.57 levels. Australian index gained 0.57% to 7,384.20. Japanese market lost 0.05% to 30,240.10.
European stocks were higher on Monday, with the Stoxx Europe 50 Index rose 0.89% to 4,195.95, Germany’s DAX gained 1.03% to 15,693.35, and France’s CAC advance 0.73% to 6,686.93, and U.K.’s FTSE 100 gained 0.93% to 7,117.10.
Benchmark 10-year U.S. Treasury rose as demand for safe assets grows again, today 10-year bond yields lost 0.69% to 1.451.
Oil pushed past its July peaks as global output disruptions forced energy companies to pull large amounts of crude out of inventories, while a shortage of natural gas in Europe pushed costs up across the continent.
Spot Brent crude oil rose 1.17% to $78.14 per barrel. US West Texas Intermediate crude gained 1.15% to $74.83 a barrel.
The yellow metal traded higher 0.32% to 1757.45 dollars per ounce.
Market Wrap: Forex
The dollar was down on Monday in Asia, while the yen, a fellow safe-haven asset, sank to its lowest level in nearly three months.
Today, the U.S. dollar index measures the greenback against a trade-weighted basket of six major currencies, which gained 0.05% to 93.358.
The Euro US Dollar (EUR/USD) is a widely traded pair that slipped 0.08% today. This left the pairing trading around $1.17040.
The Japanese yen fell against the U.S. dollar on Friday as the stock pushes higher. Today US/JPY flat to 110.690 level.
Another commodity-related currency higher against the U.S dollar, AUD/USD gained 0.18% to 0.72700, and NZD/USD flat to 0.70120 level.
EUR/USD Intraday: Resistance at 1.17280
Our pivot point is at 1.17280
Preferable Price Action: Take short positions below pivot level with targets at 1.17020 & 1.1690 in extension.
Alternative Price Action: above pivot looks for a further upside to 1.17550 & 1.17680.
Comment: Pair below its 20MA & 55MA and RSI below 50 levels.
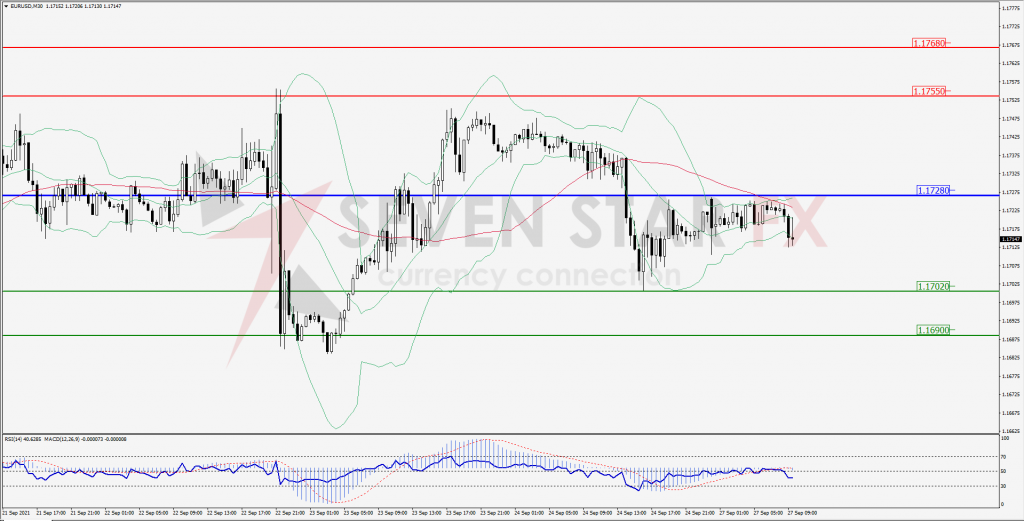
Green Lines Indicate Resistance Levels – Red Lines Indicates Support Levels
Light Blue is a Pivot Point – Black represents the price when the report was produced
GBP/USD Intraday: Resistance at 1.36950
Our pivot point is at 1.36950
Preferable Price Action: Sell positions below pivot with targets at 1.36420 & 1.36090 in extension.
Alternative Price Action: The price above pivot would call for further upside to 1.37480 & 1.37820.
Comment: Pair below its 55MA and RSI below 50 levels.
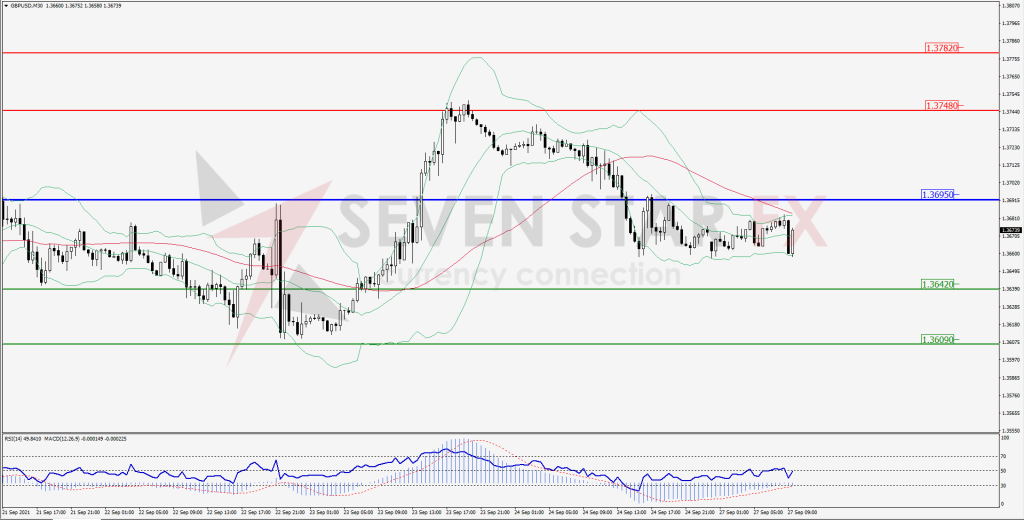
Green Lines Indicate Resistance Levels – Red Lines Indicates Support Levels
Light Blue is a Pivot Point – Black represents the price when the report was produced
USD/JPY Intraday: Strong trend on the upside
Our pivot point is at 110.390
Preferable Price Action: Buy position above pivot with the target at 110.870 and 111.100 in extension.
Alternative Price Action: The downside breakout of the pivot would call for 109.850 and 109.620.
Comment: Price above its 55MA & 20MA and MACD in positive territory.
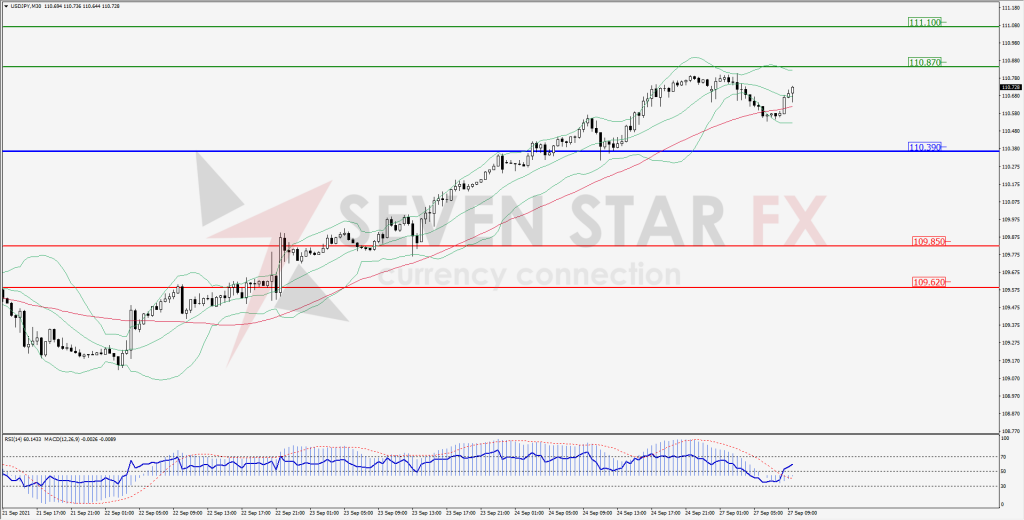
Green Lines Indicate Resistance Levels – Red Lines Indicates Support Levels
Light Blue is a Pivot Point – Black represents the price when the report was produced
AUD/USD Intraday: Major resistance at 0.72890
Our pivot point is at 0.72890
Preferable Price Action: Sell Positions below pivot with targets at 0.72520 & 0.72320 in extension.
Alternative Price Action: Above pivot looks for a further upside with 0.73290 & 0.73490 as targets.
Comment: Pair below its 55MA & 20MA and RSI at 50 levels.
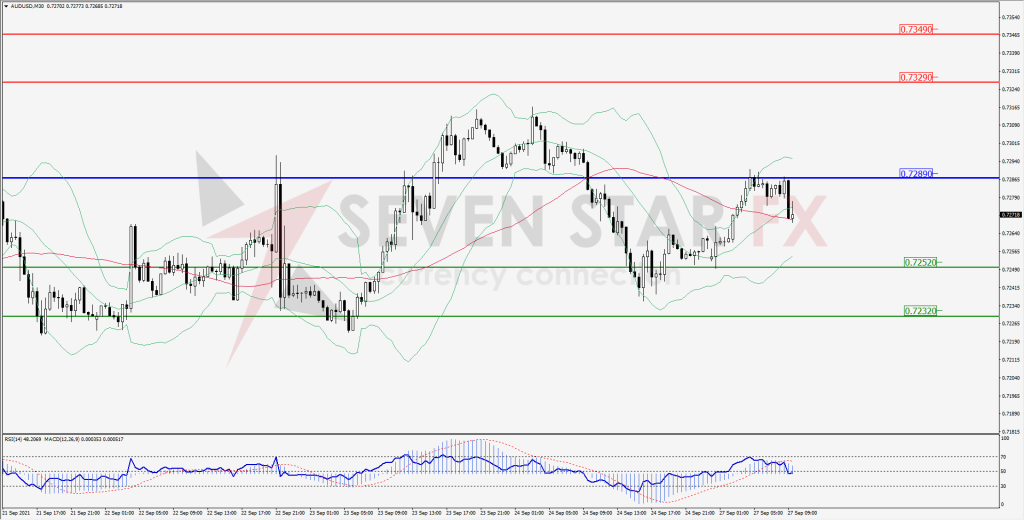
Green Lines Indicate Resistance Levels – Red Lines Indicates Support Levels
Light Blue is a Pivot Point – Black represents the price when the report was produced
CRUDEOIL Intraday: Trend on the upside
Our pivot point is at 73.93
Preferable Price Action: Above pivots buy Oil with 75.54 & 76.33 as targets.
Alternative Price Action: Sell crude below pivot with targets at 72.37 and 71.56 in extension.
Comment: Crude is above its 55MA & 20MA and MACD in the positive territory.
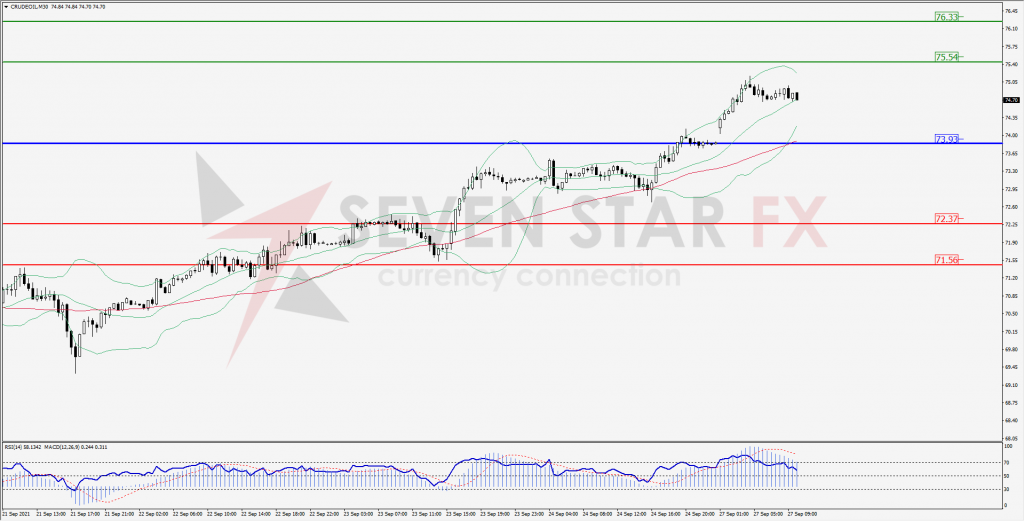
Green Lines Indicate Resistance Levels – Red Lines Indicates Support Levels
Light Blue is a Pivot Point – Black represents the price when the report was produced
XAU/USD Intraday: Break resistance level
Our pivot point is 1752.80
Preferable Price Action: Further upside to 1765.40 and 1771.50.
Alternative Price Action: If the price gives a downside breakout of a pivot, then the price extends to 1740.00 and 1733.40.
Comment: MACD in positive territory and price above its 20MA & 55MA.
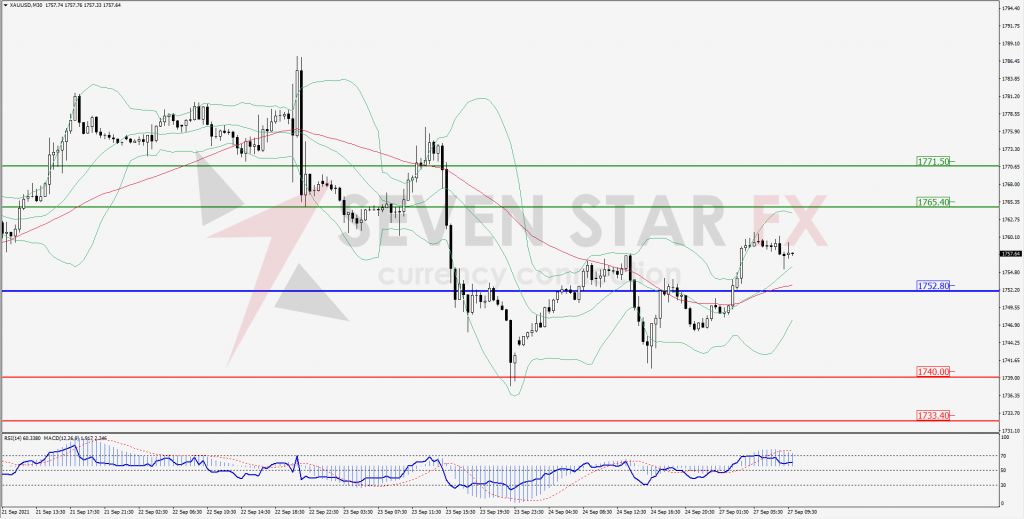
Green Lines Indicate Resistance Levels – Red Lines Indicates Support Levels
Light Blue is a Pivot Point – Black represents the price when the report was produced
Dow Jones Intraday: Support at 34,788.00
Our pivot point is 34,788.00
Preferable Price Action: Take long positions above pivot with targets at 35,172.00 & 35,376.00.
Alternative Price Action: Below 34,788.00 looks for further downside to 34,336.00 & 34,089.00.
Comment: Price above it 20MA & 55MA and RSI above 50 levels.
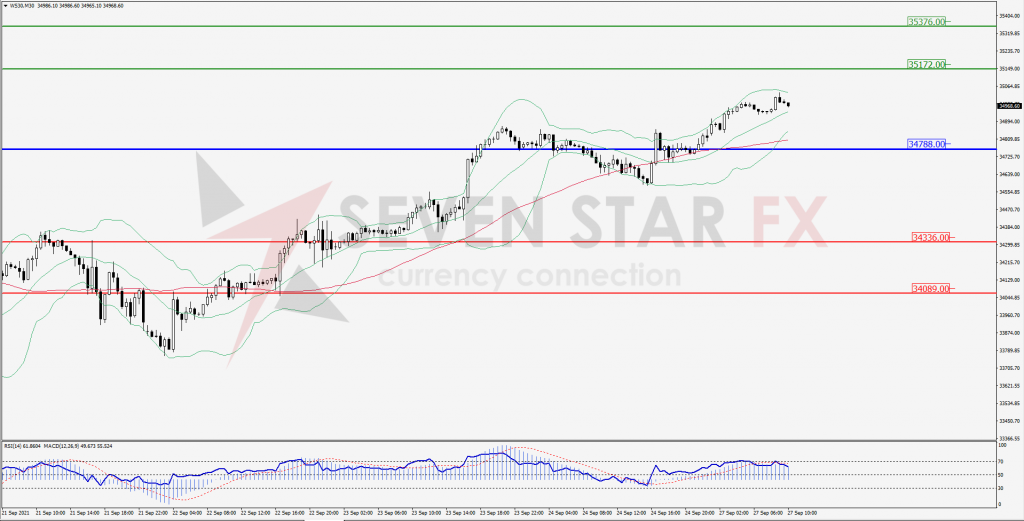
Green Lines Indicate Resistance Levels – Red Lines Indicates Support Levels
Light Blue is a Pivot Point – Black represents the price when the report was produced