Market Wrap: Stocks, Bonds, Commodities
U.S. stocks gained more than 1% on Thursday as investors appeared relieved about the Federal Reserve’s stance on tapering stimulus and raising interest rates.
The Dow Jones Industrial Average rose 506.5 points (1.48%) to 34,764.82, the S&P 500 gained 53.34 points (1.21%) to 4,448.98 and the Nasdaq Composite added 155.40 points (1.04%) to 15,052.24.
Asian shares were on edge on Friday, hurt by persistent uncertainty around the fate of debt-ridden China Evergrande, even as increased risk appetite drove U.S. stocks and Treasury yields higher.
MSCI’s index of Asia-Pacific stocks outside Japan lost 0.21% to 811.47 levels. Australian index fell 0.37% to 7,342.60. Japanese market surged 2.06% to 30,248.81.
European stocks were lower on Friday, with the Stoxx Europe 50 Index lost 0.58% to 4,170.71, Germany’s DAX fell 0.54% to 15,560.05, and France’s CAC down 0.51% to 6,667.76, and U.K.’s FTSE 100 slipped 0.17% to 7,066.62.
Benchmark 10-year U.S. Treasury rose as demand for safe assets grows again, today 10-year bond yields jumped 2.04% to 1.439.
Oil prices rose on Thursday, with Brent crude touching its highest level in more than two months, supported by growing fuel demand and a draw in U.S. crude inventories as production remained hampered in the Gulf of Mexico after two hurricanes.
Spot Brent crude oil rose 0.26% to $77.43 per barrel. US West Texas Intermediate crude gained 0.05% to $73.33 a barrel.
The yellow metal traded higher 0.20% to 1753.30 dollars per ounce.
Market Wrap: Forex
The dollar fell across the board on Thursday as improved risk sentiment in global financial markets wiped out its gains in the previous session after the U.S. Federal Reserve flagged plans to dial back its stimulus this year.
Today, the U.S. dollar index measures the greenback against a trade-weighted basket of six major currencies, which gained 0.16% to 93.183.
The Euro US Dollar (EUR/USD) is a widely traded pair that slipped 0.05% today. This left the pairing trading around $1.17300.
The Japanese yen fell against the U.S. dollar on Friday as the stock pushes higher. Today US/JPY rose 0.20%to 110.520 level.
Another commodity-related currency lower against the U.S dollar, AUD/USD lost 0.23% to 0.72770, and NZD/USD down 0.24% to 0.70490 level.
EUR/USD Intraday: Resistance at 1.17480
Our pivot point is at 1.17480
Preferable Price Action: Take short positions below pivot level with targets at 1.17210 & 1.17060 in extension.
Alternative Price Action: above pivot looks for a further upside to 1.17760 & 1.17920.
Comment: Pair below its 20MA & 55MA and RSI below 50 levels.
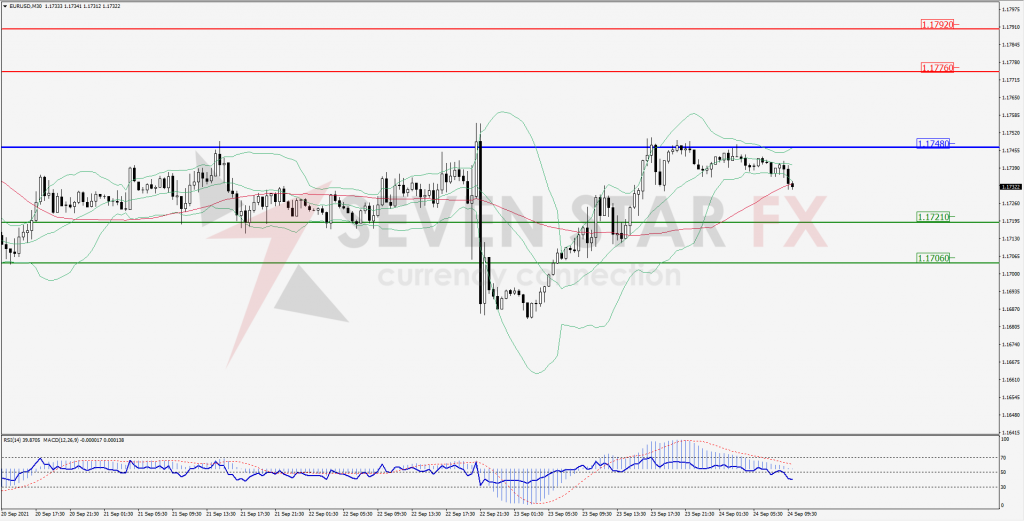
Green Lines Indicate Resistance Levels – Red Lines Indicates Support Levels
Light Blue is a Pivot Point – Black represents the price when the report was produced
GBP/USD Intraday: Support at 1.36880
Our pivot point is at 1.36880
Preferable Price Action: Buy positions above pivot with targets at 1.37600 & 1.37920 in extension.
Alternative Price Action: The price below pivot would call for further downside to 1.36140 & 1.35800.
Comment: Pair above its 55MA and RSI below 50 levels.
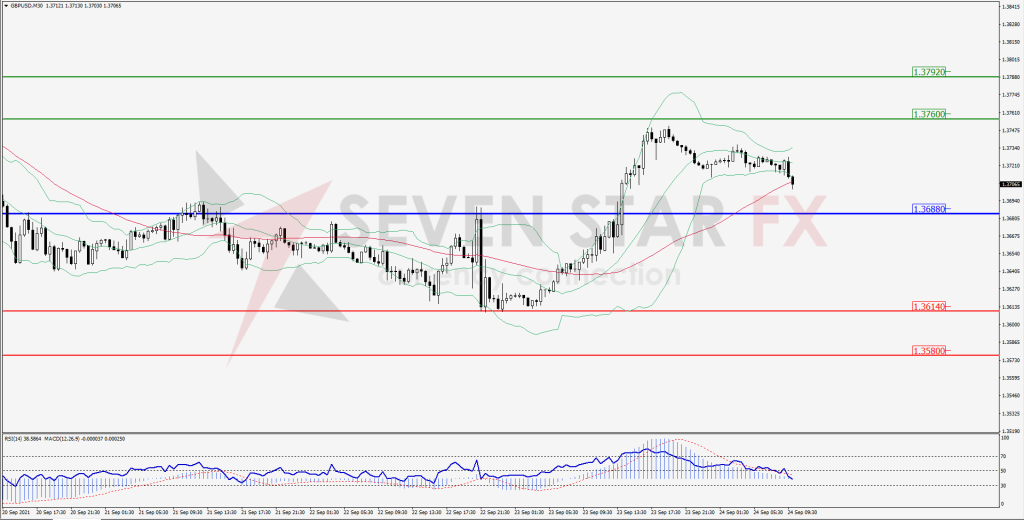
Green Lines Indicate Resistance Levels – Red Lines Indicates Support Levels
Light Blue is a Pivot Point – Black represents the price when the report was produced
USD/JPY Intraday: Strong trend on the upside
Our pivot point is at 110.280
Preferable Price Action: Buy position above pivot with the target at 110.770 and 111.000 in extension.
Alternative Price Action: The downside breakout of the pivot would call for 109.810 and 109.560.
Comment: Price above its 55MA & 20MA and MACD in positive territory.
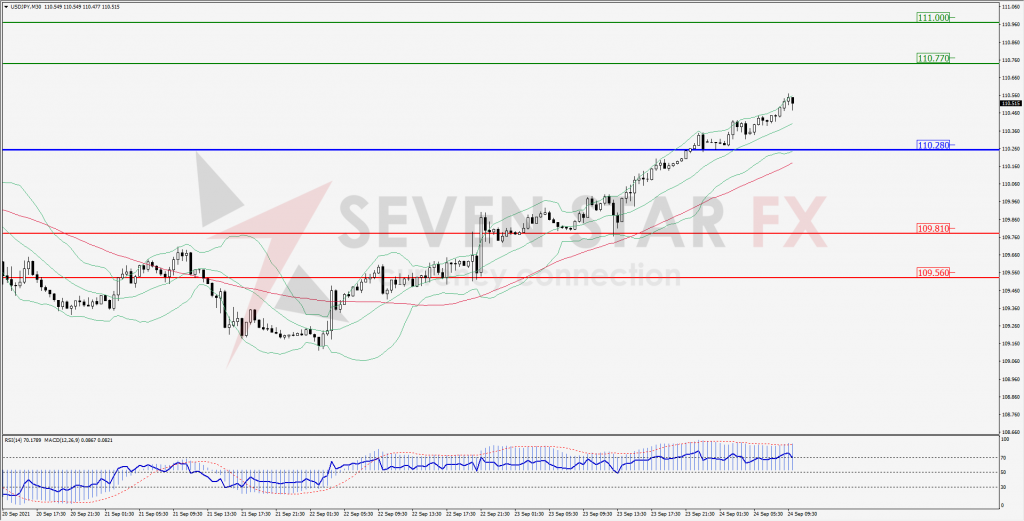
Green Lines Indicate Resistance Levels – Red Lines Indicates Support Levels
Light Blue is a Pivot Point – Black represents the price when the report was produced
AUD/USD Intraday: Break support zone
Our pivot point is at 0.73100
Preferable Price Action: Sell Positions below pivot with targets at 0.72650 & 0.72400 in extension.
Alternative Price Action: Above pivot looks for a further upside with 0.73540 & 0.73790 as targets.
Comment: Pair below its 55MA & 20MA and RSI below 50 levels.
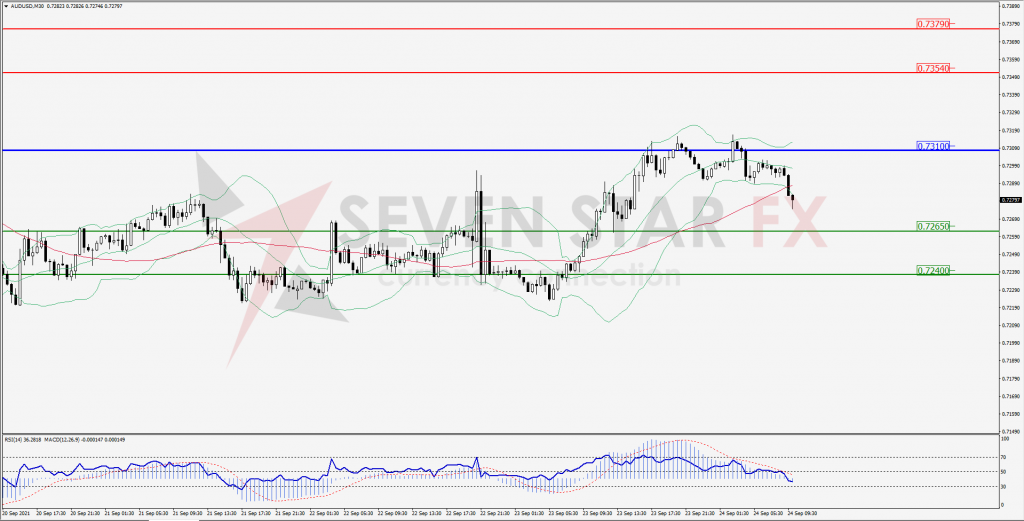
Green Lines Indicate Resistance Levels – Red Lines Indicates Support Levels
Light Blue is a Pivot Point – Black represents the price when the report was produced
CRUDEOIL Intraday: Support at 72.25
Our pivot point is at 72.25
Preferable Price Action: Above pivots buy Oil with 74.00 & 74.82 as targets.
Alternative Price Action: Sell crude below pivot with targets at 70.62 and 69.81 in extension.
Comment: Crude is above its 55MA & 20MA and MACD in the positive territory.
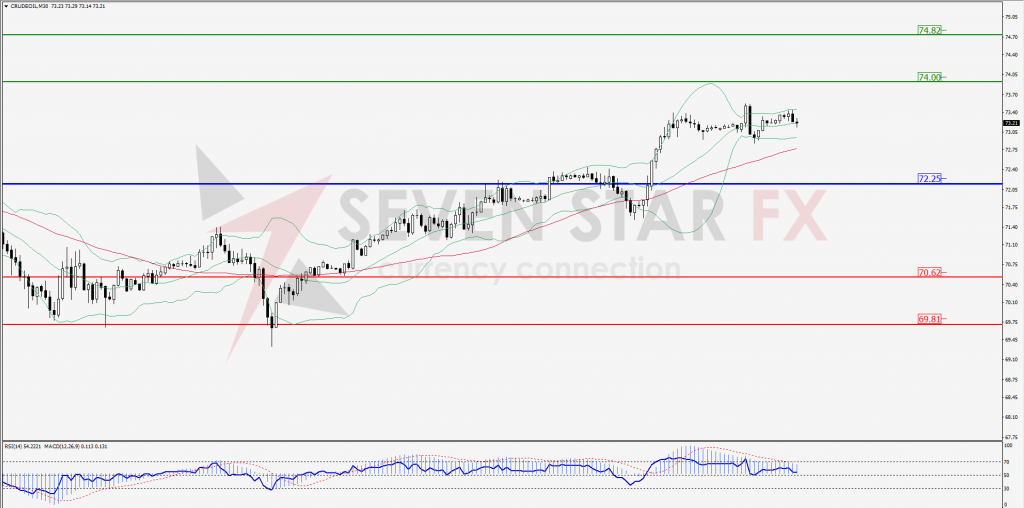
Green Lines Indicate Resistance Levels – Red Lines Indicates Support Levels
Light Blue is a Pivot Point – Black represents the price when the report was produced
XAU/USD Intraday: Resistance at 1760.40
Our pivot point is 1760.40
Preferable Price Action: Further downside to 1747.30 and 1741.50.
Alternative Price Action: If the price gives an upside breakout of a pivot, then the price extends to 1772.70 and 1778.80.
Comment: MACD in negative territory and price below its 55MA.
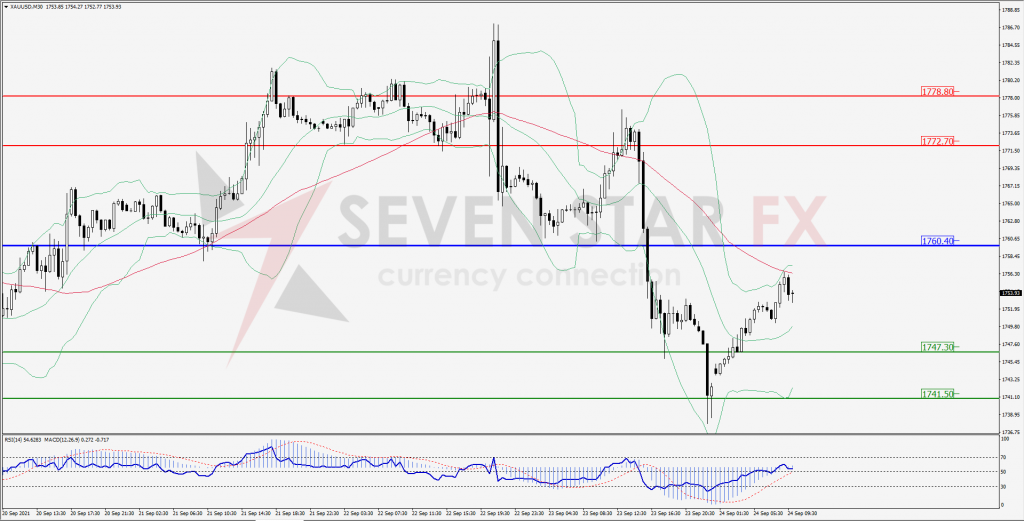
Green Lines Indicate Resistance Levels – Red Lines Indicates Support Levels
Light Blue is a Pivot Point – Black represents the price when the report was produced
Dow Jones Intraday: Support at 34,522.00
Our pivot point is 34,522.00
Preferable Price Action: Take long positions above pivot with targets at 34,855.00 & 34,031.00.
Alternative Price Action: Below 34,522.00 looks for further downside to 34,148.00 & 33,965.00.
Comment: Price above it 55MA and RSI below 50 levels.
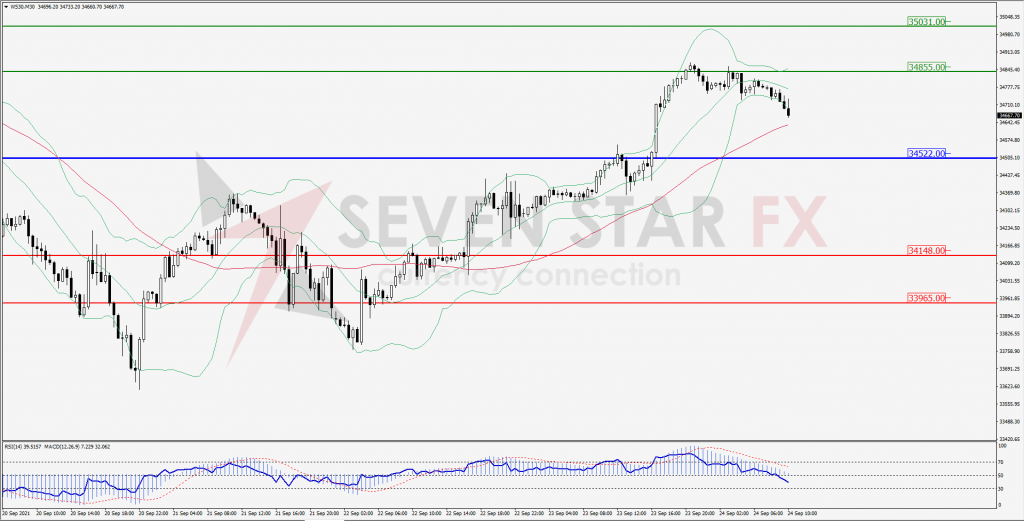
Green Lines Indicate Resistance Levels – Red Lines Indicates Support Levels
Light Blue is a Pivot Point – Black represents the price when the report was produced