Market Wrap: Stocks, Bonds, Commodities
Stock futures were modestly higher Monday night as investors looked toward the next batch of economic data and readied for the end of June and the second quarter.
The Dow Jones Industrial Average fell 12.72 points to 33,714.71, the S&P 500 lose 0.45% to 4,328.82 and the Nasdaq Composite subtract 156.74 points to 13,335.78.
MSCI’s index of Asia-Pacific stocks outside Japan is advance 0.83% to 635.02 levels. The Australian index was higher by 0.56% to 7,118.20. Japanese Nikkei Index decline 0.49% today.
European stocks were mixed on Tuesday, with the Stoxx Europe 50 Index rose 0.14% to 4,286.45, Germany’s DAX decline 0.13% to 15,792.95, and France’s CAC drop 0.02% to 7,182.90 and U.K.’s FTSE 100 add 0.02% to 7,455.34.
Benchmark 10-year U.S. Treasury fell as demand for safe assets ascend again, today 10-year bond yields positive 0.54% to 3.7390.
Oil prices pared early gains on Monday, tracking a broader calm in financial markets as investors watched warily to see if there’ll be further fallout from an attempted insurrection in Russia that could disrupt energy supplies from one of the world’s largest oil producer nations.
Spot Brent crude oil drop 0.26% to $74.16 per barrel. US West Texas Intermediate crude is down 0.27% to $69.19 a barrel.
The yellow metal gold is advance 0.05% to 1,934.70 dollars per ounce.
Market Wrap: Forex
The U.S. dollar held firm against major currencies on Tuesday as tension simmered in Russia and traders looked ahead to U.S. data that may determine the timing of further interest rate hikes.
Today, the U.S. dollar index measures the Greenback against a trade-weighted basket of six major currencies, which slipped 0.09% to 102.230.
The Euro US Dollar (EUR/USD) is a widely traded pair that is up 0.28% today. This left the pair trading around $1.09340.
The Japanese yen was negative against the U.S. dollar on Tuesday. Today USD/JPY is surged 0.14% to the 143.690 level.
Another commodity-related currency positive against the U.S dollar, AUD/USD rose 0.25% to 0.66870, and NZD/USD surged 0.13% to 0.61730 level.
EUR/USD Intraday: Trend on the upside
Our pivot point is at 1.09300
Preferable Price Action: Take buy positions above pivot level with targets at 1.09600 & 1.09800 in extension.
Alternative Price Action: Below pivot looks for a further downside to 1.09040 & 1.08860.
Comment: RSI is above 50 levels and Pairs above its 20MA & 55MA.
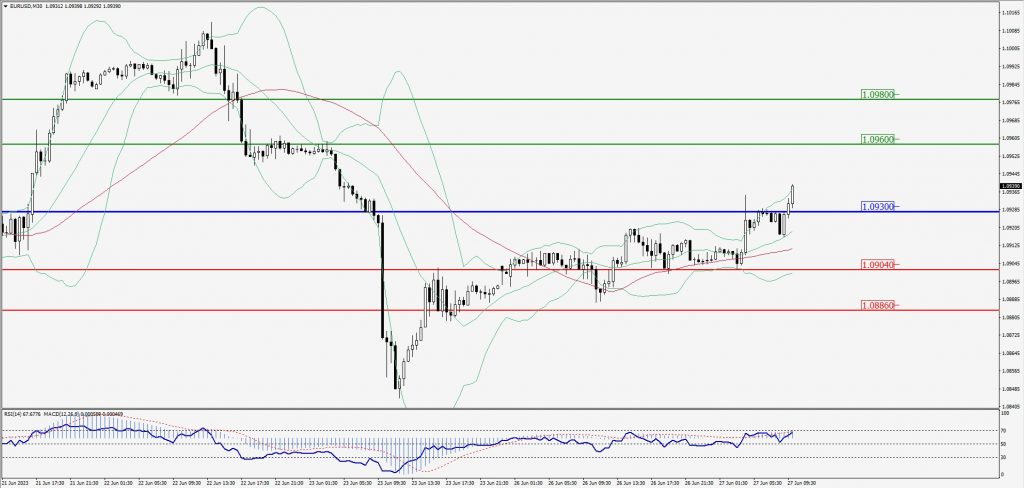
Green Lines Indicate Resistance Levels – Red Lines Indicate Support Levels
Light Blue is a Pivot Point – Black represents the price when the report was produced
GBP/USD Intraday: Trend on the upside
Our pivot point is at 1.27370
Preferable Price Action: Buy positions above pivot with targets at 1.27670 & 1.27880 in extension.
Alternative Price Action: The price below pivot would call for further downside to 1.27110 & 1.26950.
Comment: RSI is above 50 levels and Pairs above its 20MA & 55MA.
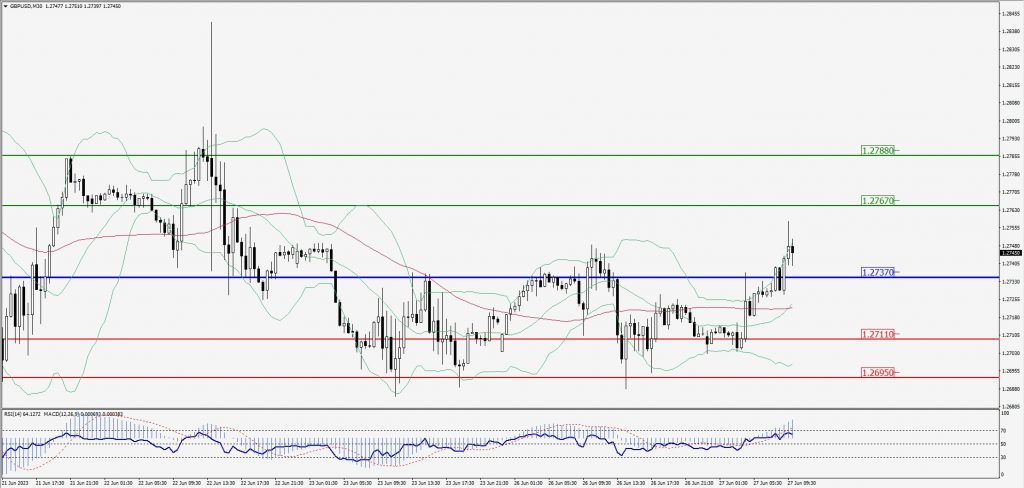
Green Lines Indicate Resistance Levels – Red Lines Indicate Support Levels
Light Blue is a Pivot Point – Black represents the price when the report was produced
USD/JPY Intraday: Support level at 143.420
Our pivot point is at 143.420
Preferable Price Action: Buy position above pivot with the target at 143.810 and 144.080 in extension.
Alternative Price Action: The downside breakout of the pivot would call for 143.060 and 142.820.
Comment: MACD is above 50 level and Pairs above 55MA.
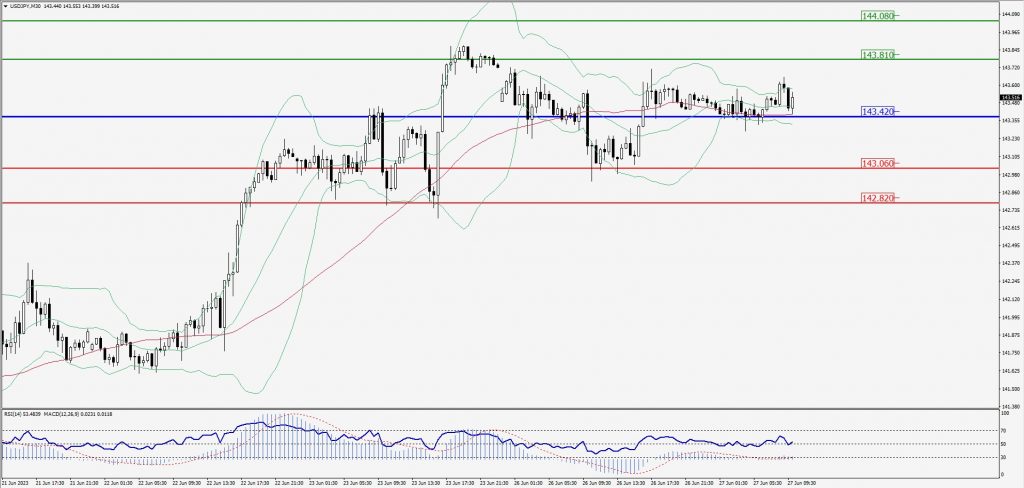
Green Lines Indicate Resistance Levels – Red Lines Indicate Support Levels
Light Blue is a Pivot Point – Black represents the price when the report was produced
AUD/USD Intraday: Major trend on the upside
Our pivot point is at 0.67070
Preferable Price Action: Buy positions above pivot with targets at 0.67330 & 0.67500 in extension.
Alternative Price Action: Below pivot looks for a further downside with 0.66830 & 0.66680 as targets.
Comment: RSI is above 50 levels and Pairs above its 20MA & 55MA.
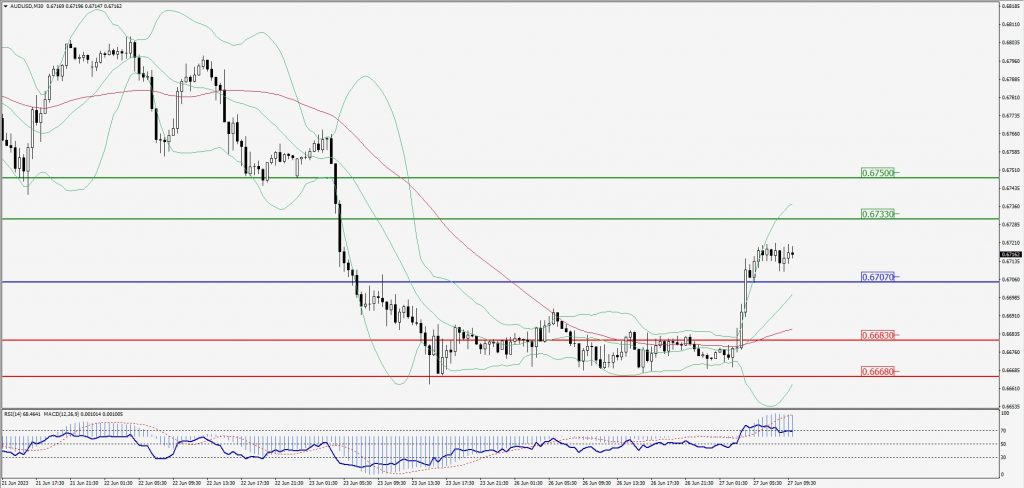
Green Lines Indicate Resistance Levels – Red Lines Indicate Support Levels
Light Blue is a Pivot Point – Black represents the price when the report was produced
CRUDEOIL Intraday: Trend on the upside
Our pivot point is at 69.48
Preferable Price Action: Above pivot buy oil with 70.49 & 71.21 as targets.
Alternative Price Action: Sell crude below pivot with targets at 68.68 and 68.12 in extension.
Comment: MACD is positive territory and Pairs above its 20MA & 55MA.
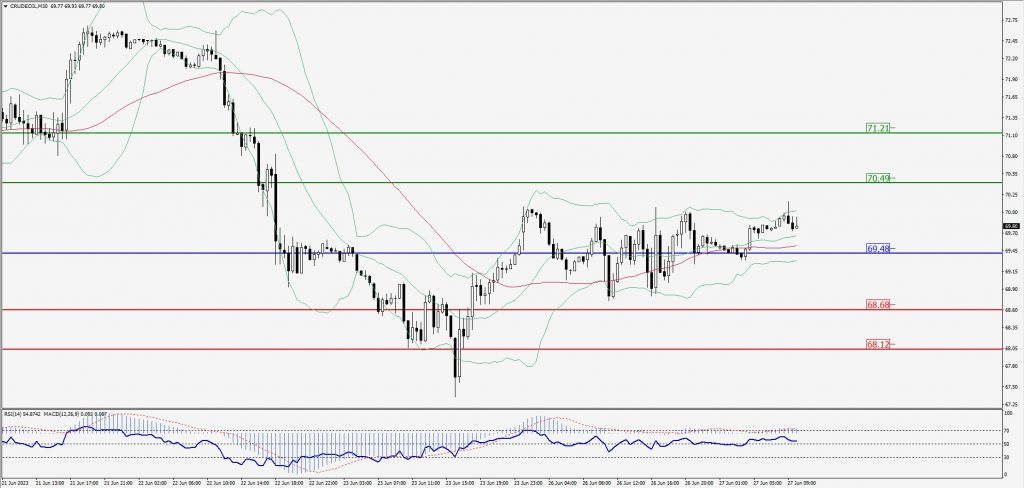
Green Lines Indicate Resistance Levels – Red Lines Indicate Support Levels
Light Blue is a Pivot Point – Black represents the price when the report was produced
XAU/USD Intraday: Trend on the upside
Our pivot point is 1927.20
Preferable Price Action: Further upside to 1934.00 and 1939.60
Alternative Price Action: If the price gives a downside breakout of a pivot, then the price extends to 1920.70 and 1916.10.
Comment: MACD is above 50 level and Pairs above its 20MA & 55MA.
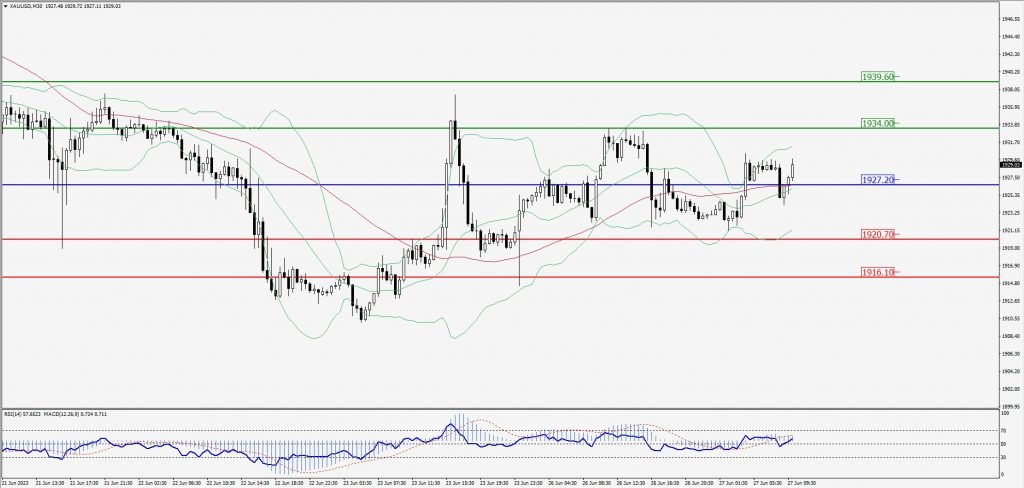
Green Lines Indicate Resistance Levels – Red Lines Indicate Support Levels
Light Blue is a Pivot Point – Black represents the price when the report was produced
Dow Jones Intraday: Trend on the upside
Our pivot point is 33,790.00
Preferable Price Action: Take buy positions above the pivot with targets at 33,873.00 & 33,939.00.
Alternative Price Action: Below 33,790.00 looks for further downside to 33,724.00 & 33,675.00.
Comment: RSI is above 50 levels and Pairs above its 20MA & 55MA.
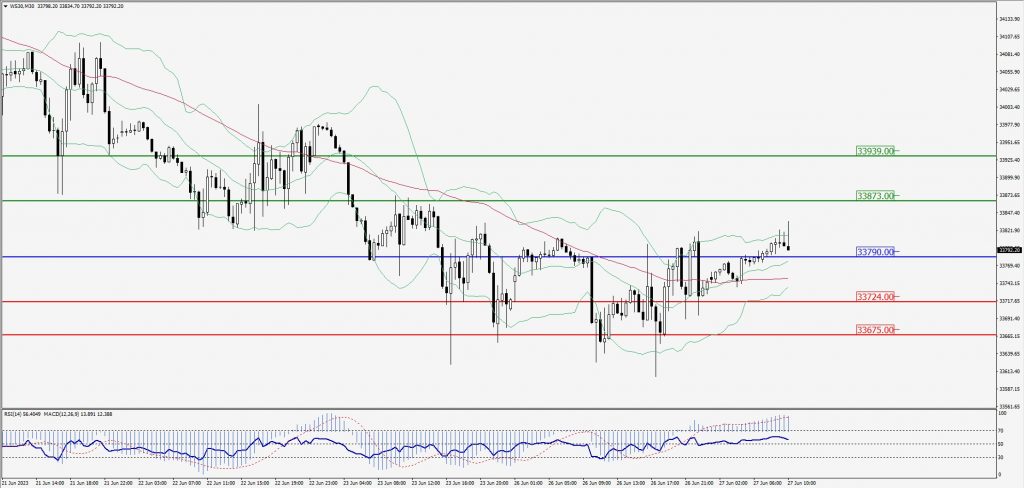
Green Lines Indicate Resistance Levels – Red Lines Indicate Support Levels
Light Blue is a Pivot Point – Black represents the price when the report was produced