Market Wrap: Stocks, Bonds, Commodities
Stock futures were flat on Sunday evening as Wall Street looked to see if the market rally could find more momentum in the final week of June.
The Dow Jones Industrial Average fell 219.28 points to 33,727.43, the S&P 500 lose 0.77% to 4,348.33 and the Nasdaq Composite subtract 138.09 points to 13,492.52.
MSCI’s index of Asia-Pacific stocks outside Japan is decline 0.30% to 630.18 levels. The Australian index was lower by 0.29% to 7,078.70. Japanese Nikkei Index decline 0.25% today.
European stocks were negative on Monday, with the Stoxx Europe 50 Index fell 0.32% to 4,257.85, Germany’s DAX decline 0.23% to 15,795.55, and France’s CAC drop 0.39% to 7,135.60 and U.K.’s FTSE 100 subtract 0.44% to 7,429.30.
Benchmark 10-year U.S. Treasury fell as demand for safe assets ascend again, today 10-year bond yields negative 1.29% to 3.6910.
Oil prices fell on Friday, headed for a weekly decline as traders worried interest rate hikes could sap demand despite signs of tighter supplies including lower US crude stocks.
Spot Brent crude oil drop 0.16% to $73.89 per barrel. US West Texas Intermediate crude is down 0.25% to $68.97 a barrel.
The yellow metal gold is advance 0.68% to 1,942.45 dollars per ounce.
Market Wrap: Forex
The dollar was on the back foot on Monday, though it found some safe haven support on lingering worries that the protracted monetary tightening cycles from major central banks would further hurt the global economic outlook.
Today, the U.S. dollar index measures the Greenback against a trade-weighted basket of six major currencies, which slipped 0.10% to 102.440.
The Euro US Dollar (EUR/USD) is a widely traded pair that is up 0.01% today. This left the pair trading around $1.08900.
The Japanese yen was negative against the U.S. dollar on Monday. Today USD/JPY is slipped 0.39% to the 143.120 level.
Another commodity-related currency mixed against the U.S dollar, AUD/USD fell 0.01% to 0.66760, and NZD/USD surged 0.36% to 0.61630 level.
EUR/USD Intraday: Trend on the upside
Our pivot point is at 1.08970
Preferable Price Action: Take buy positions above pivot level with targets at 1.09260 & 1.09500 in extension.
Alternative Price Action: Below pivot looks for a further downside to 1.08660 & 1.08440.
Comment: RSI is above 50 levels and Pairs above 55MA.
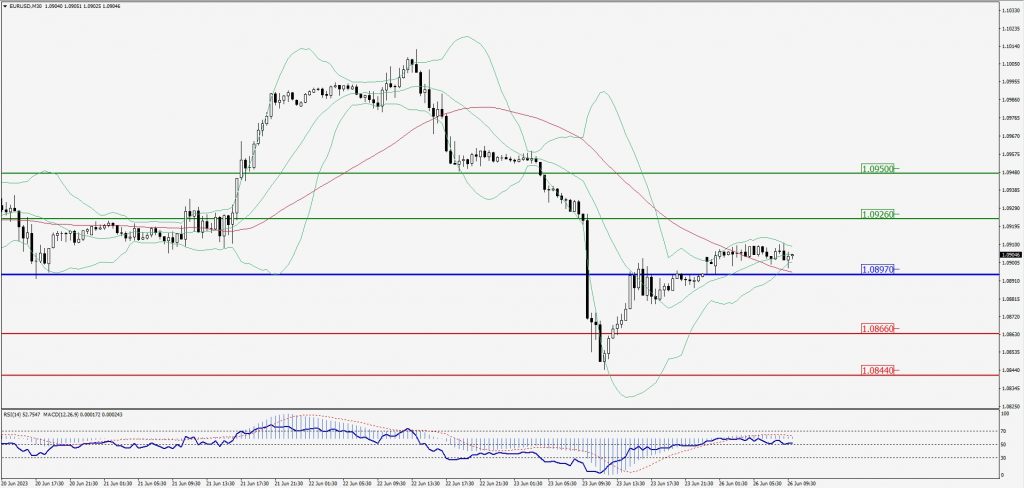
Green Lines Indicate Resistance Levels – Red Lines Indicate Support Levels
Light Blue is a Pivot Point – Black represents the price when the report was produced
GBP/USD Intraday: Resistance level at 1.27360
Our pivot point is at 1.27360
Preferable Price Action: Sell positions below pivot with targets at 1.27020 & 1.26810 in extension.
Alternative Price Action: The price above pivot would call for further upside to 1.27640 & 1.27850.
Comment: RSI is below 50 levels and Pairs below 20MA.
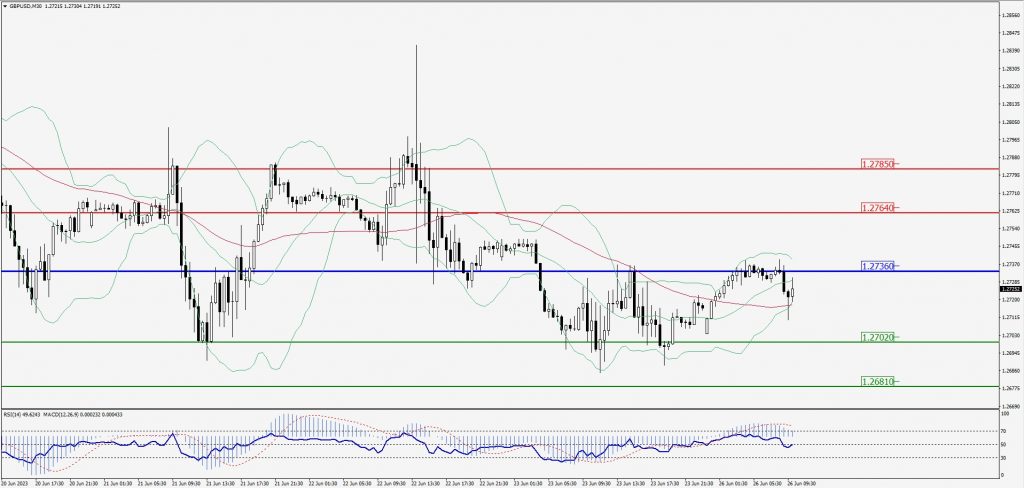
Green Lines Indicate Resistance Levels – Red Lines Indicate Support Levels
Light Blue is a Pivot Point – Black represents the price when the report was produced
USD/JPY Intraday: In a consolidation zone
Our pivot point is at 143.340
Preferable Price Action: Buy position above pivot with the target at 143.870 and 144.250 in extension.
Alternative Price Action: The downside breakout of the pivot would call for 142.850 and 142.500.
Comment: MACD is at 50 level and Pairs above 55MA.
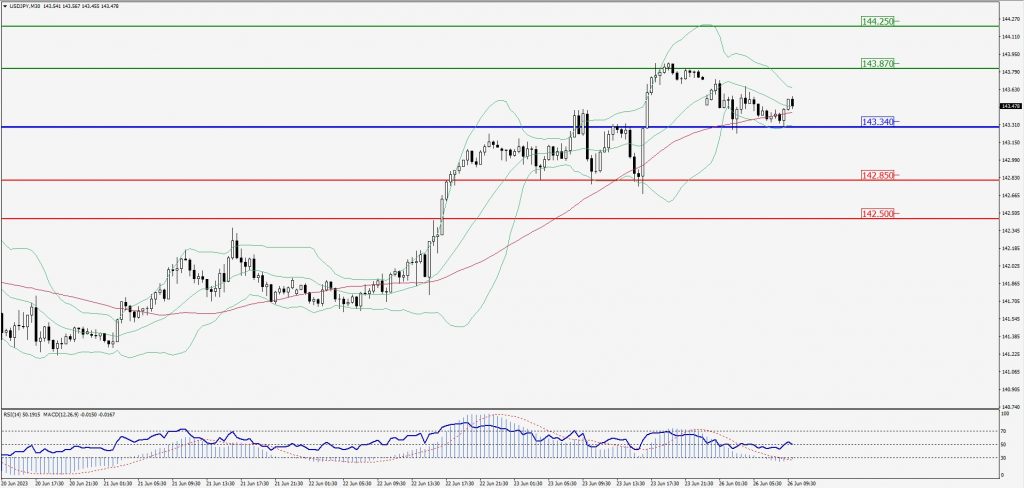
Green Lines Indicate Resistance Levels – Red Lines Indicate Support Levels
Light Blue is a Pivot Point – Black represents the price when the report was produced
AUD/USD Intraday: Trend on the downside
Our pivot point is at 0.66960
Preferable Price Action: Sell positions below pivot with targets at 0.66480 & 0.66170 in extension.
Alternative Price Action: Above pivot looks for a further upside with 0.67370 & 0.67680 as targets.
Comment: RSI is below 50 levels and Pairs below its 20MA & 55MA.
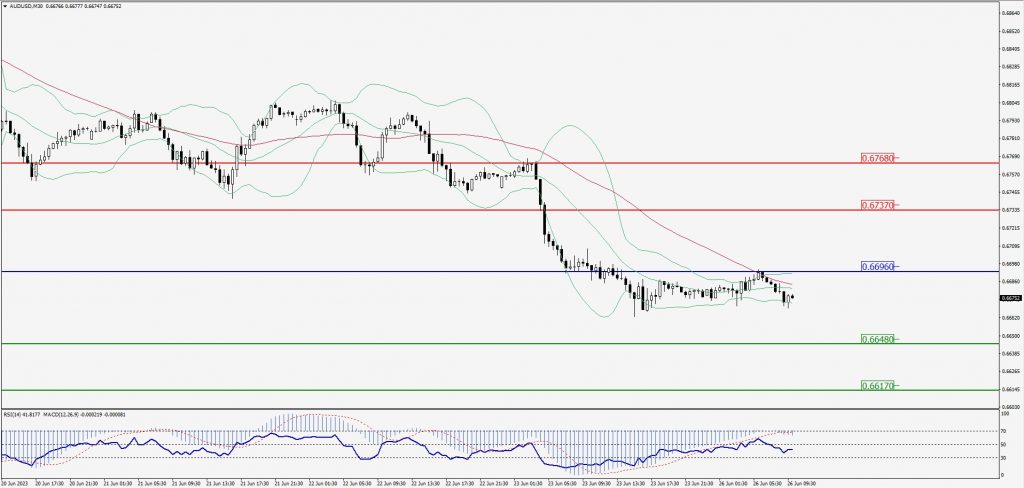
Green Lines Indicate Resistance Levels – Red Lines Indicate Support Levels
Light Blue is a Pivot Point – Black represents the price when the report was produced
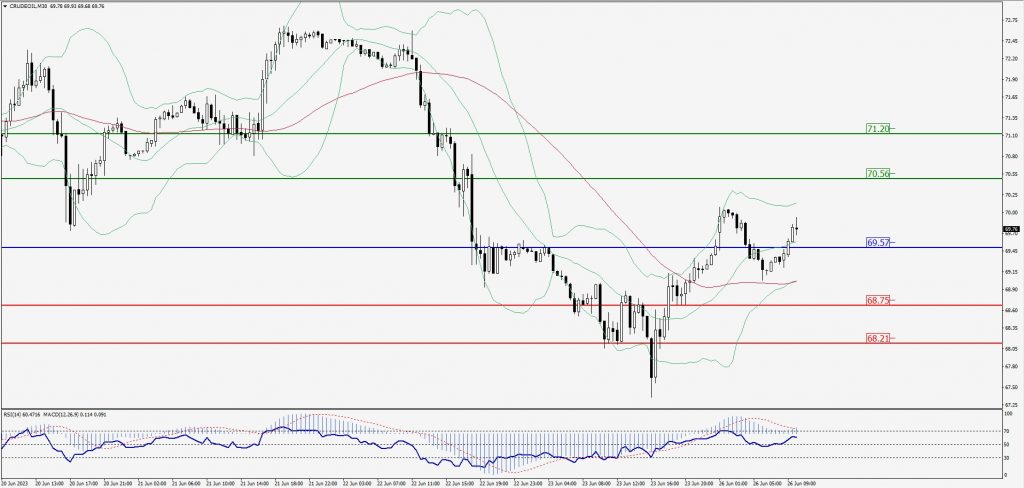
CRUDEOIL Intraday: Trend on the upside
Our pivot point is at 69.57
Preferable Price Action: Above pivot buy oil with 70.56 & 71.20 as targets.
Alternative Price Action: Sell0 crude below pivot with targets at 68.75 and 68.21 in extension.
Comment: MACD is positive territory and Pairs above its 20MA & 55MA.
Green Lines Indicate Resistance Levels – Red Lines Indicate Support Levels
Light Blue is a Pivot Point – Black represents the price when the report was produced
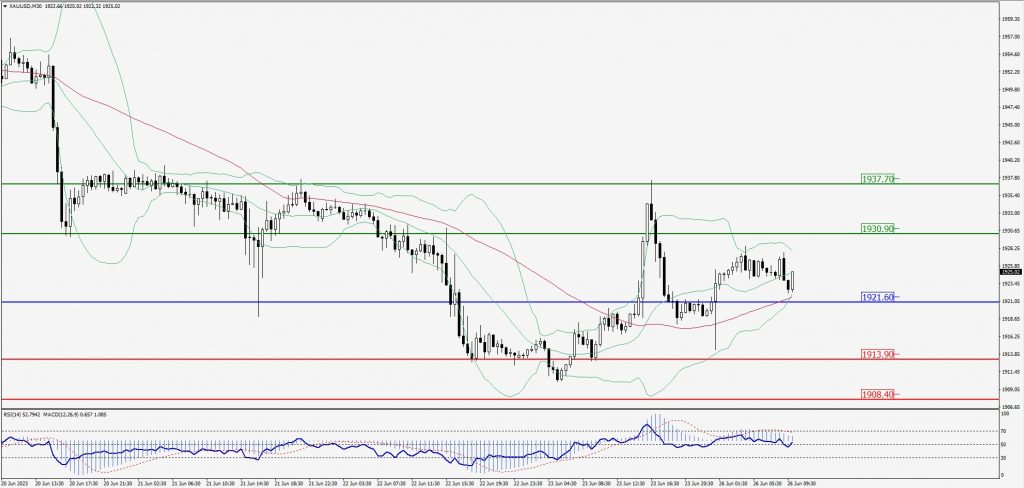
XAU/USD Intraday: Trend on the upside
Our pivot point is 1921.60
Preferable Price Action: Further upside to 1930.90 and 1937.70
Alternative Price Action: If the price gives a downside breakout of a pivot, then the price extends to 1913.90 and 1908.40.
Comment: MACD is above 50 level and Pairs above 55MA.
Green Lines Indicate Resistance Levels – Red Lines Indicate Support Levels
Light Blue is a Pivot Point – Black represents the price when the report was produced
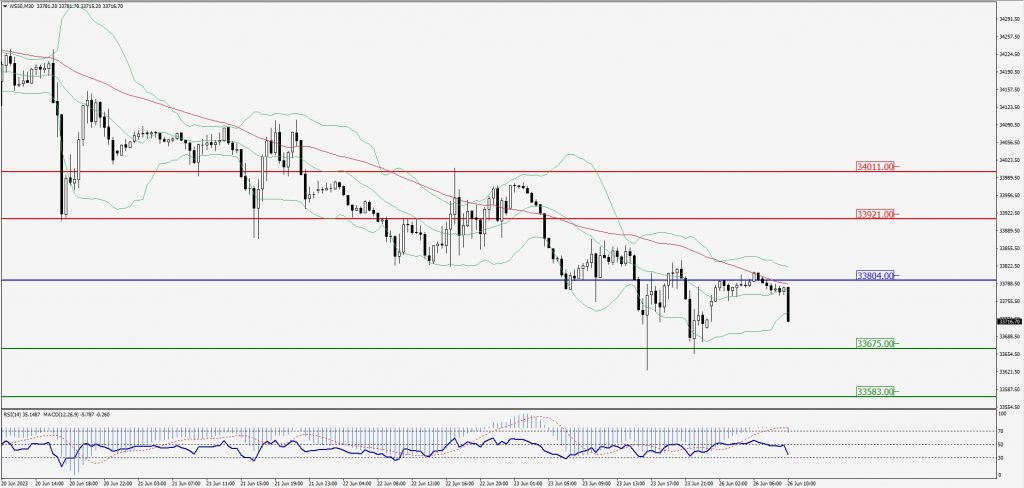
Dow Jones Intraday: Trend on the downside
Our pivot point is 33,804.00
Preferable Price Action: Take sell positions below the pivot with targets at 33,675.00 & 33,583.00.
Alternative Price Action: Above 33,804.00 looks for further upside to 33,921.00 & 34,011.00.
Comment: RSI is below 50 levels and Pairs below its 20MA & 55MA.
Green Lines Indicate Resistance Levels – Red Lines Indicate Support Levels
Light Blue is a Pivot Point – Black represents the price when the report was produced