Market Wrap: Stocks, Bonds, Commodities
US stocks lost ground at the start of a holiday-shortened week on Monday as investors positioned themselves ahead of inflation data.
The Dow Jones Industrial Average fell 162.26 points to 39,313.64, the S&P 500 lose 0.31% to 5,218.19 and the Nasdaq Composite slipped 44.35 points to 16,384.47.
MSCI’s index of Asia-Pacific stocks outside Japan is advance 0.60% to 655.01 levels. The Australian index was lower by 0.41% to 7,780.20. Japanese Nikkei Index ascend 0.12% today.
European stocks were mixed on Tuesday, with the Stoxx Europe 50 Index rose 0.12% to 5,050.15, Germany’s DAX ascend 0.22% to 18,307.85, and France’s CAC advance 0.04% to 8,154.78 and U.K.’s FTSE 100 subtarct 0.10% to 7,909.47.
Benchmark 10-year U.S. Treasury fell as demand for safe assets drop again, today 10-year bond yields negative 0.38% to 4.2350.
Oil prices rose more than 1 percent on Monday as hostilities intensified between Russia and Ukraine and in the Middle East.
Spot Brent crude oil ascend 0.07% to $86.15 per barrel. US West Texas Intermediate crude is up 0.12% to $82.06 a barrel.
The yellow metal gold is advance 0.37% to 2,184.55 dollars per ounce.
Market Wrap: Forex
The dollar was on the back foot on Tuesday, owing to profit taking and pressured in part by a slightly stronger yen as Japanese government officials continued with their jawboning to defend the currency.
Today, the U.S. dollar index measures the Greenback against a trade-weighted basket of six major currencies, which slipped 0.14% to 103.785.
The Euro US Dollar (EUR/USD) is a widely traded pair that is up 0.16% today. This left the pair trading around $1.08530.
The Japanese yen was negative against the U.S. dollar on Tuesday. Today USD/JPY is slipped 0.11% to the 151.250 level.
Another commodity-related currency positive against the U.S dollar, AUD/USD rose 0.21% to 0.65520, and NZD/USD surged 0.41% to 0.60260 level.
EUR/USD Intraday: Trend on the upside
Our pivot point is at 1.08450
Preferable Price Action: Take buy positions above pivot level with targets at 1.08690 & 1.08870 in extension.
Alternative Price Action: Below pivot looks for a further downside to 1.08220 & 1.08050.
Comment: RSI is above 50 levels and Pairs above its 20MA & 55MA.
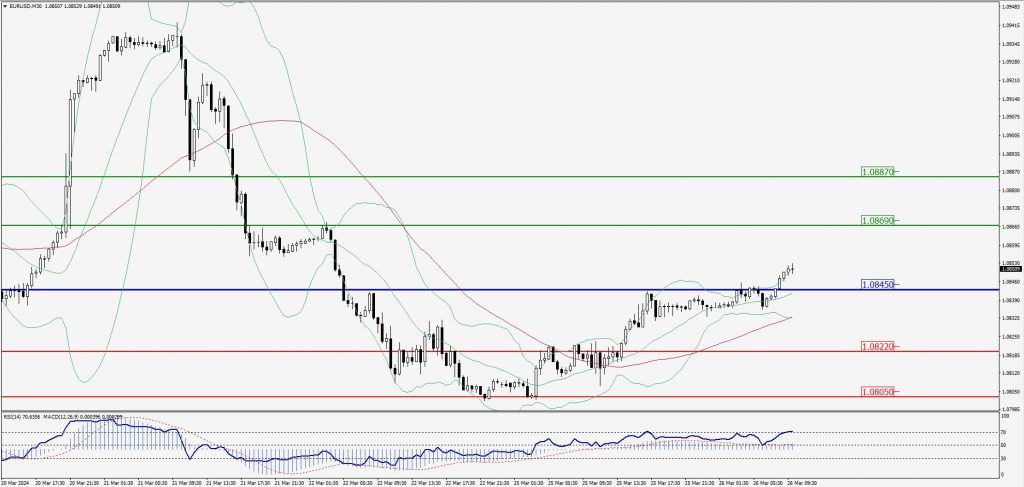
Green Lines Indicate Resistance Levels – Red Lines Indicate Support Levels
Light Blue is a Pivot Point – Black represents the price when the report was produced
GBP/USD Intraday: Major support level at 1.26380
Our pivot point is at 1.26380
Preferable Price Action: Buy positions above pivot with targets at 1.26820 & 1.27100 in extension.
Alternative Price Action: The price below pivot would call for further downside to 1.26000 & 1.25780.
Comment: RSI is above 50 levels and Pairs above its 20MA & 55MA.
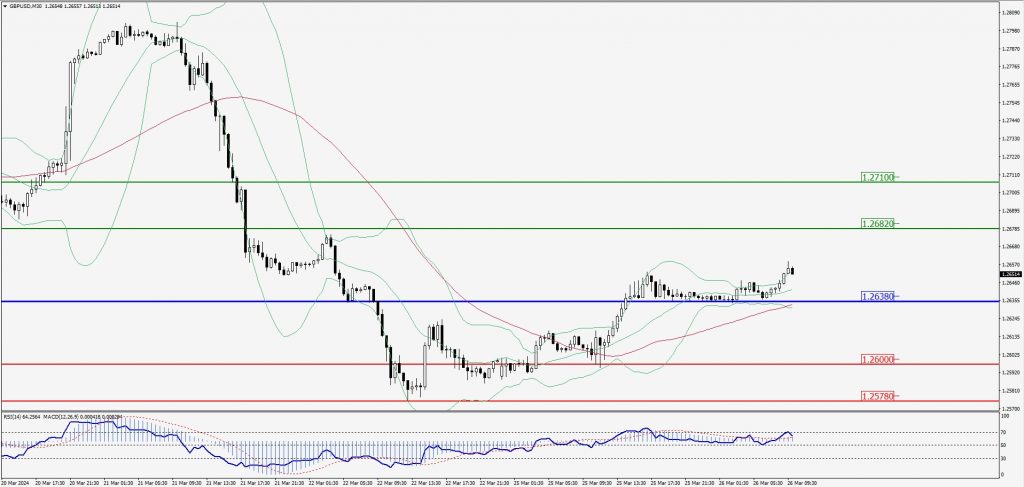
Green Lines Indicate Resistance Levels – Red Lines Indicate Support Levels
Light Blue is a Pivot Point – Black represents the price when the report was produced
USD/JPY Intraday: Major resistance level at 151.450
Our pivot point is at 151.450
Preferable Price Action: Sell position below pivot with the target at 151.130 and 150.930 in extension.
Alternative Price Action: The upside breakout of the pivot would call for 151.700 and 151.880.
Comment: MACD is below 50 levels and Pairs below 20MA.
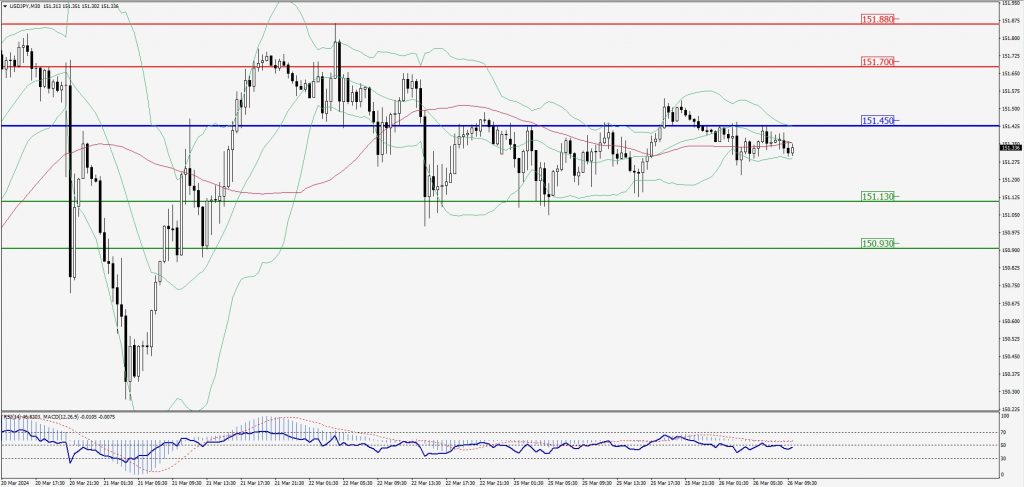
Green Lines Indicate Resistance Levels – Red Lines Indicate Support Levels
Light Blue is a Pivot Point – Black represents the price when the report was produced
AUD/USD Intraday: Trend on the upside
Our pivot point is at 0.65380
Preferable Price Action: Buy positions above pivot with targets at 0.65590 & 0.65750 in extension.
Alternative Price Action: Below pivot looks for a further downside with 0.65200 & 0.65080 as targets.
Comment: RSI is above 50 levels and pairs above 55MA.
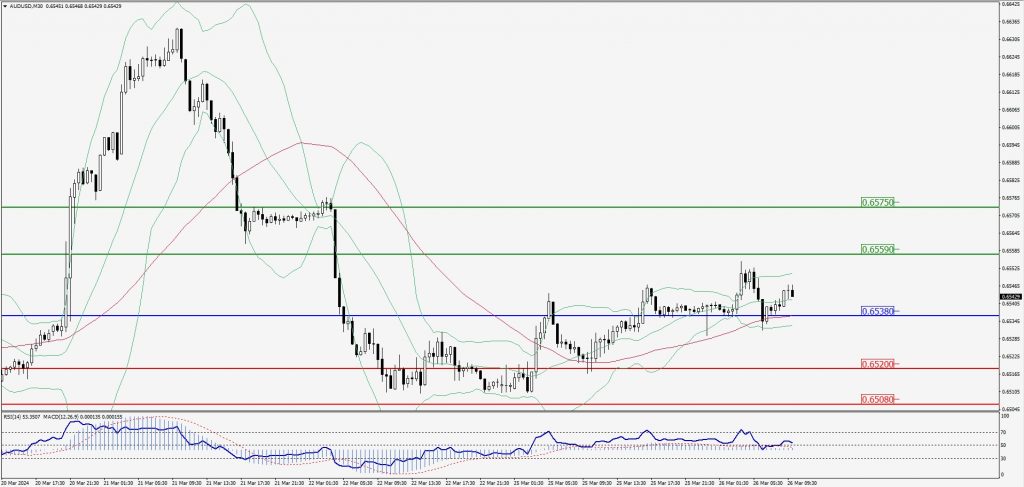
Green Lines Indicate Resistance Levels – Red Lines Indicate Support Levels
Light Blue is a Pivot Point – Black represents the price when the report was produced
CRUDEOIL Intraday: Trend on the downside
Our pivot point is at 81.76
Preferable Price Action: Below pivot sell oil with 81.36 & 81.09 as targets.
Alternative Price Action: Buy crude above pivot with targets at 82.19 and 82.50 in extension.
Comment: MACD is negative territory and Pairs below 20MA.
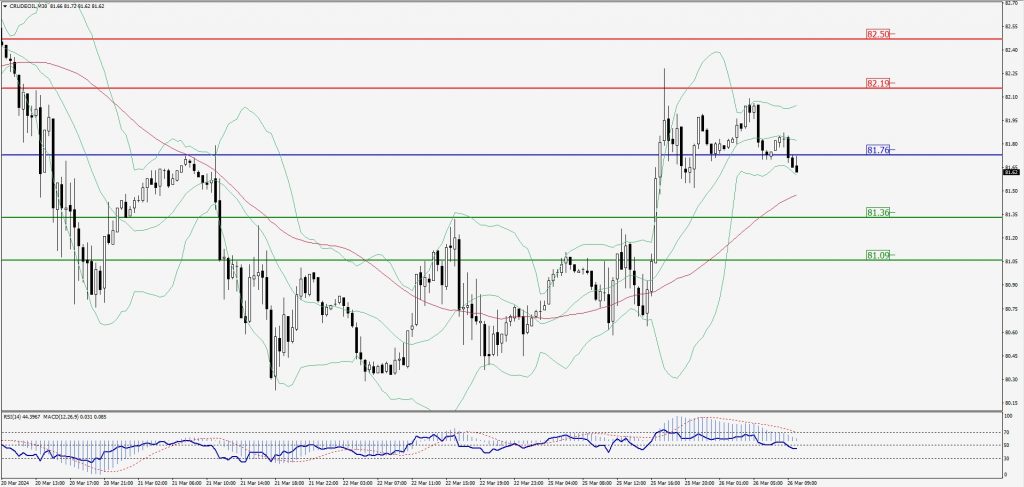
Green Lines Indicate Resistance Levels – Red Lines Indicate Support Levels
Light Blue is a Pivot Point – Black represents the price when the report was produced
XAU/USD Intraday: Trend on the downside
Our pivot point is 2175.50
Preferable Price Action: Further downside to 2160.50 and 2151.30.
Alternative Price Action: If the price gives an upside breakout of a pivot, then the price extends to 2188.10 and 2198.00.
Comment: MACD is below 50 level.
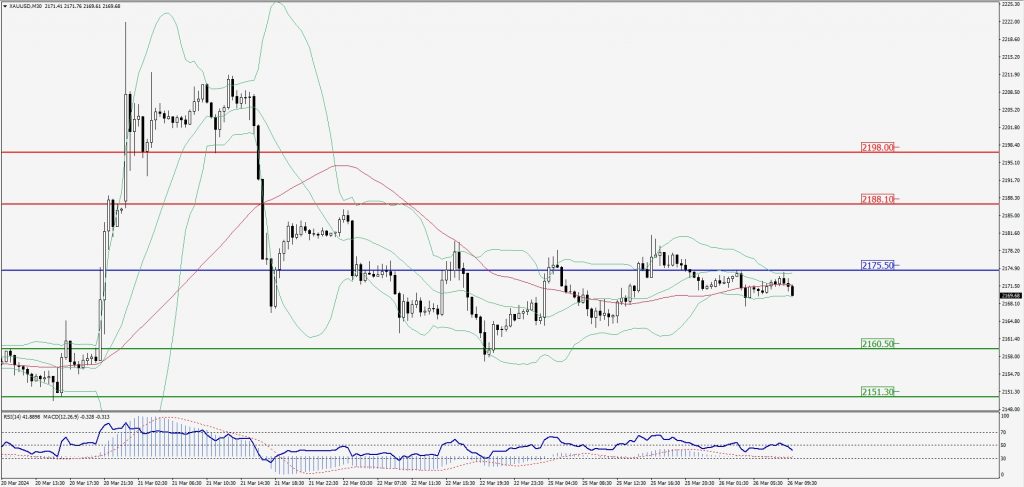
Green Lines Indicate Resistance Levels – Red Lines Indicate Support Levels
Light Blue is a Pivot Point – Black represents the price when the report was produced
Dow Jones Intraday: Trend on the upside
Our pivot point is 39,330.20
Preferable Price Action: Take buy positions above the pivot with targets at 39,477.20 & 39,606.40.
Alternative Price Action: Below 39,330.20 looks for further downside to 39,195.90 & 39,084.50.
Comment: RSI is above 50 levels and Pairs above 20MA.
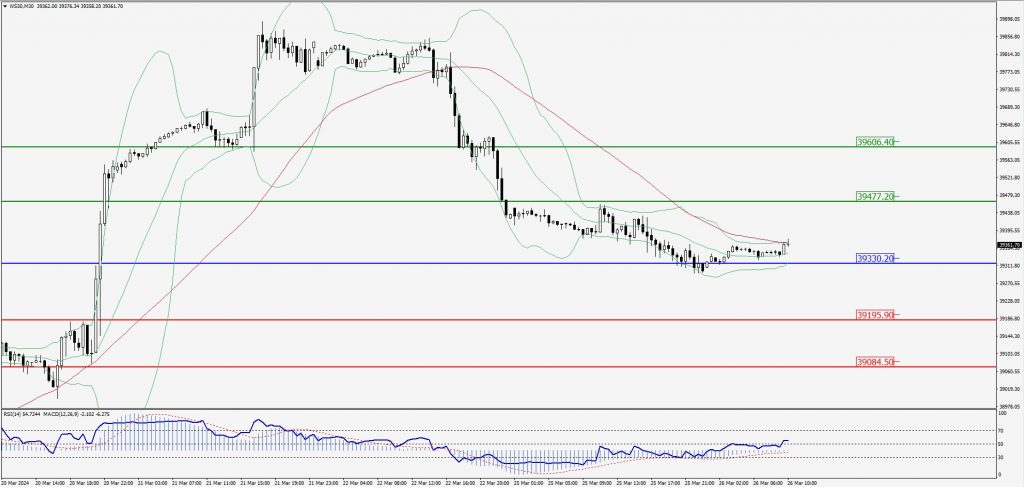
Green Lines Indicate Resistance Levels – Red Lines Indicate Support Levels
Light Blue is a Pivot Point – Black represents the price when the report was produced