Market Wrap: Stocks, Bonds, Commodities
Australia stocks were higher after the close on Monday, as gains in the A-REITs, Energy and Healthcare sectors led shares higher.
The Dow Jones Industrial Average fell 305.47 points to 39,475.90, the S&P 500 lose 0.14% to 5,234.18 and the Nasdaq Composite surged 26.98 points to 16,428.82.
MSCI’s index of Asia-Pacific stocks outside Japan is decline 0.27% to 651.34 levels. The Australian index was higher by 0.60% to 7,811.90. Japanese Nikkei Index drop 1.10% today.
European stocks were negative on Monday, with the Stoxx Europe 50 Index fell 0.10% to 5,026.15, Germany’s DAX drop 0.01% to 18,210.55, and France’s CAC decline 0.23% to 8,133.05 and U.K.’s FTSE 100 subtarct 0.17% to 7,917.75.
Benchmark 10-year U.S. Treasury fell as demand for safe assets drop again, today 10-year bond yields positive 0.17% to 4.2260.
Oil prices rose in Asian trading on Monday on concerns over tighter global supply brought about by escalating conflicts in the Middle East and between Russia and Ukraine, while a shrinking U.S. rig count added to upward price pressure.
Spot Brent crude oil ascend 0.67% to $85.40 per barrel. US West Texas Intermediate crude is up 0.82% to $81.29 a barrel.
The yellow metal gold is advance 0.31% to 2,166.55 dollars per ounce.
Market Wrap: Forex
The dollar headed toward a second week of gains on Friday, after a slight rate hike in Japan gave the yen a slight reprieve and a surprise cut in Switzerland highlighted the gap in interest rate policy between the Federal Reserve and other central banks.
Today, the U.S. dollar index measures the Greenback against a trade-weighted basket of six major currencies, which slipped 0.11% to 104.065.
The Euro US Dollar (EUR/USD) is a widely traded pair that is up 0.12% today. This left the pair trading around $1.08180.
The Japanese yen was negative against the U.S. dollar on Monday. Today USD/JPY is slipped 0.03% to the 151.380 level.
Another commodity-related currency positive against the U.S dollar, AUD/USD rose 0.21% to 0.65280, and NZD/USD surged 0.19% to 0.60030 level.
EUR/USD Intraday: Resistance level at 1.08220
Our pivot point is at 1.08220
Preferable Price Action: Take sell positions below pivot level with targets at 1.07970 & 1.07820 in extension.
Alternative Price Action: Above pivot looks for a further upside to 1.08420 & 1.08600.
Comment: RSI is below 50 levels.
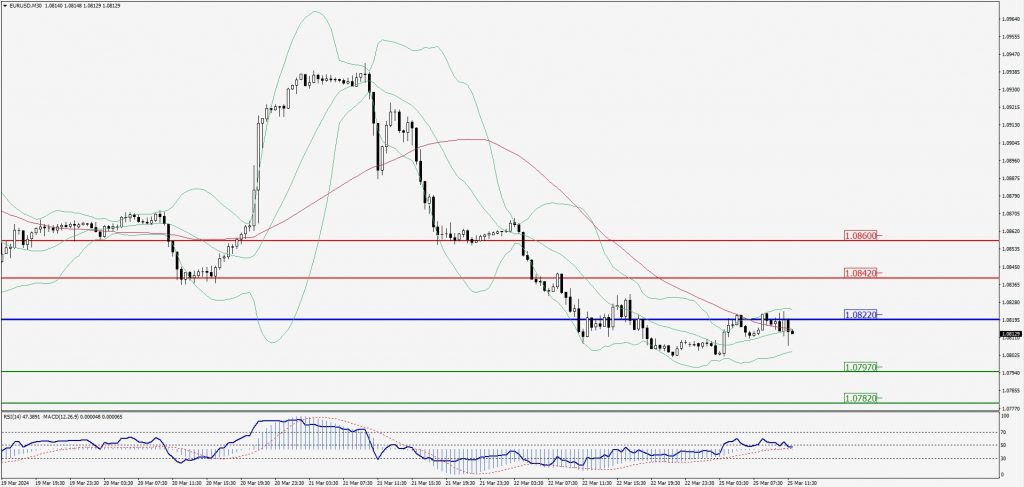
Green Lines Indicate Resistance Levels – Red Lines Indicate Support Levels
Light Blue is a Pivot Point – Black represents the price when the report was produced
GBP/USD Intraday: Trend on the downside
Our pivot point is at 1.26200
Preferable Price Action: Sell positions below pivot with targets at 1.25730 & 1.25440 in extension.
Alternative Price Action: The price above pivot would call for further upside to 1.26600 & 1.26910.
Comment: RSI is below 50 levels.
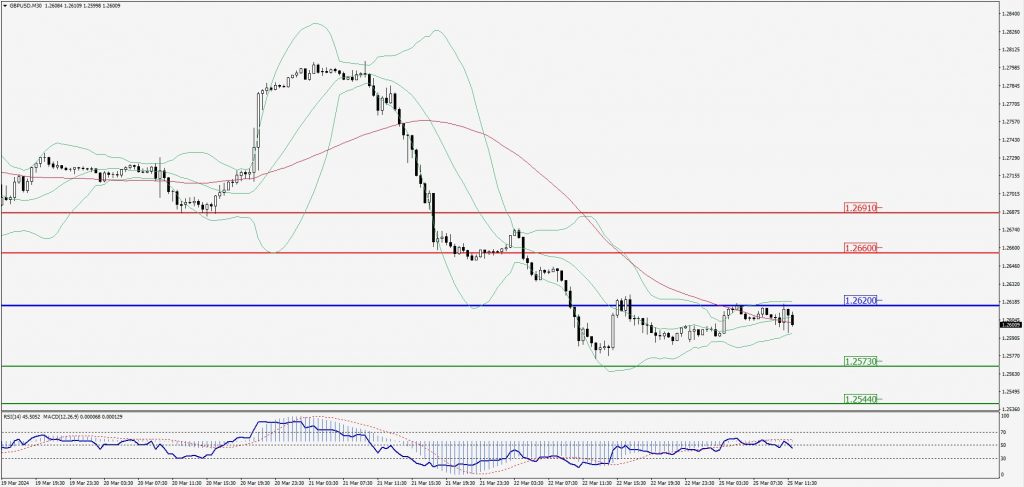
Green Lines Indicate Resistance Levels – Red Lines Indicate Support Levels
Light Blue is a Pivot Point – Black represents the price when the report was produced
USD/JPY Intraday: Trend on the upside
Our pivot point is at 151.280
Preferable Price Action: Buy position above pivot with the target at 151.590 and 151.830 in extension.
Alternative Price Action: The downside breakout of the pivot would call for 150.970 and 150.790.
Comment: MACD is above 50 levels and Pairs above 20MA.
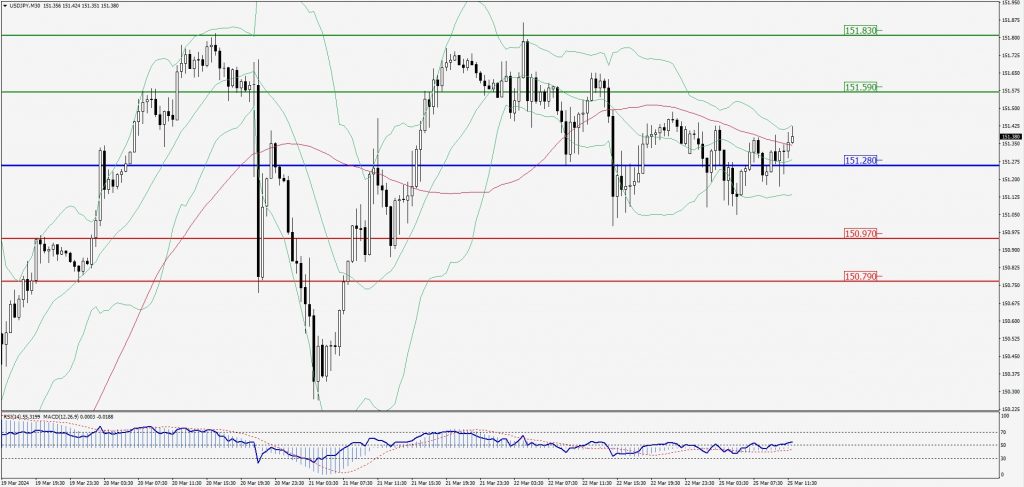
Green Lines Indicate Resistance Levels – Red Lines Indicate Support Levels
Light Blue is a Pivot Point – Black represents the price when the report was produced
AUD/USD Intraday: Support level at 0.65230
Our pivot point is at 0.65230
Preferable Price Action: Buy positions above pivot with targets at 0.65470 & 0.65650 in extension.
Alternative Price Action: Below pivot looks for a further downside with 0.65040 & 0.64900 as targets.
Comment: RSI is below 50 levels and pairs below 55MA.
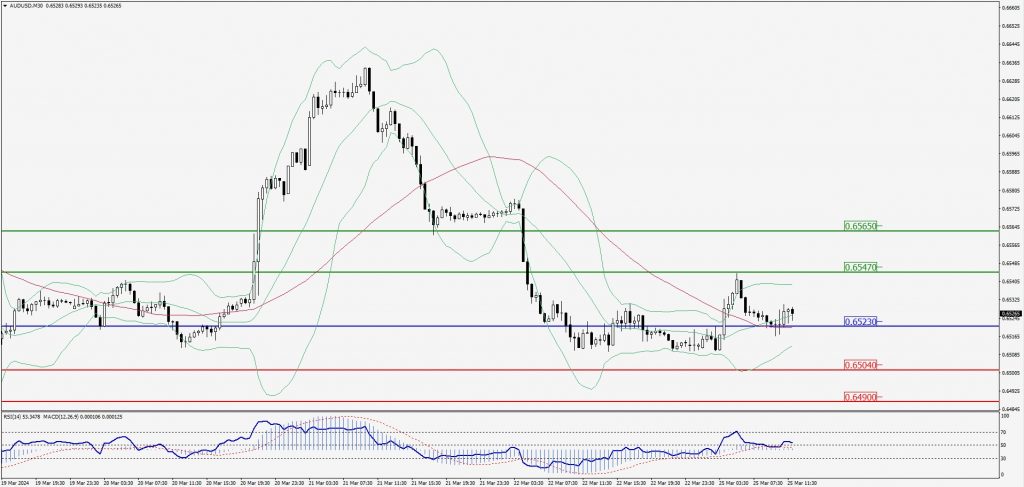
Green Lines Indicate Resistance Levels – Red Lines Indicate Support Levels
Light Blue is a Pivot Point – Black represents the price when the report was produced
CRUDEOIL Intraday: In a cosolidation zone
Our pivot point is at 80.99
Preferable Price Action: Below pivot sell oil with 80.49 & 80.21 as targets.
Alternative Price Action: Buy crude above pivot with targets at 81.43 and 81.71 in extension.
Comment: MACD is flat territory.
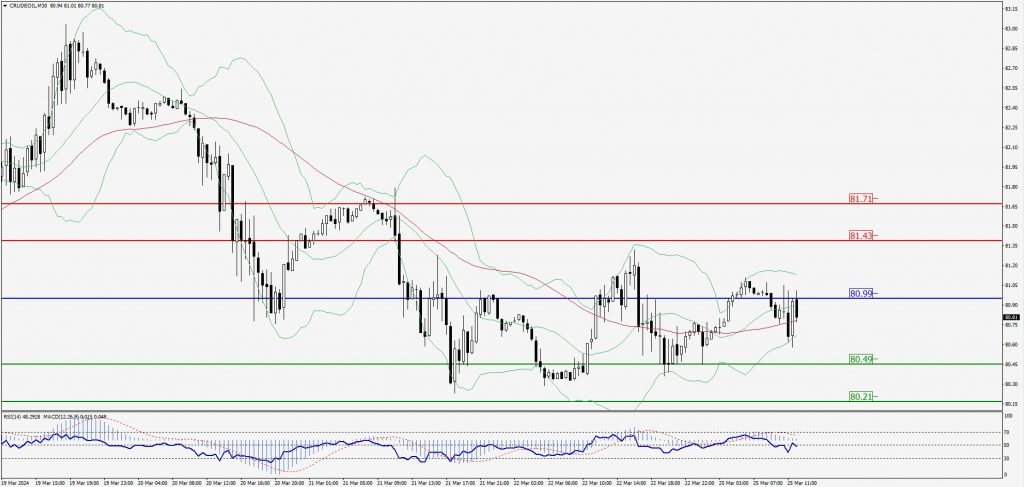
Green Lines Indicate Resistance Levels – Red Lines Indicate Support Levels
Light Blue is a Pivot Point – Black represents the price when the report was produced
XAU/USD Intraday: Trend on the downside
Our pivot point is 2170.90
Preferable Price Action: Further downside to 2157.30 and 2149.40.
Alternative Price Action: If the price gives an upside breakout of a pivot, then the price extends to 2181.90 and 2190.50.
Comment: MACD is below 50 level and Pairs below its 20MA & 55MA

Green Lines Indicate Resistance Levels – Red Lines Indicate Support Levels
Light Blue is a Pivot Point – Black represents the price when the report was produced
Dow Jones Intraday: Trend on the downside
Our pivot point is 39,483.70
Preferable Price Action: Take sell positions below the pivot with targets at 39,294.50 & 39,170.00.
Alternative Price Action: Above 39,483.70 looks for further upside to 39,678.00 & 39,807.60.
Comment: RSI is below 50 levels and Pairs below 55MA.
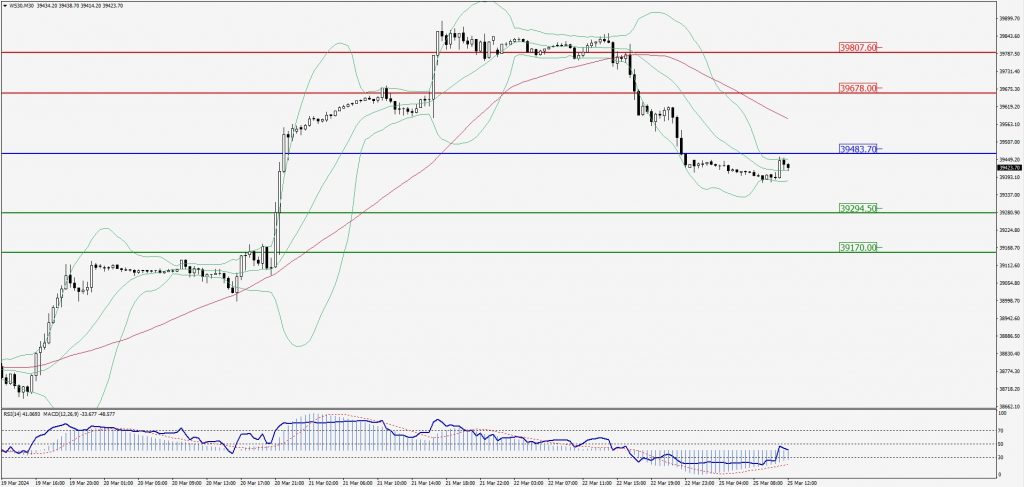
Green Lines Indicate Resistance Levels – Red Lines Indicate Support Levels
Light Blue is a Pivot Point – Black represents the price when the report was produced