Market Wrap: Stocks, Bonds, Commodities
US stocks gyrated in afternoon trading to close lower with interest rate sensitive tech stocks weighing most heavily as uncertainties surrounding an increasingly hawkish Federal Reserve and rising geopolitical tensions contributed to the market’s churn.
The S&P 500 Lost (1.22%) ended at 4,356.45 points, while the Nasdaq Composite fell 315.80 points (2.28%) to 13,539.30. The Dow Jones Industrial was down (0.19%) to 34,297.73.
MSCI’s index of Asia-Pacific stocks outside Japan is down 10.07%, to 773.67 levels. Australian index drop 2.49% to 6,961.60. Japanese Nikkei Index felt 0.44% to 27,011.33.
European stocks were negative on Wednesday, with the Stoxx Europe 50 Index up 2.01% to 4,160.25 Germany’s DAX stair up 1.90% to 15,410.54, and France’s CAC pull up 1.87% to 6,966.05, and U.K.’s FTSE 100 pulled gain 1.61% to 7,490.40.
Benchmark 10-year U.S. Treasury ascend as demand for safe assets gains again, today 10-year bond yields flat 1.785.
Oil prices slipped on Wednesday as investors locked in profits ahead of an update from the U.S. Federal Reserve and the U.S. Energy Information Administration’s inventory data, but concerns over tighter supply amid geopolitical tensions capped losses.
Spot Brent crude oil gained 0.38% to $87.51 per barrel. US West Texas Intermediate crude up 0.28% to $85.84 a barrel.
The yellow metal gold decline 0.43% to 1,844.45 dollars per ounce.
Market Wrap: Forex
The dollar was down on Wednesday morning in Asia and the euro was near its weakest in a month versus the safe-haven dollar and Japanese yen. Investors remain concerned about a potential armed conflict in Ukraine, and faster-than-expected U.S. policy decision monetary policy tightening.
Today, the U.S. dollar index measures the greenback against a trade-weighted basket of six major currencies, which is raised at 96.030.
The Euro US Dollar (EUR/USD) is a widely traded pair that is lost today. This left the pair trading around $1.12920.
The Japanese yen was strong against the U.S. dollar on Wednesday as the stock pulled. Today USD/JPY is rose 0.22% at the 114.110 level.
Another commodity-related currency mixed against the U.S dollar, AUD/USD rose 0.27% to 0.71670, and NZD/USD Flat to 0.66850 level.
EUR/USD Intraday: Trend on the Downside
Our pivot point is at 1.13110
Preferable Price Action: Take Short positions Below pivot level with targets at 1.12760 & 1.12510 in extension.
Alternative Price Action: Above pivot looks for a further Upside to 1.13460 & 1.13710.
Comment: Pair Below its 20MA & 55MA and RSI below 50 levels.
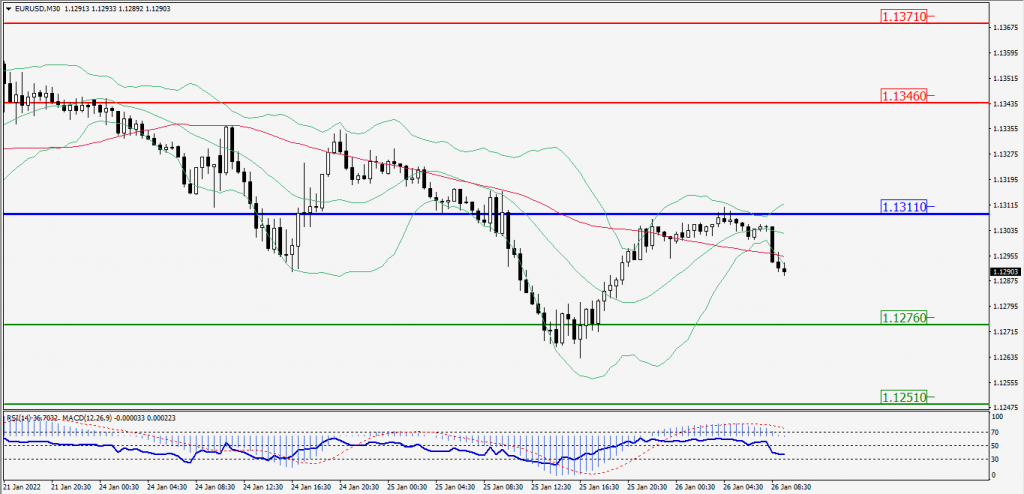
Green Lines Indicate Resistance Levels – Red Lines Indicates Support Levels
Light Blue is a Pivot Point – Black represents the price when the report was produced
GBP/USD Intraday: Support at 1.34830
Our pivot point is at 1.34830
Preferable Price Action: Buy positions Above pivot with targets at 1.35340 & 1.35700 in extension.
Alternative Price Action: The price Below pivot would call for further Downside to 1.34330 & 1.33970.
Comment: Pair Above 55MA and RSI at 50 levels.
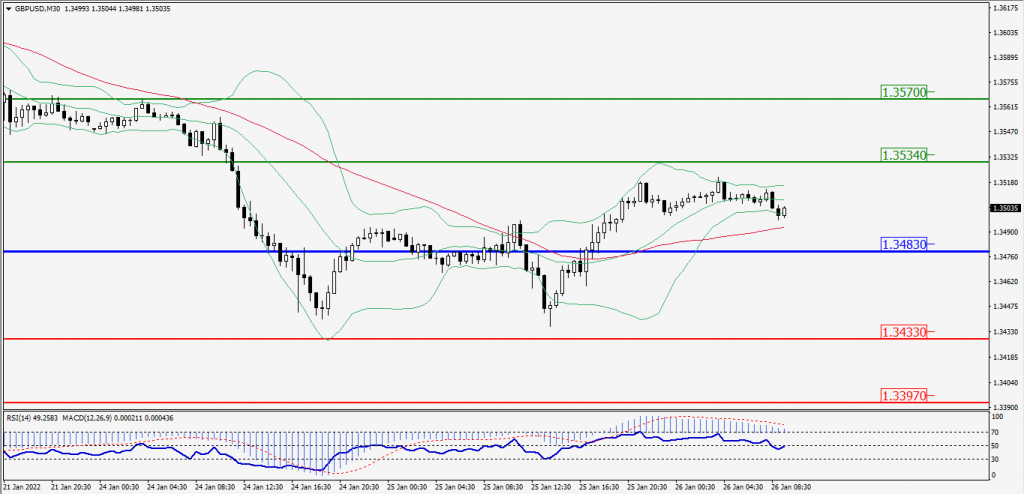
Green Lines Indicate Resistance Levels – Red Lines Indicates Support Levels
Light Blue is a Pivot Point – Black represents the price when the report was produced
USD/JPY Intraday: In a Consolidation Zone
Our pivot point is at 113.860
Preferable Price Action: Buy position Above pivot with the target at 114.090 and 114.310 in extension.
Alternative Price Action: The Downside breakout of the pivot would call for 113.630 and 113.410.
Comment: Pair Above its 55MA & 20MA and MACD in positive territory.
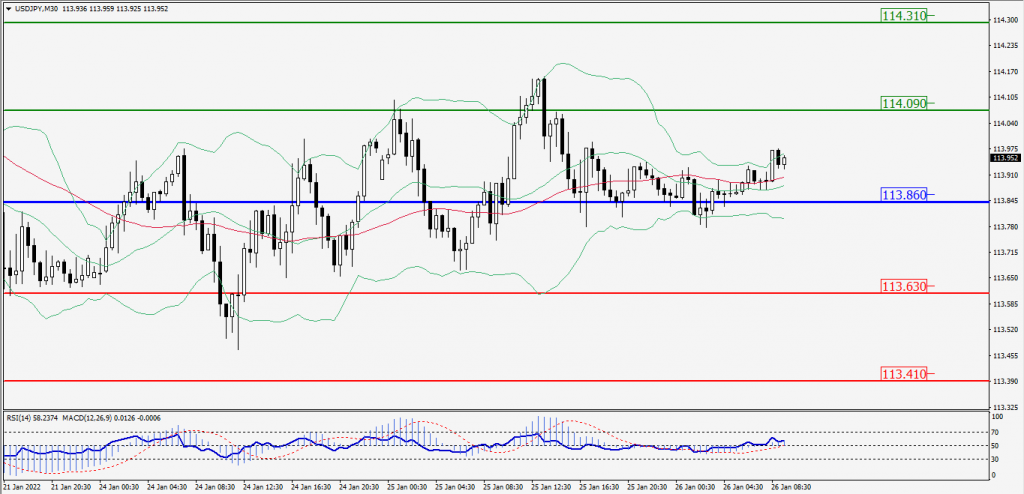
Green Lines Indicate Resistance Levels – Red Lines Indicates Support Levels
Light Blue is a Pivot Point – Black represents the price when the report was produced
AUD/USD Intraday: Major support at 0.71410
Our pivot point is at 0.71410
Preferable Price Action: Buy Positions above pivot with targets at 0.71740 & 0.72040 in extension.
Alternative Price Action: Below pivot looks for a further Downside with 0.71080 & 0.70780 as targets.
Comment: Pair Above 55MA and RSI at 50 levels.
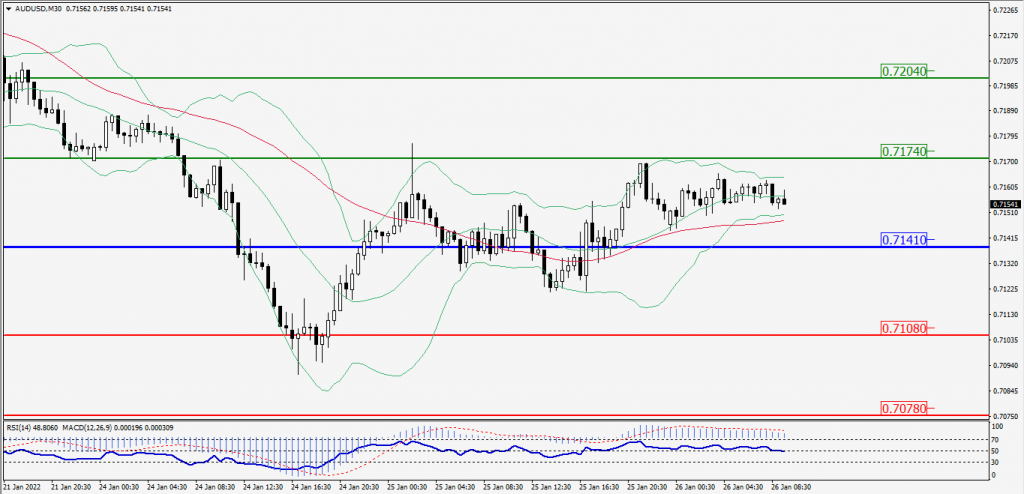
Green Lines Indicate Resistance Levels – Red Lines Indicates Support Levels
Light Blue is a Pivot Point – Black represents the price when the report was produced
CRUDEOIL Intraday: Trend on the Upside
Our pivot point is at 84.85
Preferable Price Action: Above pivots Buy Oil with 86.15 & 87.30 as targets.
Alternative Price Action: Sell crude Below pivot with targets at 83.55 and 82.40 in extension.
Comment: Price Above its 55MA & 20MA and MACD is in the Positive territory.
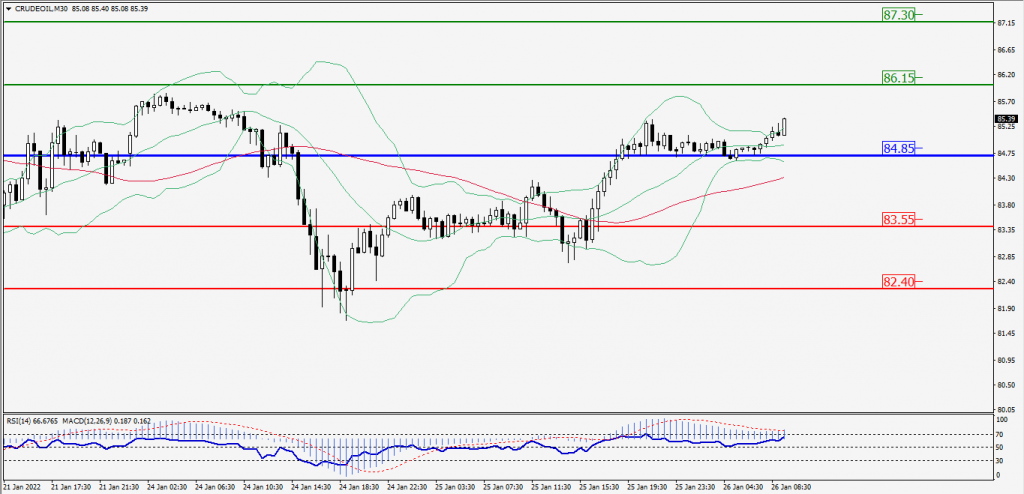
Green Lines Indicate Resistance Levels – Red Lines Indicates Support Levels
Light Blue is a Pivot Point – Black represents the price when the report was produced
XAU/USD Intraday: Major Support at 1841.10
Our pivot point is 1841.10
Preferable Price Action: Further Upside to 1851.30 and 1857.80.
Alternative Price Action: If the price gives a Downside breakout of a pivot, then the price extends to 1830.90 and 1824.40.
Comment: MACD is a Negative territory And Price Below 20MA.
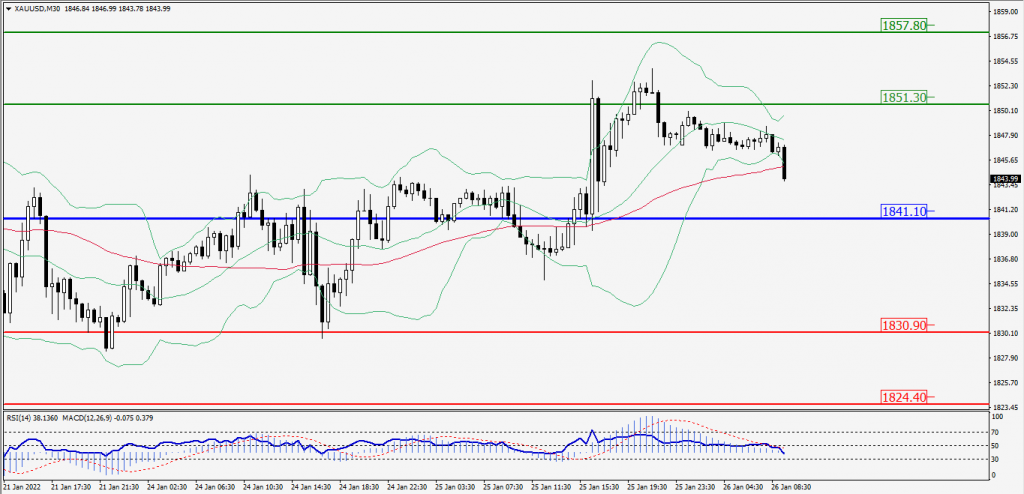
Green Lines Indicate Resistance Levels – Red Lines Indicates Support Levels
Light Blue is a Pivot Point – Black represents the price when the report was produced
Dow Jones Intraday: in a Consolidation Zone
Our pivot point is 34,111.00
Preferable Price Action: Take Long positions Above pivot with targets at 34,695.00 & 35,169.00.
Alternative Price Action: Below 34,111.00 looks for further Downside to 33,527.00 & 33,053.00.
Comment: RSI above 50 levels And price is above 55MA.
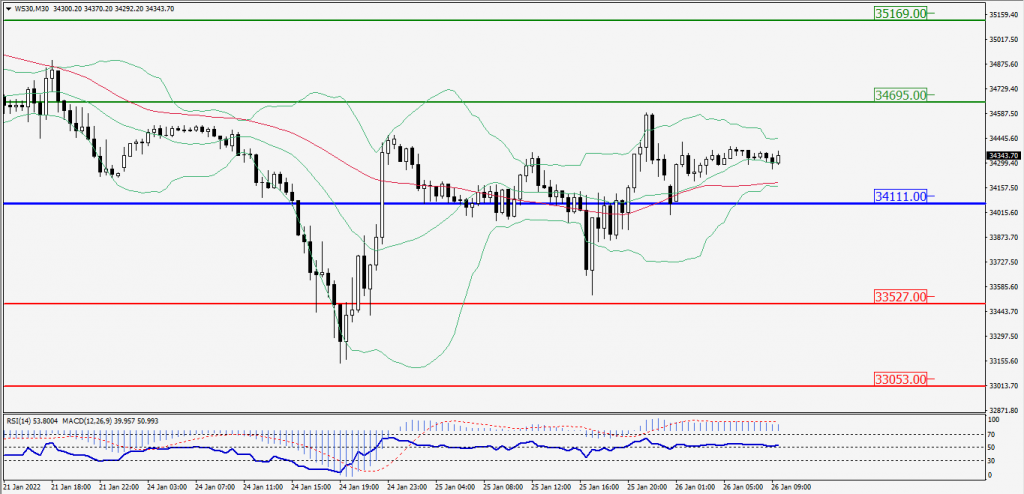
Green Lines Indicate Resistance Levels – Red Lines Indicates Support Levels
Light Blue is a Pivot Point – Black represents the price when the report was produced