Market Wrap: Stocks, Bonds, Commodities
Wall Street bounced back from a steep sell-off late in the session to close higher on Tuesday, with bargain hunters pushing the indexes into positive territory by closing bell.
The S&P 500 Gain (0.28%) ended at 4,410.13 points, while the Nasdaq Composite advance 86.2 points (0.63%) to 13,855.10. The Dow Jones Industrial up (0.29%) to 34,364.50.
MSCI’s index of Asia-Pacific stocks outside Japan is down 1.39%, to 774.56 levels. Australian index drop 2.49% to 6,961.60. Japanese Nikkei Index felt 1.66% to 27,131.34.
European stocks were negative on Tuesday, with the Stoxx Europe 50 Index up 0.88% to 4,089.85 Germany’s DAX stair up 0.69% to 15,114.51, and France’s CAC pull up 1.02% to 6,856.82, and U.K.’s FTSE 100 pulled gain 0.61% to 7,341.45.
Benchmark 10-year U.S. Treasury ascend as demand for safe assets gains again, today 10-year bond yields surged to 1.54% to 1.762.
Oil prices fell about 2 percent on Tuesday, hit by investor concerns over the possibility of quicker than expected interest-rate hikes by the US Federal Reserve that took down risk markets such as equities while the dollar rallied.
Spot Brent crude oil gained 0.75% to $86.07 per barrel. US West Texas Intermediate crude up 0.70% to $83.89 a barrel.
The yellow metal gold decline 0.08% to 1,840.20 dollars per ounce.
Market Wrap: Forex
The safe-haven yen and U.S. dollar rose on Tuesday while the risk-sensitive New Zealand dollar fell with the euro amid escalating worries about both a potential military conflict in Ukraine and a faster pace of Federal Reserve policy tightening.
Today, the U.S. dollar index measures the greenback against a trade-weighted basket of six major currencies, which is raised at 96.023.
The Euro US Dollar (EUR/USD) is a widely traded pair that is lost today. This left the pair trading around $1.13000.
The Japanese yen was not strong against the U.S. dollar on Monday as the stock pulled lower. Today USD/JPY is flat at 113.900 level.
Another commodity-related currency mixed against the U.S dollar, AUD/USD rose 0.15% to 0.71510, and NZD/USD fell 0.28% to 0.66790 level.
EUR/USD Intraday: In a Consolidation Zone
Our pivot point is at 1.13280
Preferable Price Action: Take Short positions Below pivot level with targets at 1.12970 & 1.12690 in extension.
Alternative Price Action: Above pivot looks for a further Upside to 1.13590 & 1.13870.
Comment: Pair Below its 20MA & 55MA and RSI below 50 levels.
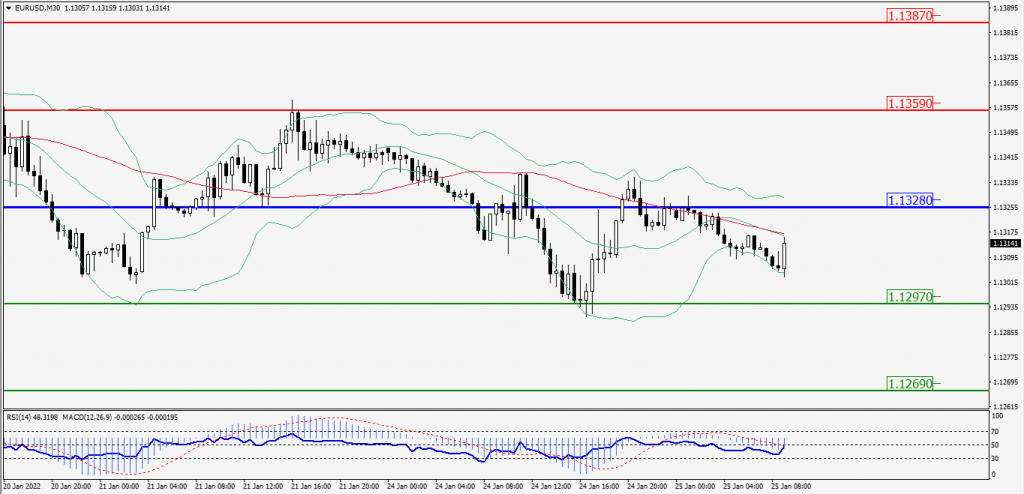
Green Lines Indicate Resistance Levels – Red Lines Indicates Support Levels
Light Blue is a Pivot Point – Black represents the price when the report was produced
GBP/USD Intraday: Trend on the Downside
Our pivot point is at 1.35080
Preferable Price Action: Sell positions Below pivot with targets at 1.34490 & 1.34080 in extension.
Alternative Price Action: The price Above pivot would call for further Upside to 1.35670 & 1.36080.
Comment: Pair Below 55MA and RSI at 50 levels.
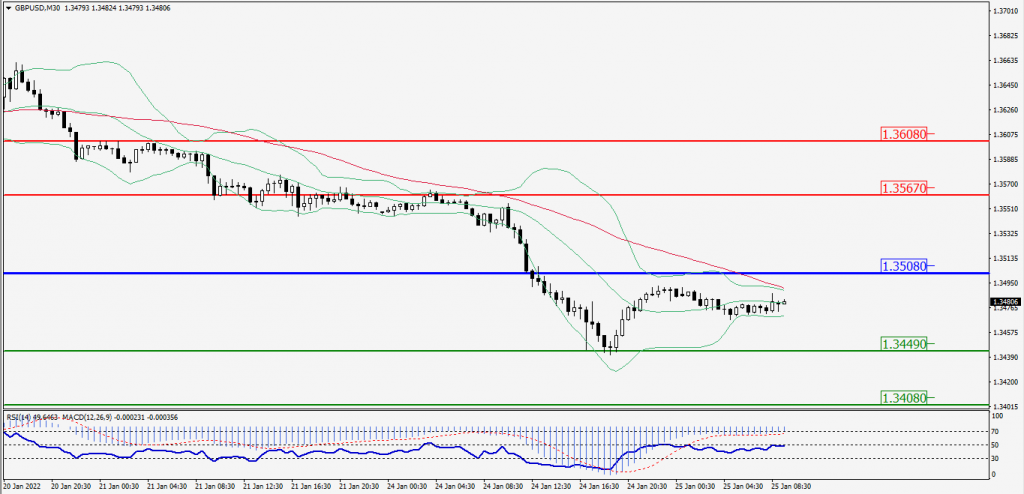
Green Lines Indicate Resistance Levels – Red Lines Indicates Support Levels
Light Blue is a Pivot Point – Black represents the price when the report was produced
USD/JPY Intraday: In a Consolidation Zone
Our pivot point is at 114.000
Preferable Price Action: Sell position Below pivot with the target at 113.660 and 113.370 in extension.
Alternative Price Action: The Upside breakout of the pivot would call for 114.340 and 114.630.
Comment: Pair Below its 55MA & 20MA and MACD in negative territory.
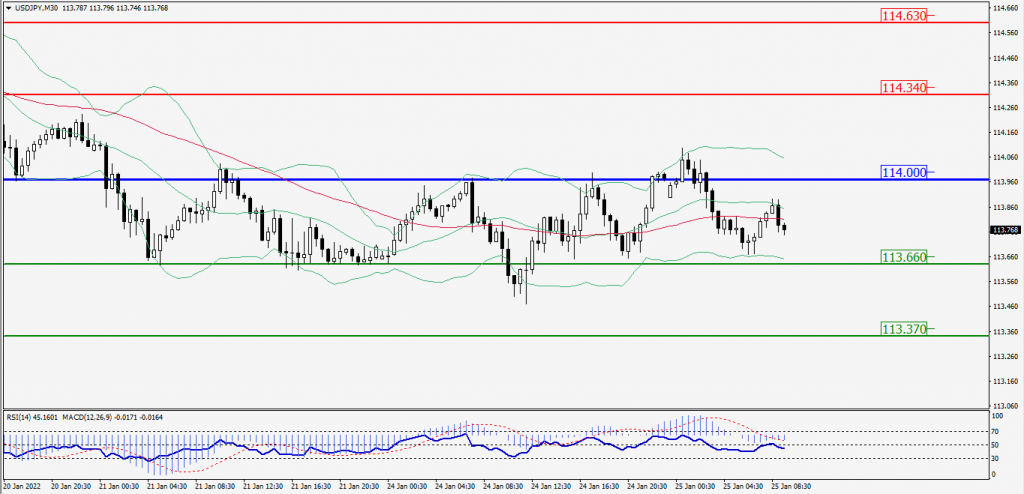
Green Lines Indicate Resistance Levels – Red Lines Indicates Support Levels
Light Blue is a Pivot Point – Black represents the price when the report was produced
AUD/USD Intraday: Trend on the Downside
Our pivot point is at 0.71740
Preferable Price Action: Sell Positions below pivot with targets at 0.71010 & 0.70560 in extension.
Alternative Price Action: Above pivot looks for a further Upside with 0.72470 & 0.72920 as targets.
Comment: Pair Below 20MA and RSI below 50 levels.
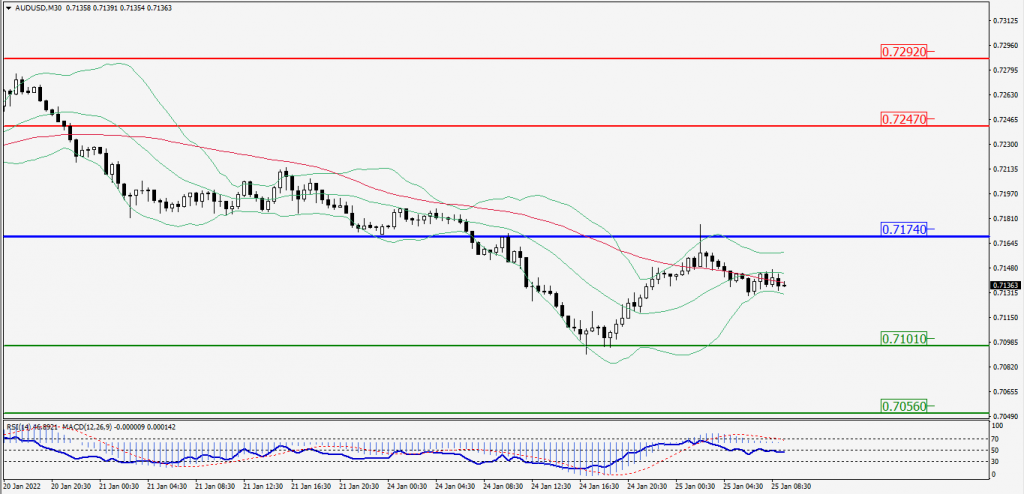
Green Lines Indicate Resistance Levels – Red Lines Indicates Support Levels
Light Blue is a Pivot Point – Black represents the price when the report was produced
CRUDEOIL Intraday: Major Support at 84.20
Our pivot point is at 84.20
Preferable Price Action: Below pivots Sell Oil with 82.85 & 81.75 as targets.
Alternative Price Action: Buy crude Below pivot with targets at 85.55 and 86.65 in extension.
Comment: Price Below 55MA and MACD is in the Flat territory.
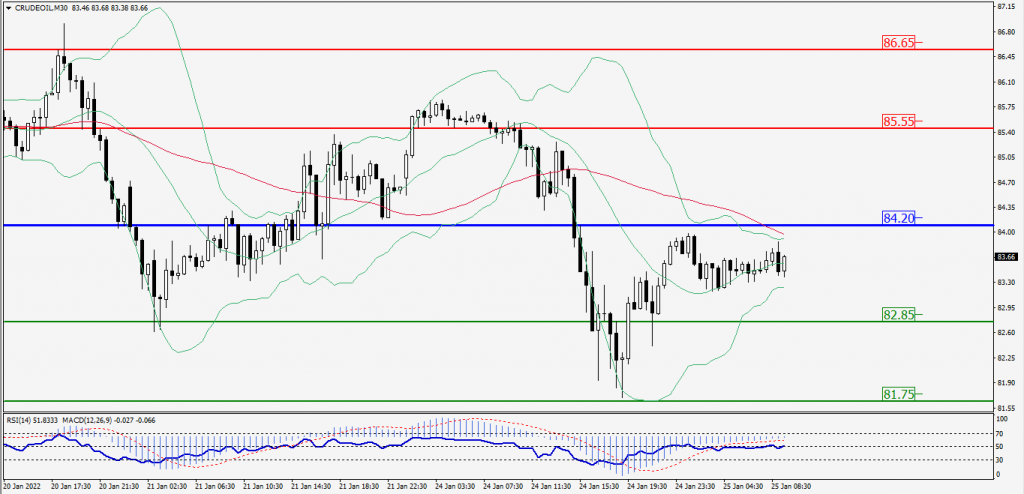
Green Lines Indicate Resistance Levels – Red Lines Indicates Support Levels
Light Blue is a Pivot Point – Black represents the price when the report was produced
XAU/USD Intraday: Major Trend on the Upside
Our pivot point is 1837.80
Preferable Price Action: Further Upside to 1847.60 and 1853.70.
Alternative Price Action: If the price gives a Downside breakout of a pivot, then the price extends to 1828.10 and 1822.00.
Comment: MACD is a Neutral territory And Price 55MA.
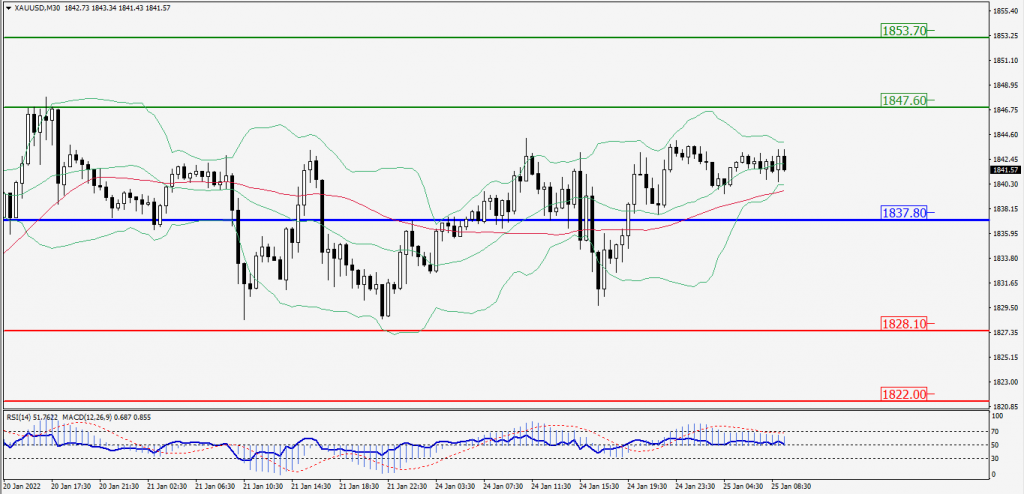
Green Lines Indicate Resistance Levels – Red Lines Indicates Support Levels
Light Blue is a Pivot Point – Black represents the price when the report was produced
Dow Jones Intraday: Trend on the Downside
Our pivot point is 34,541.00
Preferable Price Action: Take Short positions Below pivot with targets at 33,641.00 & 32,999.00.
Alternative Price Action: Above 34,541.00 looks for further Upside to 35,441.00 & 36,083.00.
Comment: RSI at 50 levels And price is Below its 55MA & 20MA.
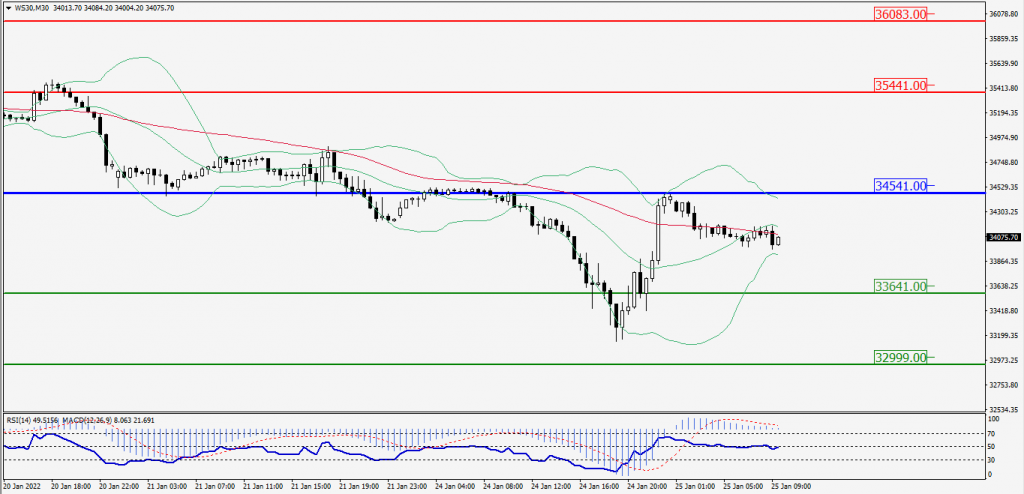
Green Lines Indicate Resistance Levels – Red Lines Indicates Support Levels
Light Blue is a Pivot Point – Black represents the price when the report was produced