DAILY FOREX MARKET TECHNICAL ANALYZING REPORT
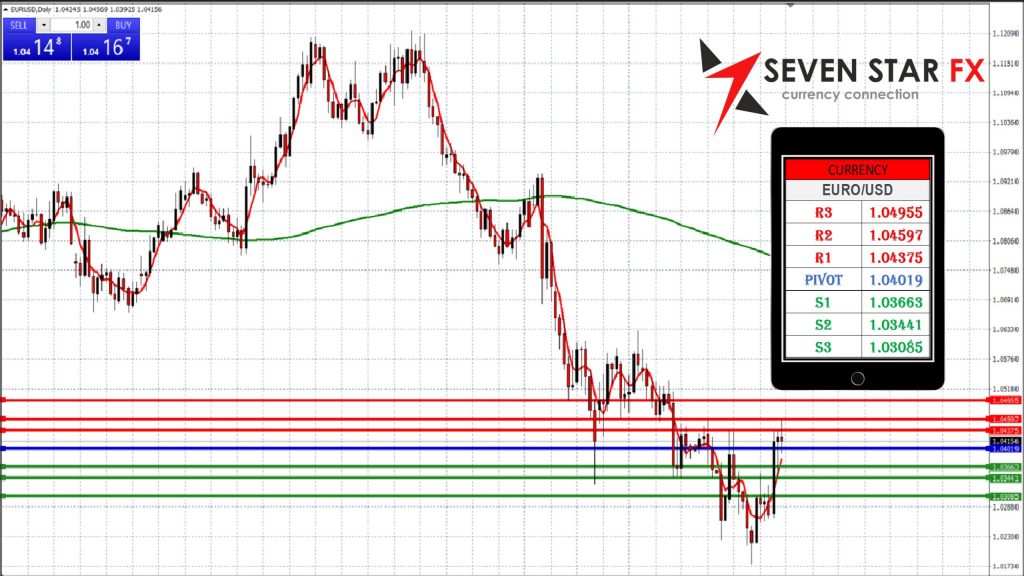
EURO/USD Technical Analysis Report
Date: Wednesday, 22nd January 2025
Key Levels:
-
Resistance Levels:
-
R3: 1.04955
-
R2: 1.04597
-
R1: 1.04375
-
-
Pivot Point: 1.04019
-
Support Levels:
-
S1: 1.03663
-
S2: 1.03441
-
S3: 1.03085
-
Technical Analysis:
The EUR/USD pair is trading around the pivot level of 1.04019, indicating a potential area of consolidation. Based on the provided key levels:
-
Bullish Scenario: If the price sustains above the pivot point and breaks through R1 (1.04375), we could see further upside momentum targeting R2 (1.04597) and eventually R3 (1.04955).
-
Bearish Scenario: On the downside, a break below S1 (1.03663) could lead to further declines toward S2 (1.03441) and potentially S3 (1.03085).
Fibonacci Retracement Analysis:
Using the key levels, Fibonacci retracement levels suggest the following:
-
38.2% retracement near 1.03750 aligns closely with S1, acting as an initial support level.
-
50% retracement near 1.04000 aligns with the pivot point, marking a critical level of balance between buyers and sellers.
-
61.8% retracement near 1.04250 aligns with R1, offering resistance if the price attempts to recover.
These Fibonacci levels highlight potential zones of interest where price reactions are likely.
Euro Fundamentals:
-
Economic Indicators: Recent Eurozone inflation data showed signs of cooling, reducing pressure on the European Central Bank (ECB) for aggressive rate hikes. However, ECB officials have maintained a cautious tone, emphasizing the need to monitor wage growth and inflation expectations.
-
Market Sentiment: The U.S. dollar remains supported by strong economic data, creating headwinds for the euro. Additionally, geopolitical concerns in Europe continue to weigh on investor confidence.
-
Energy Crisis: Rising energy costs across the Eurozone, driven by ongoing geopolitical tensions, have exacerbated inflationary pressures and hurt industrial production.
-
Political Uncertainty: Upcoming elections in key European nations have led to increased uncertainty, potentially impacting the euro’s stability.
-
Trade Balance: A declining trade surplus due to weaker exports has added downward pressure on the euro.
-
Upcoming Events: Traders should keep an eye on Thursday’s ECB meeting minutes, Friday’s PMI data, and U.S. GDP numbers for further insights into the euro’s trajectory.
Disclaimer:
Forex trading involves high volatility and can lead to significant losses. It is essential to trade with caution and ensure proper risk management. We strongly recommend seeking guidance from a financial expert or advisor before making any investment decisions.
GBP/USD Technical Analysis Report with Fundamental Overview
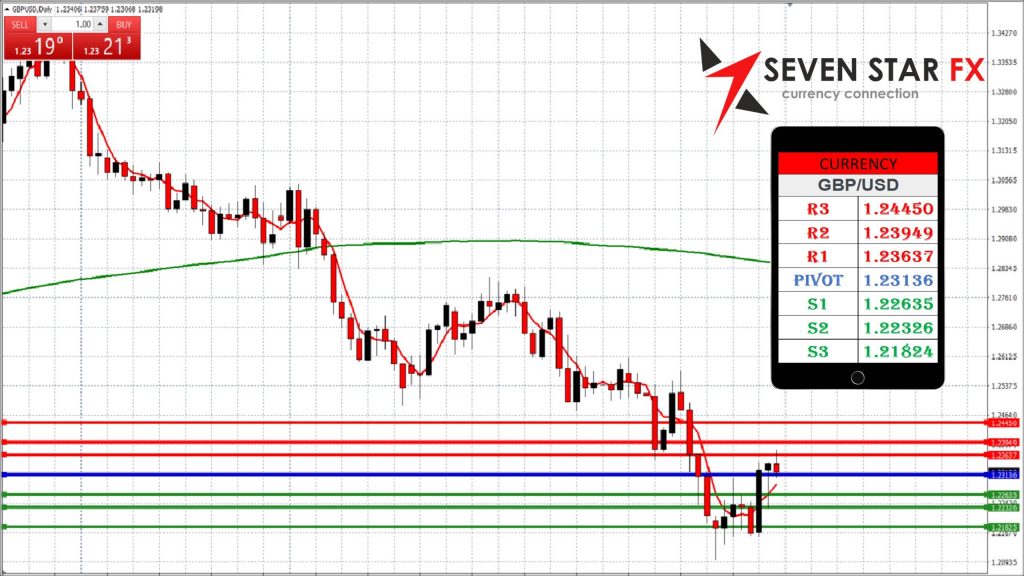
GBP/USD Technical Analysis Report
Date: Wednesday, 22nd January 2025
Key Levels:
-
Resistance Levels:
-
R3: 1.24450
-
R2: 1.23949
-
R1: 1.23637
-
-
Pivot Point: 1.23136
-
Support Levels:
-
S1: 1.22635
-
S2: 1.22326
-
S3: 1.21824
-
Technical Analysis:
The GBP/USD pair is trading around the pivot level of 1.23136, indicating a potential equilibrium point. Based on the provided key levels:
-
Bullish Scenario: If the price sustains above the pivot point and breaks through R1 (1.23637), we could see further upside momentum targeting R2 (1.23949) and eventually R3 (1.24450).
-
Bearish Scenario: On the downside, a break below S1 (1.22635) could lead to further declines toward S2 (1.22326) and potentially S3 (1.21824).
Fibonacci Retracement Analysis:
Using the key levels, Fibonacci retracement levels suggest the following:
-
38.2% retracement near 1.22900 aligns closely with S1, acting as an initial support level.
-
50% retracement near 1.23150 aligns with the pivot point, marking a critical level of balance between buyers and sellers.
-
61.8% retracement near 1.23400 aligns with R1, offering resistance if the price attempts to recover.
These Fibonacci levels highlight potential zones of interest where price reactions are likely.
GBP Fundamentals:
-
Economic Indicators: The UK economy has been showing mixed signals with inflation remaining high despite a recent decline in consumer spending. The Bank of England (BoE) continues to take a cautious stance, monitoring inflationary pressures and labor market dynamics.
-
Brexit Impact: Lingering post-Brexit trade challenges have kept the pound under pressure, especially as new regulatory measures come into effect.
-
Market Sentiment: The U.S. dollar remains supported by strong economic data, creating headwinds for the pound. Meanwhile, geopolitical tensions and energy costs weigh heavily on market confidence in the UK economy.
-
Energy Prices: Rising energy costs are putting additional pressure on household incomes and industrial production, compounding the UK’s economic challenges.
-
Public Debt Levels: Increasing government borrowing to fund social and economic support programs post-Brexit and during the energy crisis has raised concerns among investors about the pound’s long-term stability.
-
Trade Deficit: The UK’s widening trade deficit due to reduced export competitiveness is adding downward pressure on the pound.
-
Upcoming Events: Traders should pay attention to Friday’s UK retail sales data and next week’s BoE meeting minutes for insights into potential monetary policy shifts. Additionally, U.S. GDP figures may influence GBP/USD volatility.
Disclaimer:
Forex trading involves high volatility and can lead to significant losses. It is essential to trade with caution and ensure proper risk management. We strongly recommend seeking guidance from a financial expert or advisor before making any investment decisions.
USD/JPY Technical Analysis Report with Fundamental Overview
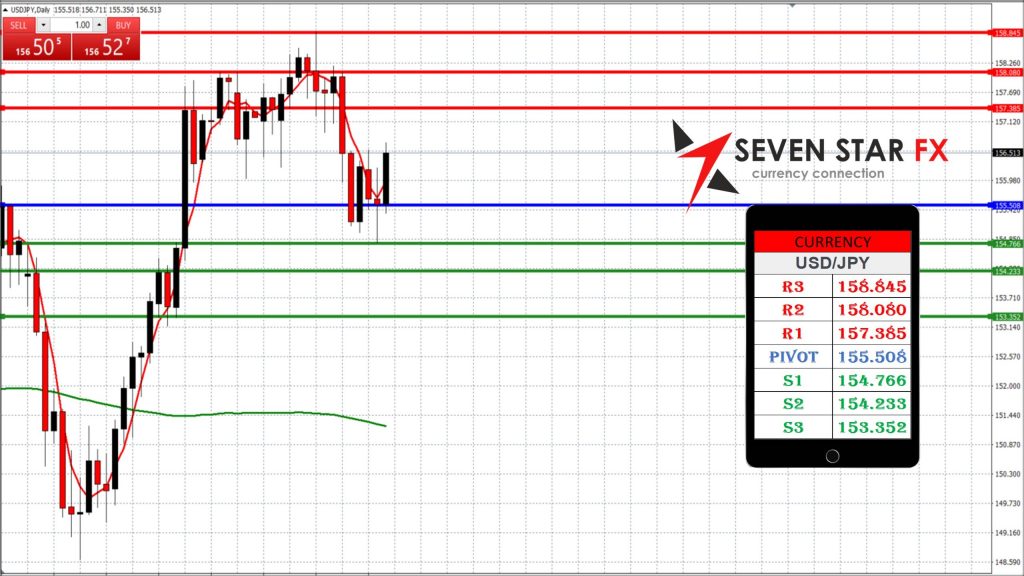
USD/JPY Technical Analysis Report
Date: Monday, 22nd January 2025
Key Levels:
Resistance Levels:
- R3: 158.845
- R2: 158.080
- R1: 157.385
Pivot Point: 155.508
Support Levels:
- S1: 154.766
- S2: 154.233
- S3: 153.352
Technical Analysis:
The USD/JPY pair is currently trading near the pivot point of 155.508, suggesting a neutral outlook for the moment. Based on the provided key levels, here’s the analysis:
- Bullish Scenario:
If the price remains above the pivot point and breaks through R1 (157.385), we may see an extension toward R2 (158.080) and potentially reach the critical resistance level of R3 (158.845). A breakthrough of R3 could signal further upward momentum. - Bearish Scenario:
A break below S1 (154.766) could lead to further declines toward S2 (154.233) and possibly S3 (153.352). If S3 is broken, we might see a stronger bearish trend.
Fibonacci Retracement Analysis:
Using the key levels, the Fibonacci retracement analysis suggests the following:
- 38.2% retracement: Near 154.900, aligning closely with S1, providing initial support if the price starts to retrace.
- 50% retracement: Around 155.508, aligning with the pivot point, marking a balanced level between bulls and bears.
- 61.8% retracement: Near 156.300, aligning with R1, offering resistance if the price attempts a recovery.
These Fibonacci levels can be key zones for price reactions, where traders might find potential entry or exit points.
USD/JPY Fundamentals:
- U.S. Economic Data:
The U.S. economy continues to show strength, with ongoing inflationary pressures and robust economic growth supporting the U.S. dollar. The Federal Reserve’s policy stance remains crucial, and any hints towards further interest rate hikes will likely boost the USD against the JPY. - Japan’s Economic Outlook:
Japan’s economy is still facing challenges related to low inflation and slow growth. The Bank of Japan (BoJ) has maintained its accommodative monetary policy for an extended period, keeping interest rates low, which tends to weaken the yen. - Global Risk Sentiment:
Market sentiment plays a significant role in USD/JPY movements. The U.S. dollar tends to gain strength during periods of global risk aversion, whereas the Japanese yen serves as a safe-haven currency during times of uncertainty. - Geopolitical Tensions:
Tensions in Asia, including trade policies and regional conflicts, could weigh on the yen, especially if the global market faces increased risk aversion. Any developments in the U.S.-China trade relations or North Korean tensions could affect the USD/JPY pair. - Energy Prices:
Rising energy prices could push inflation higher in Japan, which remains a concern for policymakers. However, the yen could weaken further due to the BoJ’s persistent low interest rate environment, which contrasts with the Fed’s tightening policies.
Upcoming Events:
- U.S. Economic Data:
Traders should keep an eye on upcoming U.S. economic releases, especially the GDP growth and inflation data, as these will impact expectations for future Federal Reserve actions. - Bank of Japan (BoJ) Policy:
Any changes in the BoJ’s stance or remarks from BoJ officials about potential policy shifts could influence the JPY’s value.
Disclaimer:
Forex trading involves high volatility and can lead to significant losses. It is essential to trade with caution and ensure proper risk management. We strongly recommend seeking guidance from a financial expert or advisor before making any investment decisions.
AUD/USD Technical Analysis Report with Fundamental Overview
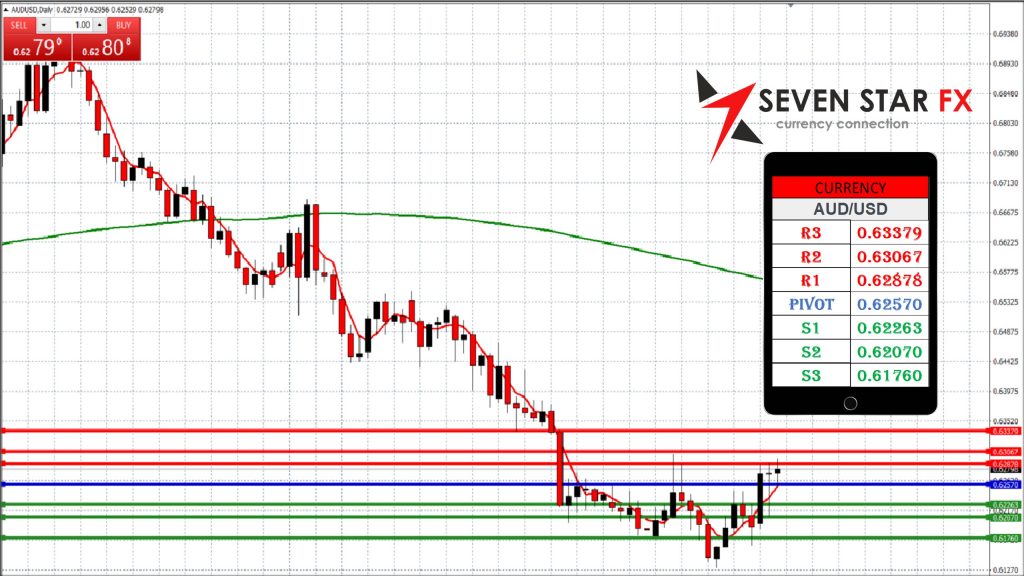
AUD/USD Technical Analysis Report
Date: Monday, 22nd January 2025
Key Levels:
Resistance Levels:
- R3: 0.63379
- R2: 0.63067
- R1: 0.628781
Pivot Point: 0.62570
Support Levels:
- S1: 0.62263
- S2: 0.62070
- S3: 0.61760
Technical Analysis:
The AUD/USD pair is currently trading near the pivot point of 0.62570, indicating a neutral to slightly bullish outlook. Based on the provided key levels, here’s the analysis:
- Bullish Scenario:
If the price maintains support at the pivot point and breaks through R1 (0.628781), we could see further gains toward R2 (0.63067) and potentially reach R3 (0.63379). A breakthrough of R3 would indicate a stronger bullish trend. - Bearish Scenario:
A break below S1 (0.62263) could lead to further declines toward S2 (0.62070) and potentially S3 (0.61760). If S3 is breached, the bearish momentum could strengthen further.
Fibonacci Retracement Analysis:
Using the key levels, the Fibonacci retracement analysis indicates the following:
- 38.2% retracement: Near 0.62380, aligning closely with S1, offering initial support in case of a retracement.
- 50% retracement: Around 0.62570, which aligns with the pivot point, a critical balance point between buyers and sellers.
- 61.8% retracement: Near 0.62700, aligning with R1, which could offer resistance if the price attempts to recover.
These Fibonacci levels may help traders identify potential reversal zones.
AUD/USD Fundamentals:
- Australian Economic Data:
The Australian economy has been showing mixed growth signals, with pressures from global commodity prices and trade dynamics affecting the outlook. A weaker-than-expected economic performance, coupled with rising trade tensions or lower demand for commodities, could weigh on the Australian dollar. - U.S. Economic Outlook:
The U.S. economy continues to show resilience, with economic data such as GDP growth and inflation supporting the U.S. dollar. Strong employment figures and consumer spending suggest that the Federal Reserve may maintain a hawkish stance, which could put downward pressure on the AUD/USD pair. - Commodity Prices:
Australia is heavily dependent on commodity exports, including iron ore, coal, and natural gas. Fluctuations in these markets can significantly impact the Australian dollar. A decline in global demand for these commodities could weaken the AUD, while a surge in demand could boost it. - Global Risk Sentiment:
The Australian dollar tends to rise when global risk sentiment is positive, as it is considered a higher-yielding currency compared to other major currencies. Conversely, a shift to risk aversion, often during periods of geopolitical instability or economic downturns, could cause the AUD to fall.
Upcoming Events:
- Australian Economic Data:
Traders should pay attention to upcoming Australian economic reports, particularly employment figures, inflation data, and trade balances, as these will influence the outlook for the AUD. - U.S. Economic Data:
The U.S. GDP growth and inflation data will play a significant role in shaping market expectations for Federal Reserve policy. Any hawkish signals from the Fed could continue to support the U.S. dollar and weigh on the AUD/USD pair.
Disclaimer:
Forex trading involves high volatility and can lead to significant losses. It is essential to trade with caution and ensure proper risk management. We strongly recommend seeking guidance from a financial expert or advisor before making any investment decisions.
Crude Oil Technical Analysis Report with Fundamental Overview
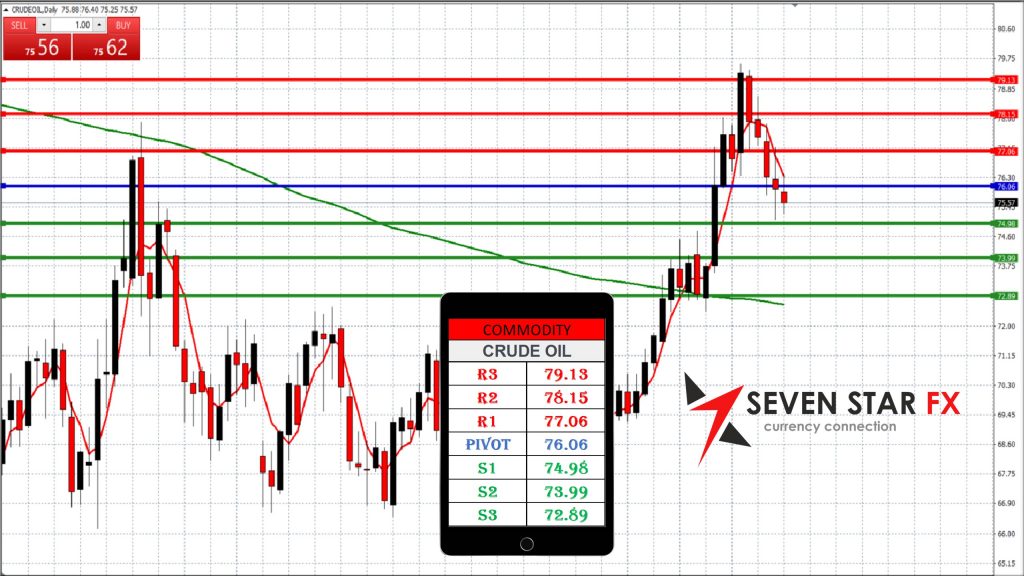
Crude Oil Technical Analysis Report
Date: Monday, 22nd January 2025
Key Levels:
Resistance Levels:
- R3: 79.13
- R2: 78.15
- R1: 77.06
Pivot Point: 76.06
Support Levels:
- S1: 74.98
- S2: 73.99
- S3: 72.89
Technical Analysis:
Crude oil is trading near the pivot point of 76.06, indicating a neutral sentiment with possible fluctuations around this level. Here’s the technical outlook based on the provided key levels:
- Bullish Scenario:
If crude oil remains above the pivot point (76.06) and breaks through R1 (77.06), the price could extend its gains toward R2 (78.15) and potentially reach R3 (79.13). A breakthrough of R3 would signal a stronger bullish move. - Bearish Scenario:
A decline below S1 (74.98) could lead to further declines toward S2 (73.99) and potentially S3 (72.89). If S3 is breached, the bearish momentum may accelerate.
Fibonacci Retracement Analysis:
Using the key levels, the Fibonacci retracement levels provide the following insights:
- 38.2% retracement: Around 75.50, near S1, offering initial support if the price retraces.
- 50% retracement: Near 76.06, aligning with the pivot point, marking a critical level of balance between buyers and sellers.
- 61.8% retracement: Near 77.00, aligning with R1, which could offer resistance if the price attempts to recover.
These Fibonacci levels can be significant for traders looking to identify potential reversal points.
Crude Oil Fundamentals:
- Global Supply and Demand Dynamics:
Crude oil prices are primarily driven by global supply and demand factors. Geopolitical events, such as tensions in key oil-producing regions or changes in OPEC’s production quotas, can significantly impact prices. A surge in global demand or production cuts can drive prices higher, while oversupply or weak demand may put downward pressure on crude oil prices. - U.S. Shale Production:
The U.S. shale oil sector continues to play a key role in global supply dynamics. If shale production rises due to higher prices or technological advances, it could increase supply and weigh on prices. Conversely, lower production in the U.S. could help tighten the market and boost prices. - OPEC Policies:
OPEC’s decisions on production quotas and any potential cuts or increases in supply can have a major impact on the price of crude oil. A reduction in supply or signals of tighter markets from OPEC may lead to a rally in crude oil prices. - Geopolitical Tensions:
Ongoing geopolitical tensions, especially in oil-producing regions like the Middle East, can result in volatility in crude oil prices. Any disruption in supply, such as sanctions or military conflicts, could trigger a sharp price surge. - U.S. Dollar Movements:
As crude oil is priced in U.S. dollars, any significant movement in the U.S. dollar can influence oil prices. A weaker dollar generally supports higher oil prices, while a stronger dollar can exert downward pressure on crude.
Upcoming Events:
- U.S. Economic Data:
Traders should monitor U.S. economic releases, particularly oil inventory data, GDP figures, and inflation reports, which can provide insights into the strength of demand for crude oil. - OPEC Meetings and Statements:
Any statements or actions from OPEC regarding production targets or future supply forecasts will be crucial for crude oil price direction. - Global Geopolitical Events:
Events in major oil-producing countries and regions, such as the Middle East, can affect oil prices. Traders should stay updated on developments that may disrupt oil supply.
Disclaimer:
Crude oil trading involves high volatility and can lead to significant losses. It is essential to trade with caution and ensure proper risk management. We strongly recommend seeking guidance from a financial expert or advisor before making any investment decisions.
Gold Technical Analysis Report with Fundamental Overview
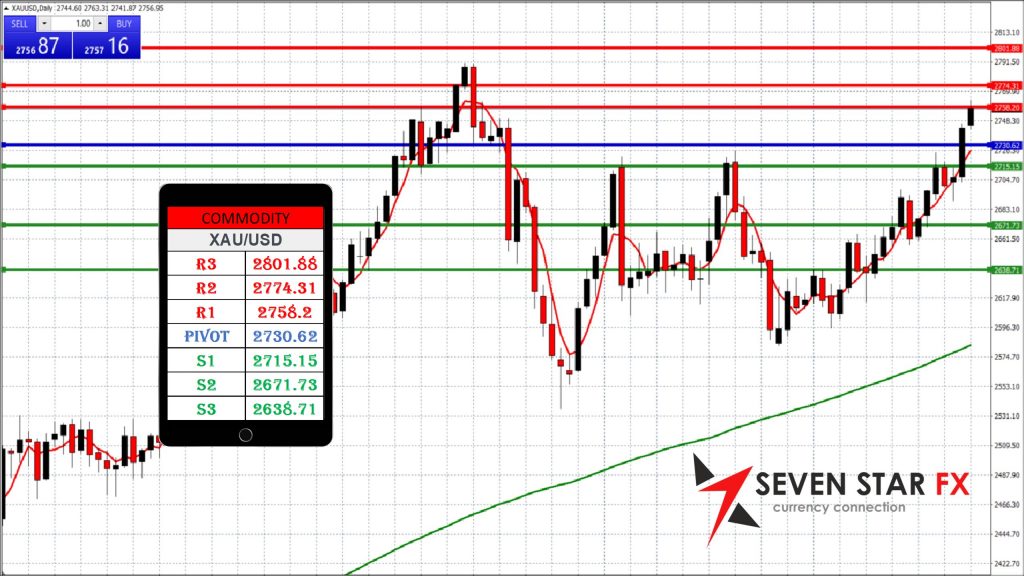
XAU/USD (Gold) Technical Analysis Report
Date: Monday, 22nd January 2025
Key Levels:
Resistance Levels:
- R3: 2801.88
- R2: 2774.31
- R1: 2758.20
Pivot Point: 2730.62
Support Levels:
- S1: 2715.15
- S2: 2671.73
- S3: 2638.71
Technical Analysis:
Neutral Sentiment:
XAU/USD is currently trading near the pivot point of 2730.62, reflecting a neutral bias with potential for either a bullish or bearish breakout depending on market conditions.
Bullish Scenario:
If XAU/USD remains above the pivot point (2730.62) and successfully breaks through R1 (2758.20), it could target higher levels such as R2 (2774.31) and potentially reach R3 (2801.88). A breakout above R3 may indicate a continuation of the bullish trend.
Bearish Scenario:
A drop below S1 (2715.15) could lead to further declines toward S2 (2671.73) and even S3 (2638.71). If the price breaches S3, it could signal increased bearish momentum.
Fibonacci Retracement Analysis:
Based on the provided levels:
- 38.2% retracement: Around 2718, near S1, offering initial support if prices retrace.
- 50% retracement: Close to the pivot point at 2730.62, representing a critical equilibrium point.
- 61.8% retracement: Near 2755, aligning closely with R1, which could act as resistance during recovery attempts.
These Fibonacci levels are useful for identifying potential turning points in the market.
Gold Fundamentals:
Global Risk Sentiment:
Gold, a traditional safe-haven asset, often reacts to changes in risk sentiment. Increased geopolitical tensions, global economic uncertainties, or market volatility can drive demand for gold higher.
Interest Rates and Monetary Policy:
Gold prices are highly sensitive to interest rate changes, particularly in the U.S. If central banks adopt a dovish stance or cut rates, it could boost gold prices. Conversely, higher rates make gold less attractive as a non-yielding asset.
U.S. Dollar Movements:
Gold is inversely correlated with the U.S. dollar. A weaker dollar typically supports gold prices, while a stronger dollar can put downward pressure on them.
Inflation and Economic Data:
Gold is often seen as a hedge against inflation. Rising inflation or expectations of it could support gold prices, while subdued inflation may limit gains.
Upcoming Events to Watch:
- U.S. Economic Data: Keep an eye on key reports like inflation figures, GDP data, and unemployment rates, which could impact both the dollar and gold prices.
- Federal Reserve Statements: Any changes to interest rate policies or forward guidance from the Fed will be crucial for gold’s direction.
- Geopolitical Developments: Monitor geopolitical events, particularly in regions that could impact global economic stability or increase demand for safe-haven assets.
Disclaimer:
Crude oil trading involves high volatility and can lead to significant losses. It is essential to trade with caution and ensure proper risk management. We strongly recommend seeking guidance from a financial expert or advisor before making any investment decisions.
Dow Jones Financial and Technical Summery
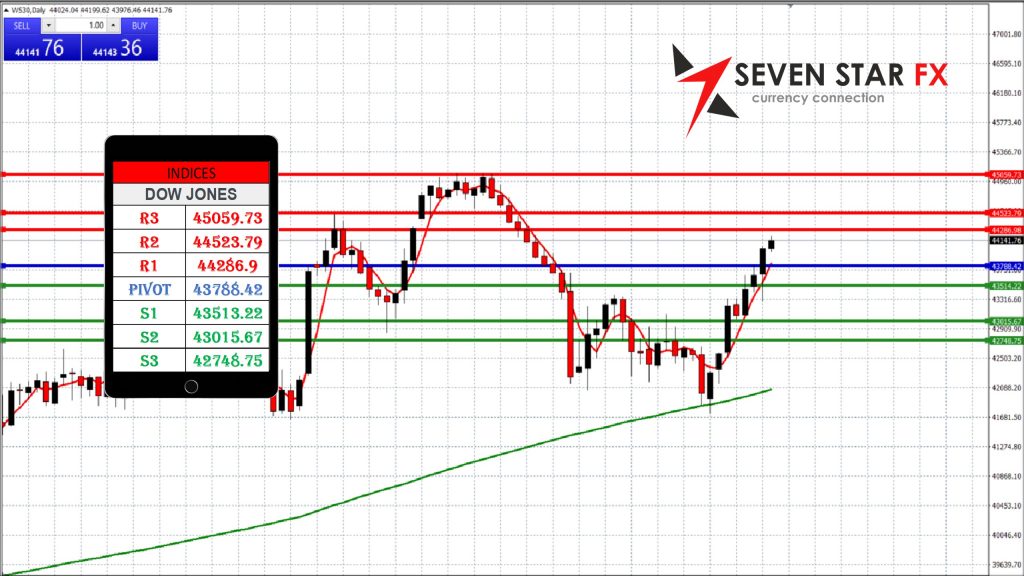
Dow Jones Technical Analysis Report
Date: Monday, 22nd January 2025
Key Levels:
Resistance Levels:
- R3: 45059.73
- R2: 44523.79
- R1: 44286.90
Pivot Point: 43788.42
Support Levels:
- S1: 43513.22
- S2: 43015.67
- S3: 42748.75
Technical Analysis:
The Dow Jones index is currently trading near the pivot point of 43788.42, which indicates a balanced market with potential fluctuations around this level. Here’s the technical outlook based on the provided levels:
- Bullish Scenario:
If the Dow Jones stays above the pivot point (43788.42) and breaks through R1 (44286.90), we could see further upside momentum targeting R2 (44523.79) and eventually R3 (45059.73). A breakthrough of R3 would signal a continued bullish trend with stronger upward potential. - Bearish Scenario:
A decline below S1 (43513.22) could trigger further declines towards S2 (43015.67) and potentially S3 (42748.75). A move below S3 would signal increasing bearish momentum.
Fibonacci Retracement Analysis:
Using the key levels, the Fibonacci retracement analysis suggests:
- 38.2% retracement: Around 43680, aligning with the pivot point, offering initial support for a potential reversal.
- 50% retracement: Near 43788, providing a critical balance level where price action could find equilibrium.
- 61.8% retracement: Around 44150, aligning with R1, acting as a key resistance if the index tries to recover.
These Fibonacci levels highlight potential reversal points for traders looking to enter or exit positions.
Dow Jones Fundamentals:
- U.S. Economic Growth and GDP:
The performance of the Dow Jones is closely tied to U.S. economic data. A healthy economic growth outlook supports positive sentiment in equity markets, boosting investor confidence. The U.S. GDP is expected to show moderate growth, with consumers continuing to drive demand despite inflationary pressures. Strong GDP growth can help the index maintain upward momentum. - Labor Market Strength:
The U.S. labor market remains robust, with steady job growth and a low unemployment rate. Strong labor market data suggests a thriving economy and encourages investment in equities. Job growth contributes to rising consumer confidence and spending, which supports corporate earnings. - Inflation and Federal Reserve Actions:
Inflationary pressures have been high, but the Federal Reserve has managed interest rates to control rising costs. Inflation concerns continue to be a key factor for the equity markets. The Fed’s stance on monetary policy will heavily influence market movements. If the Fed maintains or raises interest rates to curb inflation, it could reduce liquidity in markets, weighing on stock prices, including the Dow Jones. - Corporate Earnings:
The earnings season plays a critical role in driving market sentiment. Strong earnings reports from key companies in the Dow Jones index can lead to upward movement, while disappointing results can cause downward pressure. Analysts expect continued corporate growth, but the pace may slow due to global economic uncertainties and inflationary costs. - Global Trade and Supply Chain Challenges:
Trade tensions, especially between the U.S. and other major economies, such as China and the EU, can influence the performance of U.S. stocks. Supply chain disruptions and trade barriers have added costs for businesses, affecting their profitability. A resolution of trade disputes and improved supply chain stability would positively affect the Dow Jones.
U.S. Economy Impact on Dow Jones:
- Consumer Confidence and Spending:
Consumer spending, which accounts for a significant portion of U.S. GDP, is vital for the health of the Dow Jones. Recent data indicates that consumers are continuing to spend, despite inflation, which supports corporate earnings and the overall stock market. - Monetary Policy:
The Federal Reserve’s policies have been a key driver for market direction. Interest rate decisions, along with statements regarding inflation and economic growth, have a direct impact on stock valuations. If the Fed signals that inflation is under control and considers rate cuts, stock prices may rise, including the Dow Jones. Conversely, any hawkish signals regarding interest rates could lead to market declines. - Geopolitical Tensions and Global Markets:
The U.S. is heavily involved in global trade and economic activity. Tensions in other regions, such as Europe and Asia, can create uncertainty that impacts U.S. equity markets. For example, issues like Brexit, U.S.-China trade tensions, or military conflicts can create volatility in the markets, affecting the Dow Jones. - Energy Prices and Inflation:
Rising energy prices, especially crude oil, can raise costs for companies, particularly in energy-intensive sectors. This would reduce profit margins, putting pressure on stock prices. On the flip side, a drop in energy prices could ease inflationary concerns and provide support for market rallies. - Government Spending and Stimulus:
U.S. government fiscal policy, including spending programs and stimulus packages, also affects the performance of the Dow Jones. Any stimulus or infrastructure bills passed by Congress that increase government spending could provide a boost to stocks, particularly in sectors such as construction and technology.
Upcoming Events:
- U.S. Economic Data:
Traders should monitor U.S. GDP figures, consumer confidence, and jobless claims data as these releases will impact the outlook for the Dow Jones. Positive data could further strengthen market sentiment, while weaker data could lead to volatility. - Federal Reserve Meetings:
Any statements or actions from the Federal Reserve regarding interest rates, inflation, or economic conditions will be highly impactful for the Dow Jones. Traders should be aware of the Fed’s guidance on future monetary policy. - Earnings Reports:
Upcoming earnings reports from major Dow Jones companies will be closely watched by investors. Positive earnings results can drive the index higher, while disappointing earnings may cause selling pressure. - Geopolitical Developments:
Watch for any developments in global trade and geopolitical issues, as these could create market fluctuations that affect U.S. equities and the Dow Jones.
Disclaimer:
Stock market trading, including the Dow Jones Industrial Average, involves high volatility and can lead to significant losses. It is essential to trade with caution and ensure proper risk management. We strongly recommend seeking guidance from a financial expert or advisor before making any investment decisions.
————————————————————————————————————————————————————————————————————————————-
Notice: The data presented is derived from technical analysis and does not constitute financial advice. For those trading in forex, consulting a qualified financial advisor prior to making investment decisions is strongly recommended.
Caution: The information above reflects ongoing technical analysis and should not be interpreted as financial advice. Forex trading involves high volatility, and without proper knowledge, you risk losing all your capital. It is essential to consult with a financial advisor before investing.
Advisory: The insights shared are the result of technical analysis and are not intended as financial advice. Forex traders should seek advice from professional financial advisors before making any investment decisions. Remember, the forex market is highly volatile, and trading without adequate knowledge can lead to significant losses.
Important: The analysis provided is for informational purposes only and should not be seen as financial advice. Forex trading carries substantial risks, and it is advisable to consult financial advisors before proceeding with any investments. This content is intended solely for Wealth Management Education purposes.