DAILY FOREX MARKET TECHNICAL ANALYZING REPORT
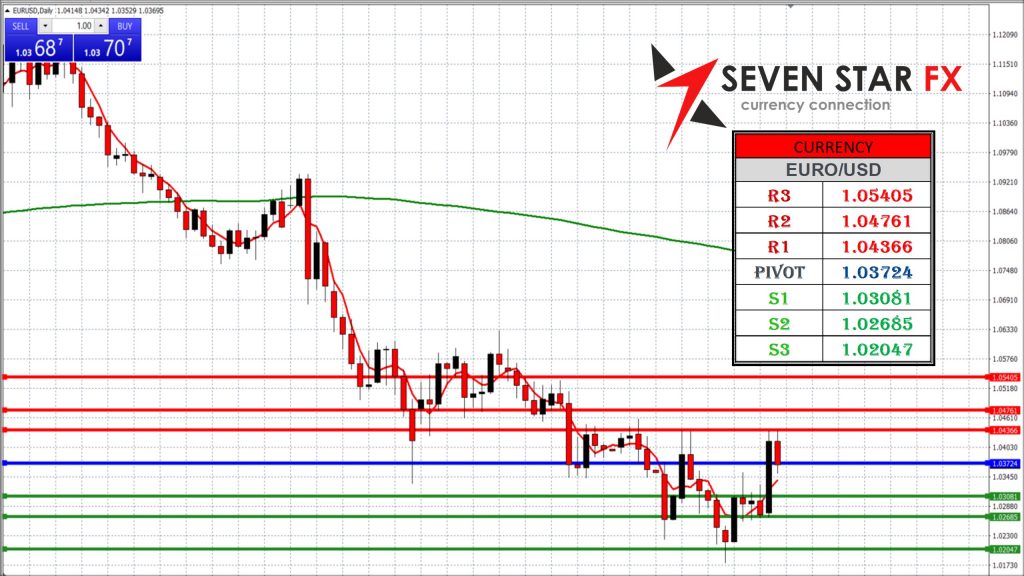
Daily Technical Analysis Report: EUR/USD
Technical Levels:
-
Resistance Levels (R):
- R3: 1.05405
- R2: 1.04761
- R1: 1.04366
-
Pivot Point: 1.03724
-
Support Levels (S):
- S1: 1.03081
- S2: 1.02685
- S3: 1.02047
Technical Analysis:
-
Resistance Levels Analysis:
- R3 (1.05405): This is a strong resistance level. If the price reaches R3, it may face considerable selling pressure, potentially causing the pair to reverse. A breakout above R3 could suggest a continuation of bullish momentum, targeting higher levels.
- R2 (1.04761): A critical level for determining whether the upward move will continue. If EUR/USD breaks through R2, it could lead to a push towards R3. However, if the pair fails to surpass this resistance, we might see a pullback towards the pivot or support levels.
- R1 (1.04366): The nearest resistance level, R1, acts as a potential obstacle for further upward movement. A failure to break R1 could result in consolidation or a pullback towards the pivot point.
-
Support Levels Analysis:
- S1 (1.03081): This is the first line of support. If the price drops to S1, it could find some buying interest here. A bounce from this level might signal a continuation of the uptrend. A drop below S1, however, could indicate further downside risk.
- S2 (1.02685): A stronger support level. If the price reaches S2, it might represent a good buying opportunity if price action shows signs of stabilizing. A breach of this level would signal a deeper bearish move toward S3.
- S3 (1.02047): The lowest support in this range. If EUR/USD falls to this point, it could indicate an oversold condition and potential reversal, but if the level fails to hold, further downward pressure could unfold.
Fundamental Overview:
The EUR/USD currency pair is influenced by various economic and geopolitical factors, primarily linked to the Eurozone and the United States. Here’s an in-depth look at the fundamental drivers:
-
Eurozone Economic Data:
- European Central Bank (ECB) Policy: The ECB’s monetary policy decisions, particularly regarding interest rates and asset purchases, significantly affect the euro. A hawkish ECB stance (such as raising rates) generally strengthens the euro, while dovish policies (such as low rates or asset buying) could weaken it.
- Eurozone GDP and Inflation: Strong GDP growth and rising inflation often lead to expectations of tighter monetary policy from the ECB, which can support the euro. Conversely, weak economic growth or below-target inflation can have a negative impact on the currency.
- Labor Market & Economic Health: Key labor market indicators such as unemployment and wage growth can influence the euro. Additionally, high-profile reports such as the Eurozone economic sentiment index or industrial production data may also lead to increased volatility for EUR/USD.
-
US Economic Data:
- Federal Reserve (Fed) Policy: The Federal Reserve’s actions on interest rates and monetary policy affect the US dollar. A hawkish Fed, raising rates or signaling economic strength, tends to support the dollar, while dovish stances can weaken the USD.
- Non-Farm Payrolls (NFP): A significant monthly report, the NFP report shows the number of jobs added to the US economy and is a key indicator for USD strength. A strong NFP print may indicate an improving economy and lead to bullish momentum for the dollar.
- Inflation (CPI): Inflation data (CPI) from the US is critical in shaping market expectations regarding future Fed actions. Higher-than-expected inflation might push the Fed to raise rates, strengthening the USD. Conversely, low inflation could weaken the dollar as the Fed may choose to keep rates lower.
- Retail Sales & GDP: Data on consumer spending (retail sales) and economic growth (GDP) offer important insights into the US economy’s health. Strong figures may result in a stronger USD, while weak numbers can depress the currency.
-
Geopolitical and Market Sentiment:
- US and EU Relations: Economic or political developments between the US and the Eurozone can drive volatility for EUR/USD. For example, trade tensions, regulatory changes, or political instability in the Eurozone or the US may affect the euro or the dollar.
- Global Risk Sentiment: Market sentiment plays a crucial role. During periods of global uncertainty or risk aversion, investors often flock to the USD as a safe-haven asset, which can weaken the EUR/USD. Conversely, positive global sentiment may support riskier assets like the euro.
- Geopolitical Risks: Events such as Brexit negotiations, US-China trade relations, and other global political developments may also impact EUR/USD volatility.
Disclaimer:
Forex trading involves high volatility and can lead to significant losses. It is essential to trade with caution and ensure proper risk management. We strongly recommend seeking guidance from a financial expert or advisor before making any investment decisions.
GBP/USD Technical Analysis Report with Fundamental Overview
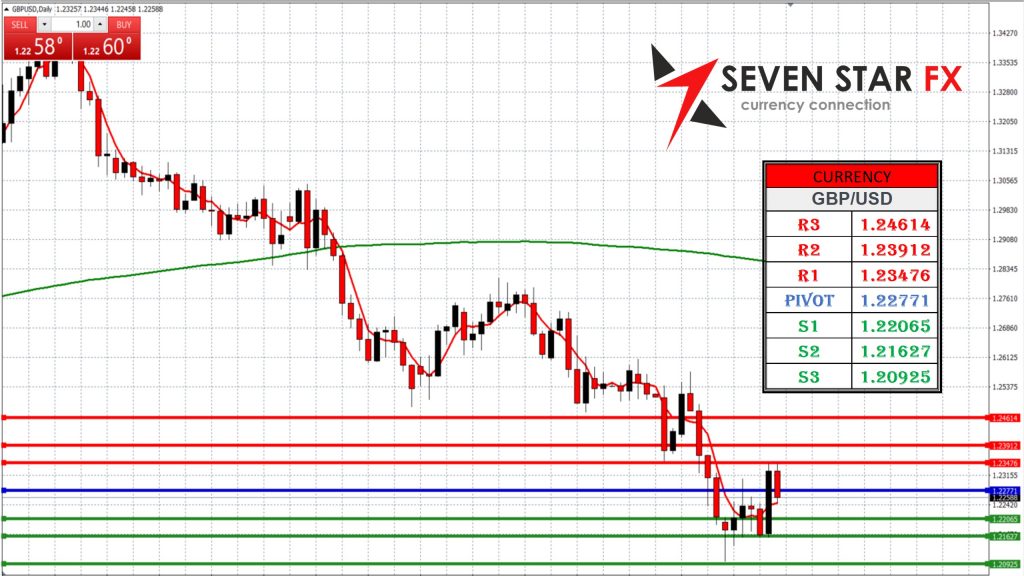
Daily Technical Analysis Report: GBP/USD
Technical Levels:
-
Resistance Levels (R):
- R3: 1.24614
- R2: 1.23912
- R1: 1.23476
-
Pivot Point: 1.22771
-
Support Levels (S):
- S1: 1.22065
- S2: 1.21627
- S3: 1.20925
Technical Analysis:
-
Resistance Levels Analysis:
- R3 (1.24614): This is a strong resistance level. If the price reaches R3, it may face significant selling pressure, potentially causing the pair to reverse. A break above R3 could signal further bullish momentum, targeting the next levels beyond R3.
- R2 (1.23912): This level is crucial for testing the pair’s upward momentum. If GBP/USD breaks R2, it could lead to a rally towards R3. However, a failure to breach this level could lead to a pullback or consolidation.
- R1 (1.23476): The closest resistance, R1 represents a potential barrier for further upside. If the price hits R1 and fails to break, we may see a retracement back towards the pivot or support levels.
-
Support Levels Analysis:
- S1 (1.22065): This level provides initial support, and a price bounce here could indicate a continuation of the uptrend. A move below S1, however, could signal bearish sentiment and a drop toward the lower support levels.
- S2 (1.21627): A significant support level. If the pair declines to S2, it could present an opportunity for buyers to enter the market, especially if price action shows signs of stabilizing. A break below this level would suggest further downside movement.
- S3 (1.20925): The lowest support level in this range. If GBP/USD reaches this point, it may indicate an oversold condition and a potential reversal. However, if S3 fails to hold, further weakness could follow, opening the door to deeper declines.
Fundamental Overview:
The GBP/USD currency pair is driven by a combination of economic, geopolitical, and market sentiment factors. Here’s a more detailed look at the fundamental drivers:
-
UK Economic Data:
- Bank of England (BoE) Monetary Policy: The BoE’s decisions on interest rates and quantitative easing are significant for the GBP. Hawkish policies, such as raising rates or tightening monetary policy, typically support the pound, while dovish policies have the opposite effect.
- Economic Growth & Inflation: The UK’s GDP growth and inflation data (CPI) play a vital role. Strong GDP growth or rising inflation might lead to expectations of higher interest rates, thus supporting the pound. Conversely, weak economic performance or low inflation could dampen investor confidence in GBP.
- Labor Market: The UK’s employment data, including jobless claims, wage growth, and unemployment rates, directly impacts the pound. A strong labor market can drive optimism about the economy, boosting GBP.
-
US Economic Data:
- Federal Reserve (Fed) Policy: The Fed’s decisions on interest rates and its outlook for the US economy strongly influence the USD. A hawkish Fed (raising rates) tends to strengthen the dollar, while a dovish Fed (lowering rates or adopting a more accommodative stance) can weaken it.
- Non-Farm Payrolls (NFP): The monthly US jobs report is a key market mover for the dollar. A stronger-than-expected NFP report tends to be bullish for the USD as it signals economic strength and potential rate hikes by the Fed.
- Inflation (CPI): US inflation data is critical. Higher-than-expected inflation could lead to expectations of higher rates from the Fed, which typically strengthens the USD. Conversely, lower inflation could prompt the Fed to keep rates lower, weakening the dollar.
- Retail Sales and GDP: Both retail sales and GDP are essential indicators of economic health. Strong readings can boost USD, while weak data might weaken it.
-
Geopolitical and Market Sentiment:
- Brexit and EU Relations: Any developments regarding the UK’s relationship with the European Union, especially post-Brexit trade negotiations, could impact GBP. Concerns about a “hard Brexit” or trade disruptions may lead to a weaker GBP, while positive developments may boost confidence in the pound.
- Global Economic Events: Geopolitical tensions, natural disasters, or other global events can cause fluctuations in both GBP and USD. For instance, uncertainty regarding the US-China trade war or political instability in the UK can introduce volatility into GBP/USD.
- Risk Sentiment: GBP/USD can also be sensitive to shifts in global risk sentiment. In times of market uncertainty or risk aversion, investors may flock to the USD as a safe-haven asset, thereby strengthening the dollar relative to GBP.
Disclaimer:
Forex trading involves high volatility and can lead to significant losses. It is essential to trade with caution and ensure proper risk management. We strongly recommend seeking guidance from a financial expert or advisor before making any investment decisions.
USD/JPY Technical Analysis Report with Fundamental Overview
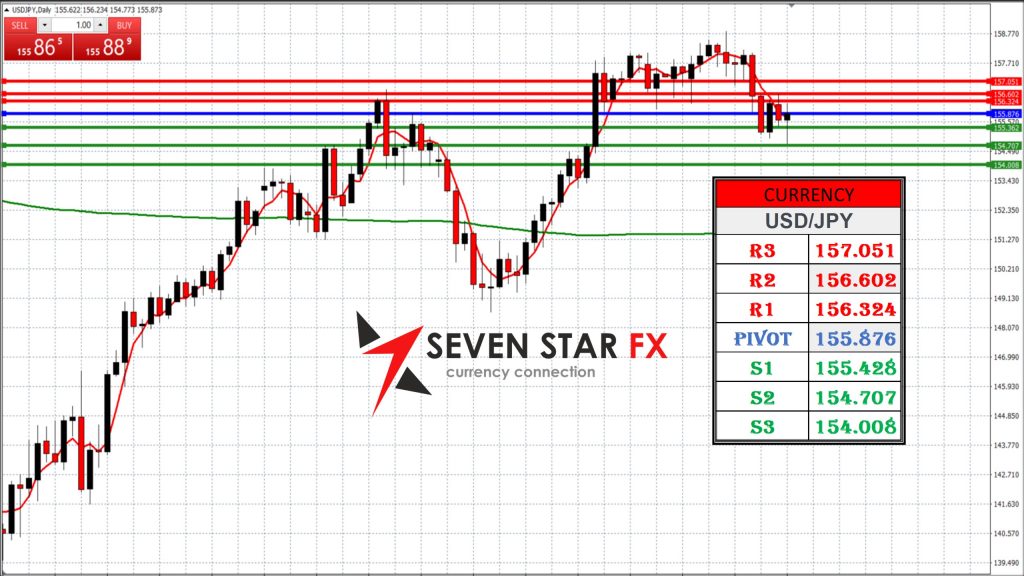
Daily Technical Analysis Report: USD/JPY
Technical Levels:
-
Resistance Levels (R):
- R3: 157.051
- R2: 156.602
- R1: 156.324
-
Pivot Point: 155.876
-
Support Levels (S):
- S1: 155.428
- S2: 154.707
- S3: 154.008
Technical Analysis:
-
Resistance Levels Analysis:
- R3 (157.051): This is a strong resistance level. If the price reaches R3, it may face significant selling pressure, potentially causing the pair to reverse. A break above R3 could suggest further bullish momentum, targeting even higher levels.
- R2 (156.602): If the pair reaches R2, it will be a critical level to test whether the uptrend continues. A break above R2 could lead to a rally towards R3, but if this resistance holds, we could see a pullback towards the pivot or support levels.
- R1 (156.324): As the nearest resistance level, R1 represents a potential barrier for any further upward movement. If the pair fails to break above R1, we might witness a consolidation or a move back toward the pivot point or support.
-
Support Levels Analysis:
- S1 (155.428): The first line of support. A bounce from S1 could indicate the continuation of the uptrend. If the price drops below S1, it could signal a potential bearish reversal, and further support levels should be considered.
- S2 (154.707): This level represents stronger support. If USD/JPY reaches S2, it might present a good opportunity for buyers to enter the market, especially if price action indicates stabilization. A break below this level could suggest further downside movement.
- S3 (154.008): The lowest support level in this range. If the pair reaches S3, it could indicate an oversold condition, with the possibility of a reversal. However, if S3 is broken, further downward pressure may follow.
Fundamental Overview:
The USD/JPY currency pair is influenced by a combination of US economic data, Bank of Japan (BoJ) policy, and global market sentiment. Below are the key fundamental factors that drive USD/JPY:
-
US Economic Data:
- Federal Reserve (Fed) Policy: The Fed’s decisions on interest rates and its economic outlook play a major role in determining the strength of the US dollar. A hawkish stance by the Fed (raising interest rates) generally supports the USD, whereas a dovish stance (cutting rates or adopting a more accommodative approach) weakens the dollar.
- US Inflation (CPI): US inflation data, particularly Consumer Price Index (CPI) numbers, have a direct impact on USD/JPY. Higher inflation could lead to expectations of higher rates from the Fed, strengthening the dollar. Conversely, lower inflation could cause the Fed to maintain low rates, weakening the dollar.
- Non-Farm Payrolls (NFP): The monthly NFP report is a crucial indicator of labor market health in the US. A strong NFP report suggests a robust economy, which may lead to USD appreciation. Weak NFP numbers could indicate economic stagnation and put downward pressure on the dollar.
- US GDP and Retail Sales: Strong GDP growth and robust consumer spending (retail sales) are signs of a healthy economy, supporting the USD. Weak data from these sectors could signal a slowdown, weighing on the dollar.
-
Bank of Japan (BoJ) Policy:
- BoJ Monetary Policy: The Bank of Japan’s policies heavily influence the yen. A dovish stance by the BoJ (keeping interest rates low or engaging in stimulus) generally weakens the yen, while any moves toward tightening could strengthen the yen. The BoJ’s stance on inflation and its future outlook will be key for the USD/JPY pair.
- Japan’s Economic Data: Economic indicators such as Japan’s GDP, inflation, and industrial production can impact the yen. A robust economic performance from Japan tends to support the yen, while signs of economic weakness could lead to a weakening yen.
-
Global Risk Sentiment:
- Safe-Haven Flows: The Japanese yen is often considered a safe-haven currency, meaning that during times of global economic uncertainty or geopolitical tensions, investors may seek the yen to hedge against risk, causing USD/JPY to decline. Conversely, when market sentiment is positive and risk appetite is high, the USD may strengthen against the yen.
- Geopolitical Factors: Global events such as trade wars, political instability, or natural disasters can create volatility in the market and influence demand for the yen and the US dollar. Heightened uncertainty usually strengthens the yen, while periods of market optimism may favor the USD.
Disclaimer:
Forex trading involves high volatility and can lead to significant losses. It is essential to trade with caution and ensure proper risk management. We strongly recommend seeking guidance from a financial expert or advisor before making any investment decisions.
AUD/USD Technical Analysis Report with Fundamental Overview
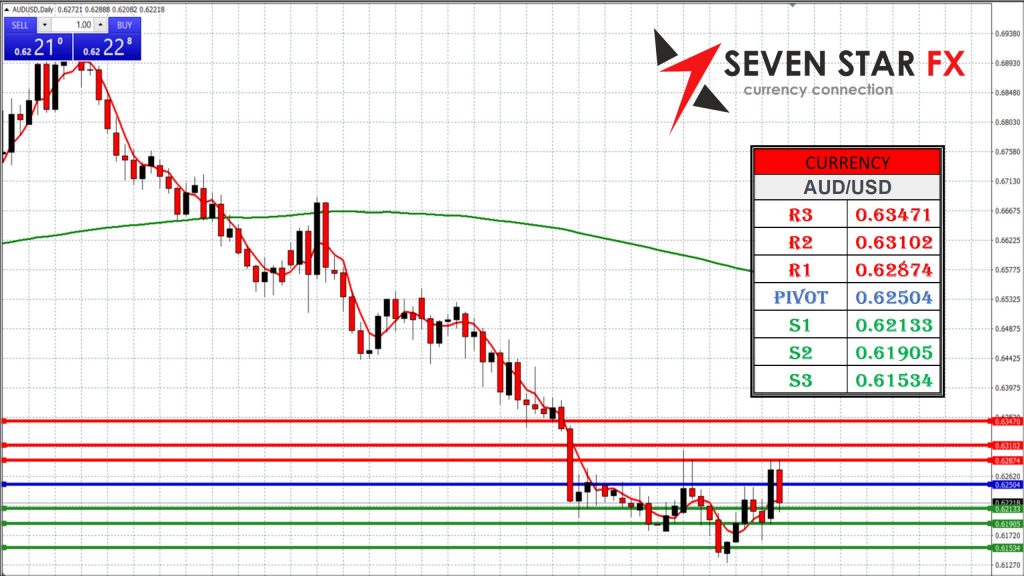
Daily Technical Analysis Report: AUD/USD
Technical Levels:
-
Resistance Levels (R):
- R3: 0.63471
- R2: 0.63102
- R1: 0.62874
-
Pivot Point: 0.625037
-
Support Levels (S):
- S1: 0.62133
- S2: 0.61905
- S3: 0.61534
Technical Analysis:
-
Resistance Levels Analysis:
- R3 (0.63471): This is a strong resistance level. If the price reaches R3, it may encounter significant selling pressure, which could potentially lead to a reversal. A break above R3 could signal a continuation of the bullish trend towards higher levels.
- R2 (0.63102): If the price approaches R2, this will be a critical level to test the momentum. A break above R2 would suggest the uptrend is likely to continue towards R3. A failure to break this level might indicate a pullback toward the pivot or support levels.
- R1 (0.62874): As the nearest resistance, R1 is likely to be a key barrier for further upward movement. If the price fails to break through this level, we may see a pullback or consolidation, possibly testing the pivot or support zones.
-
Support Levels Analysis:
- S1 (0.62133): This is the first line of support. If the price reaches S1, it could find buying interest here, potentially leading to a bounce higher. A move below S1, however, might signal further bearish pressure, targeting the lower support levels.
- S2 (0.61905): A stronger support level. If AUD/USD declines to S2, it could present an opportunity for buyers to step in, particularly if the price action shows signs of stabilizing. A break below this level would suggest further downside risk toward S3.
- S3 (0.61534): The lowest support level in this range. If AUD/USD reaches this level, it may indicate an oversold condition and could lead to a potential reversal. However, if the price breaks below S3, further declines might follow, signaling continued bearish momentum.
Fundamental Overview:
The AUD/USD currency pair is influenced by a mix of economic factors, primarily linked to Australia’s economy and the US economic outlook. Here’s a breakdown of the key fundamental drivers:
-
Australian Economic Data:
- Reserve Bank of Australia (RBA) Policy: The RBA’s decisions on interest rates and monetary policy significantly impact the Australian dollar. A hawkish stance (raising interest rates or tightening policy) typically strengthens the AUD, while a dovish stance (lower rates or accommodative measures) could weaken it.
- Commodity Prices: As Australia is a major exporter of commodities (such as iron ore, coal, and gold), global commodity prices play an essential role in the strength of the AUD. Rising commodity prices tend to support the Australian dollar, while falling prices may lead to a decline in AUD value.
- Australian Economic Growth: Key data points such as GDP growth, employment, and inflation are significant for the AUD. Strong economic growth signals a healthy economy, which can support the AUD. Conversely, weaker economic performance could result in a depreciating AUD.
-
US Economic Data:
- Federal Reserve (Fed) Policy: The Fed’s stance on interest rates and economic conditions has a major influence on the US dollar. A hawkish Fed, signaling economic strength and potential rate hikes, generally supports the USD. In contrast, a dovish Fed (low rates or an accommodative stance) could weaken the dollar.
- US Inflation (CPI): US inflation data has a direct impact on the USD. Higher-than-expected inflation often leads to expectations of tighter monetary policy by the Fed, which strengthens the dollar. On the other hand, lower inflation could weaken the USD.
- Non-Farm Payrolls (NFP): The NFP report, which measures job creation in the US economy, is a key economic indicator. A strong NFP print suggests a healthy labor market, which is bullish for the USD, while weaker employment figures could result in USD weakness.
- Retail Sales and GDP: These indicators show the strength of consumer spending and the overall economy. Strong retail sales or GDP growth often leads to USD appreciation, whereas weak data can lead to a weaker USD.
-
Global Market Sentiment:
- Risk Sentiment: The Australian dollar is often viewed as a risk-sensitive currency due to its ties to global commodity markets. In times of economic optimism and higher risk appetite, the AUD tends to strengthen. In contrast, during periods of market uncertainty or risk aversion, the AUD might weaken as investors seek safer assets like the USD.
- Commodity-Linked Risks: Australia’s heavy reliance on commodities for exports means that any global economic slowdown or downturn in commodity demand could have a negative effect on the AUD.
- US-China Trade Relations: Trade relations between the US and China can also affect AUD/USD. As China is a major trading partner for Australia, any tensions or developments in US-China relations could influence the AUD.
Disclaimer:
Forex trading involves high volatility and can lead to significant losses. It is essential to trade with caution and ensure proper risk management. We strongly recommend seeking guidance from a financial expert or advisor before making any investment decisions.
Crude Oil Technical Analysis Report with Fundamental Overview
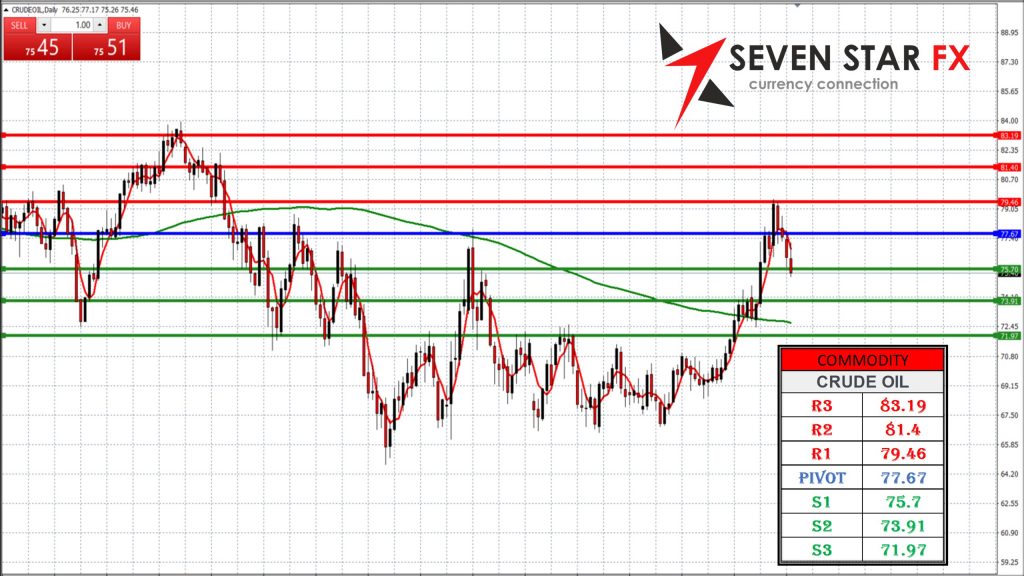
Daily Technical Analysis Report: Crude Oil (WTI)
Technical Levels:
-
Resistance Levels (R):
- R3: 83.19
- R2: 81.4
- R1: 79.46
-
Pivot Point: 77.67
-
Support Levels (S):
- S1: 75.7
- S2: 73.91
- S3: 71.97
Technical Analysis:
-
Resistance Levels Analysis:
- R3 (83.19): This is a significant resistance level. If crude oil prices reach R3, they may encounter strong selling pressure, potentially leading to a reversal. A breakout above R3 could signal continued bullish momentum, targeting higher price levels.
- R2 (81.4): This resistance level will be crucial for determining the next move. If prices breach R2, a rally towards R3 may be in store. However, if R2 holds as resistance, we could see a pullback or consolidation around the pivot level.
- R1 (79.46): The closest resistance level, R1 is likely to be an important barrier for further upward movement. If prices fail to break R1, a retracement toward the pivot or support levels could occur.
-
Support Levels Analysis:
- S1 (75.7): The first line of support. If crude oil prices drop to S1, this level could provide a bounce point. A failure to hold S1 would suggest further downside pressure toward the lower support levels.
- S2 (73.91): A stronger support level. If prices fall to S2, it could indicate an oversold condition, and buying interest might emerge here. A breach below S2 would open up the possibility of a move toward S3.
- S3 (71.97): The lowest support level in this range. A dip to S3 could signal a significant downward move and may be an oversold condition, potentially triggering a reversal. If S3 fails to hold, the bearish trend could accelerate.
Fundamental Overview:
Crude oil prices are influenced by a combination of supply and demand dynamics, geopolitical events, and macroeconomic factors. Here are the key fundamental drivers that impact crude oil:
-
Supply and Demand Dynamics:
- OPEC+ Policies: Decisions made by the Organization of the Petroleum Exporting Countries (OPEC) and its allies (OPEC+) are pivotal in shaping crude oil prices. If OPEC+ announces production cuts, it generally supports oil prices. Conversely, production increases or doubts about compliance with cuts can lead to price declines.
- US Shale Production: The US is one of the largest oil producers globally. Changes in US shale production can influence supply levels, impacting crude oil prices. If production increases, it can exert downward pressure on prices, while production cuts could tighten the market.
- Global Economic Growth: The demand for oil is closely tied to global economic activity. Strong economic growth, particularly in major economies like the US, China, and the EU, tends to increase demand for crude oil, supporting higher prices. In contrast, economic slowdowns or recessions can lead to reduced demand and falling prices.
-
Geopolitical Factors:
- Middle East Tensions: Crude oil prices are often highly sensitive to geopolitical events, especially in the Middle East, a key region for oil production. Any conflict, sanctions, or political instability in oil-producing countries can disrupt supply and lead to higher oil prices.
- US Dollar Strength: As crude oil is priced in US dollars, the strength or weakness of the dollar impacts oil prices. A stronger dollar tends to make oil more expensive for holders of other currencies, potentially reducing demand and putting downward pressure on prices. Conversely, a weaker dollar can make oil cheaper and more attractive, supporting prices.
-
Market Sentiment and Speculation:
- Investor Sentiment: Crude oil is often viewed as a commodity tied to market sentiment. In times of global uncertainty or risk aversion, oil prices can fall as investors seek safe-haven assets. Conversely, periods of optimism and growth tend to support oil prices.
- Inventory Data: Weekly reports on US oil inventories, such as those from the Energy Information Administration (EIA) or the American Petroleum Institute (API), can significantly impact crude oil prices. A large drawdown in inventories tends to indicate a tightening supply and can push prices higher, while an increase in stockpiles suggests a looser market and can lead to price declines.
-
Macro Factors:
- Inflation and Central Bank Policies: Inflationary pressures and central bank policies (such as those of the Federal Reserve or the European Central Bank) can indirectly impact crude oil prices. Higher inflation often leads to higher demand for commodities, including oil, which can boost prices. Additionally, any signals from central banks regarding interest rates or monetary policy can influence oil market sentiment.
- Natural Disasters: Events such as hurricanes or major storms can disrupt oil production and refining, particularly in the Gulf of Mexico or other key oil-producing regions. Such disruptions tend to lead to price spikes due to supply concerns.
Disclaimer:
Crude oil trading involves high volatility and can lead to significant losses. It is essential to trade with caution and ensure proper risk management. We strongly recommend seeking guidance from a financial expert or advisor before making any investment decisions.
XAU/USD Technical Analysis Report with Fundamental Overview
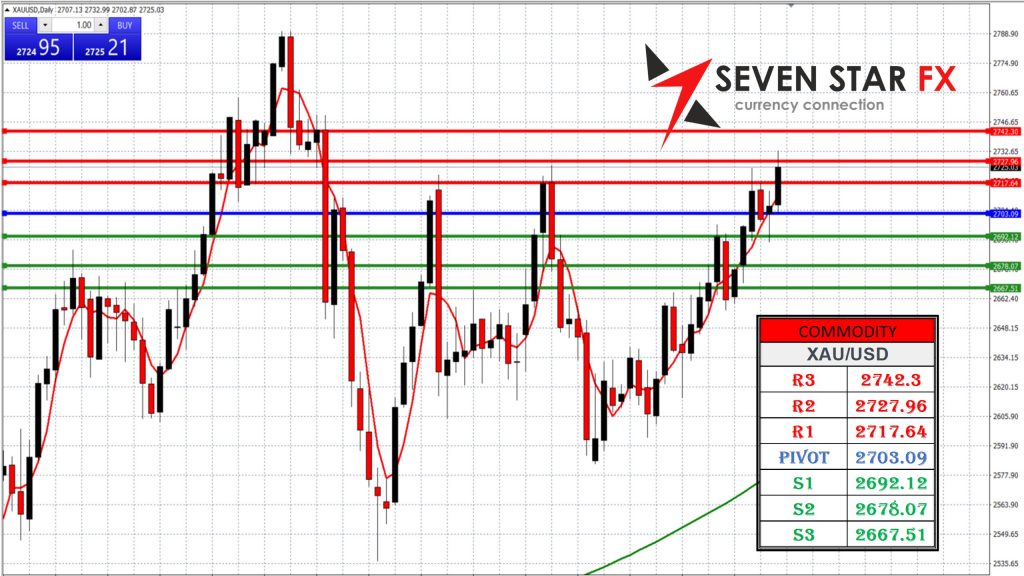
Daily Technical Analysis Report: XAU/USD (Gold)
Technical Levels:
-
Resistance Levels (R):
- R3: 2742.3
- R2: 2727.96
- R1: 2717.64
-
Pivot Point: 2703.09
-
Support Levels (S):
- S1: 2692.12
- S2: 2678.07
- S3: 2667.51
Technical Analysis:
-
Resistance Levels Analysis:
- R3 (2742.3): A strong resistance level. If gold prices reach R3, it could face significant selling pressure. A breakout above R3 could lead to further bullish momentum, pushing towards higher levels.
- R2 (2727.96): A critical resistance level. If the price tests R2, it will be essential to watch for signs of price rejection or breakouts. A break above R2 could signal an extension of the uptrend, targeting R3. Failure to surpass R2 may cause the price to pull back.
- R1 (2717.64): The closest resistance level. A failure to break through R1 could lead to a consolidation phase, possibly retesting the pivot or support levels. If the level holds, it may indicate weakening momentum and a potential reversal.
-
Support Levels Analysis:
- S1 (2692.12): The first support level. If gold drops to S1, it may encounter buying interest, potentially leading to a price rebound. However, if the price breaks below S1, the next support levels should be considered.
- S2 (2678.07): A strong support level. If the price falls to S2, it could present a significant buying opportunity, especially if the price action indicates a reversal. A break below this level would suggest further downside movement.
- S3 (2667.51): The lowest support level in this range. If XAU/USD reaches S3, it could indicate an oversold condition, triggering a potential price reversal. A break below S3 would suggest further bearish momentum.
Fundamental Overview:
XAU/USD (Gold) is influenced by a variety of factors, including economic data, central bank policies, and global geopolitical events. Below are the key fundamental drivers:
-
US Dollar and Inflation:
- US Dollar: As gold is priced in US dollars, the strength of the dollar has an inverse relationship with gold prices. A stronger dollar tends to put downward pressure on gold, while a weaker dollar can support gold prices. Investors often turn to gold as a hedge against dollar weakness.
- US Inflation: Gold is often viewed as a hedge against inflation. When inflation expectations rise, gold typically sees increased demand. Higher inflation tends to erode the purchasing power of fiat currencies, leading investors to seek safe-haven assets like gold.
- Federal Reserve (Fed) Policy: The Fed’s decisions regarding interest rates and its stance on monetary policy have a major impact on gold. Hawkish policies (rate hikes) generally weigh on gold prices, while dovish policies (rate cuts or accommodative measures) tend to support gold. The market closely watches the Fed’s signals on future monetary tightening or loosening.
-
Global Economic Uncertainty:
- Risk Sentiment: Gold is often viewed as a safe-haven asset in times of market volatility or economic uncertainty. During periods of geopolitical instability, trade tensions, or economic slowdowns, gold tends to see increased demand as investors look for a store of value. Conversely, in periods of risk-on sentiment (economic optimism), gold may underperform as investors favor higher-risk assets.
- Central Bank Buying: Central banks around the world hold significant amounts of gold in reserves. The buying or selling decisions by central banks can impact the price of gold. Increased gold purchases by central banks, especially from major economies like China or Russia, can support gold prices.
-
Geopolitical Factors:
- Global Tensions: Geopolitical events such as wars, natural disasters, or conflicts between major economies can lead to a flight to safety, driving up the price of gold. Gold is often seen as a stable store of value during periods of geopolitical turmoil.
- Market Volatility: Events like stock market crashes or financial crises often lead to increased demand for gold. As a non-yielding asset, gold is considered a hedge against market volatility, particularly in times of financial uncertainty.
-
Commodity and Inflation Hedging:
- Gold as a Hedge: During periods of rising commodity prices or inflation, investors often turn to gold as a hedge. As commodities such as oil or food prices rise, gold becomes an attractive investment to preserve wealth.
- Real Interest Rates: Gold has an inverse relationship with real interest rates (nominal interest rates adjusted for inflation). When real rates are negative (i.e., inflation exceeds nominal rates), gold becomes an attractive investment since it offers protection against inflation. Rising real rates, on the other hand, can lead to lower gold prices as bond yields become more attractive.
-
Technical Indicators and Sentiment:
- Speculative Activity: Gold prices are also influenced by speculative trading activity. Large hedge funds, institutional investors, and retail traders often influence the price based on technical signals, momentum, and market sentiment.
- Price Action: Technical analysis, including trend patterns and key support/resistance levels, plays an important role in shaping market sentiment and influencing trading decisions related to gold.
Disclaimer:
Gold trading involves high volatility and can lead to significant losses. It is essential to trade with caution and ensure proper risk management. We strongly recommend seeking guidance from a financial expert or advisor before making any investment decisions.
Dow Jones Technical Analysis Report with Fundamental Overview
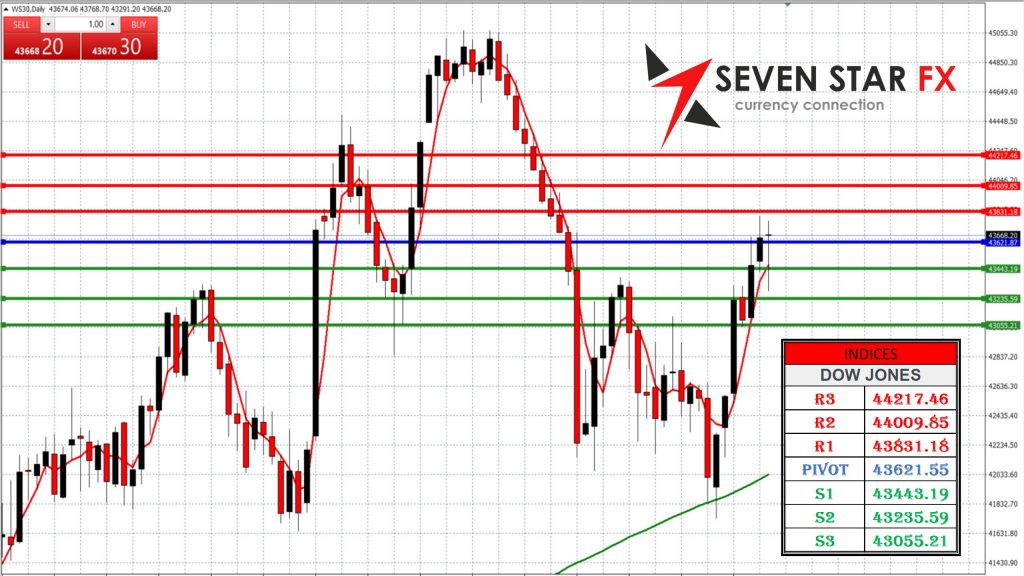
Daily Technical Analysis Report: Dow Jones
Technical Levels:
-
Resistance Levels (R):
- R3: 44217.46
- R2: 44009.85
- R1: 43831.18
-
Pivot Point: 43621.55
-
Support Levels (S):
- S1: 43443.19
- S2: 43235.59
- S3: 43055.21
Technical Analysis:
-
Resistance Levels Analysis:
- R3 (44217.46): This is a strong resistance level. If the DJIA reaches R3, it could face significant selling pressure. A break above R3 would signal a continuation of the bullish trend and open up further upside potential.
- R2 (44009.85): A critical resistance level. A move towards R2 would suggest strong bullish momentum. If this level holds as resistance, we might see a pullback or consolidation at the pivot point. A break above R2 could signal a move toward R3.
- R1 (43831.18): The first resistance point in the range. If the index faces resistance here, it may pull back to test the pivot or support levels. However, a break above R1 could set the stage for a test of R2 and R3.
-
Support Levels Analysis:
- S1 (43443.19): This is the first line of support. If the index declines to S1, it could find buying interest and potentially rebound. A failure to hold at this level could signal further downside toward S2.
- S2 (43235.59): A strong support level. If the price drops to S2, it might attract buyers, leading to a potential reversal. A break below this level could indicate bearish sentiment and suggest a further move to S3.
- S3 (43055.21): The lowest support level. A move to S3 would suggest a significant downward move, and if this level does not hold, it could lead to further declines in the index. However, S3 might offer a buying opportunity if the index reaches an oversold condition.
Fundamental Overview:
The Dow Jones Industrial Average (DJIA) is a major benchmark for the performance of the US stock market, reflecting the strength of 30 of the largest and most influential companies in the US. Here are the key fundamental drivers that affect the DJIA:
-
Economic Data and Growth:
- GDP Growth: The DJIA is directly impacted by US economic growth. Strong GDP figures indicate a growing economy, which generally boosts corporate earnings and supports the stock market. Conversely, weak GDP data or economic slowdowns may lead to declines in the index.
- Unemployment and Job Data: Employment figures, particularly the Non-Farm Payrolls (NFP) report, provide insight into the health of the labor market. Strong job growth signals a healthy economy and tends to support stock prices, including the DJIA. Conversely, high unemployment or weak job reports can weigh on market sentiment.
- Inflation Data: Inflation is a key concern for investors. Rising inflation can lead to higher costs for businesses and erode consumer purchasing power, negatively impacting stock prices. The Federal Reserve’s response to inflation (such as rate hikes) is closely watched, as it can have a direct effect on equity markets.
-
Monetary Policy and Interest Rates:
- Federal Reserve Actions: The US Federal Reserve’s decisions on interest rates and monetary policy are crucial for the DJIA. Hawkish policies (rate hikes) can make borrowing more expensive and negatively affect equity valuations. Conversely, dovish policies (rate cuts) generally support stocks by making credit cheaper and increasing liquidity.
- Quantitative Easing (QE): The Federal Reserve’s use of QE programs (buying financial assets) has been a major factor in supporting stock market prices. Any announcements regarding tapering or unwinding QE can create market volatility.
-
Corporate Earnings:
- Quarterly Earnings Reports: The performance of individual companies in the Dow Jones is essential for the index’s movement. Strong corporate earnings often lead to an increase in stock prices, while disappointing results can pull the index lower. Earnings season is a critical time for traders and investors as it provides insight into the health of major US companies.
- Profit Margins and Revenue Growth: Corporate profitability, driven by revenue growth and cost management, influences the DJIA. Sectors with strong performance or growth prospects, such as technology, consumer goods, or finance, can lift the index.
-
Global Geopolitical Factors:
- US-China Trade Relations: Trade relations between the US and China can influence global supply chains and corporate profitability. Any trade deals, tariffs, or disputes between the two countries can impact the DJIA, particularly for multinational companies that rely on international markets.
- Geopolitical Uncertainty: Events such as political instability, wars, or trade tensions can create volatility in equity markets. The DJIA tends to react to such events, with heightened uncertainty leading to risk aversion and possible sell-offs.
-
Market Sentiment and Investor Behavior:
- Investor Confidence: Market sentiment, driven by both economic data and geopolitical factors, plays a key role in shaping the DJIA’s movement. A positive economic outlook and strong investor confidence generally support the stock market, while concerns over growth or global risks can lead to market corrections.
- Risk Appetite: The DJIA often reflects broader investor risk sentiment. In times of optimism, investors are more likely to allocate capital to equities, driving the index higher. Conversely, in periods of risk aversion, funds may flow out of stocks and into safer assets like bonds or gold.
-
Inflation and Commodity Prices:
- Commodity Price Movements: Commodity prices, especially oil and metals, can impact the DJIA. A rise in oil prices, for instance, can increase costs for energy-dependent companies, negatively affecting the profitability of firms within the index. On the other hand, falling commodity prices may benefit industries such as airlines or transportation.
- Inflationary Pressures: Persistent inflationary pressures can increase costs for businesses, squeezing profit margins. If inflation runs too high without corresponding wage growth, it can lead to reduced consumer spending, which negatively impacts the profitability of companies in the DJIA.
Disclaimer:
Stock market trading, including the Dow Jones Industrial Average, involves high volatility and can lead to significant losses. It is essential to trade with caution and ensure proper risk management. We strongly recommend seeking guidance from a financial expert or advisor before making any investment decisions.
————————————————————————————————————————————————————————————————————————————-
Notice: The data presented is derived from technical analysis and does not constitute financial advice. For those trading in forex, consulting a qualified financial advisor prior to making investment decisions is strongly recommended.
Caution: The information above reflects ongoing technical analysis and should not be interpreted as financial advice. Forex trading involves high volatility, and without proper knowledge, you risk losing all your capital. It is essential to consult with a financial advisor before investing.
Advisory: The insights shared are the result of technical analysis and are not intended as financial advice. Forex traders should seek advice from professional financial advisors before making any investment decisions. Remember, the forex market is highly volatile, and trading without adequate knowledge can lead to significant losses.
Important: The analysis provided is for informational purposes only and should not be seen as financial advice. Forex trading carries substantial risks, and it is advisable to consult financial advisors before proceeding with any investments. This content is intended solely for Wealth Management Education purposes.