Market Wrap: Stocks, Bonds, Commodities
Stock futures were flat in overnight trading Thursday as the market is poised to end the week with steep losses. Futures on the Dow Jones Industrial Average were little changed. S&P 500 futures and Nasdaq 100 futures were also flat.
The Dow Jones Industrial Average lose 370.46 points to 34,070.42, the S&P 500 fell 1.64% to 4,330.00 and the Nasdaq Composite subtract 245.14 points to 13,223.99.
MSCI’s index of Asia-Pacific stocks outside Japan is advance 0.84% to 610.39 levels. The Australian index was higher by 0.05% to 7,068.80. Japanese Nikkei Index drop 0.68% today.
European stocks were mixed on Friday, with the Stoxx Europe 50 Index fell 0.34% to 4,198.25, Germany’s DAX drop 0.24% to 15,534.05, and France’s CAC fell 0.58% to 7,174.29 and U.K.’s FTSE 100 add 0.49% to 7,716.35.
Benchmark 10-year U.S. Treasury fell as demand for safe assets ascend again, today 10-year bond yields positive 0.18% to 4.4740.
Oil prices rebounded in trading on Thursday, after a Russian ban on fuel exports snapped focus away from Western economic headwinds and back to throttled crude supply to the end of 2023.
Spot Brent crude oil ascend 0.75% to $94.00 per barrel. US West Texas Intermediate crude is up 1.00% to $90.53 a barrel.
The yellow metal gold is advance 0.32% to 1,945.85 dollars per ounce.
Market Wrap: Forex
The U.S. dollar eased against a basket of currencies on Thursday, but remained near a six-month high, a day after the Federal Reserve signaled U.S. monetary policy will remain restrictive for longer.
Today, the U.S. dollar index measures the Greenback against a trade-weighted basket of six major currencies, which surged 0.26% to 105.310.
The Euro US Dollar (EUR/USD) is a widely traded pair that is down 0.21% today. This left the pair trading around $1.06360.
The Japanese yen was negative against the U.S. dollar on Friday. Today USD/JPY is surged 0.45% to the 148.240 level.
Another commodity-related currency positive against the U.S dollar, AUD/USD rose 0.34% to 0.64400, and NZD/USD surged 0.46% to 0.59580 level.
EUR/USD Intraday: Trend on the upside
Our pivot point is at 1.06510
Preferable Price Action: Take buy positions above pivot level with targets at 1.06800 & 1.06980 in extension.
Alternative Price Action: Below pivot looks for a further downside to 1.06240 & 1.06060.
Comment: RSI is above 50 levels and Pairs above its 20MA & 55MA.
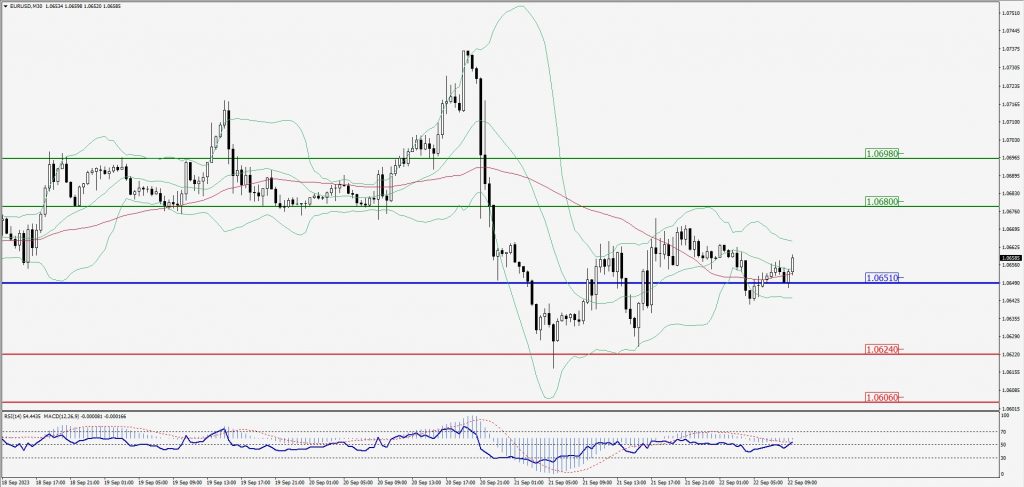
Green Lines Indicate Resistance Levels – Red Lines Indicate Support Levels
Light Blue is a Pivot Point – Black represents the price when the report was produced
GBP/USD Intraday: Resistance level at 1.22970
Our pivot point is at 1.22970
Preferable Price Action: Sell positions below pivot with targets at 1.22600 & 1.22360 in extension.
Alternative Price Action: The price above pivot would call for further upside to 1.23300 & 1.23540.
Comment: RSI is below 50 levels and Pairs below its 20MA & 55MA.
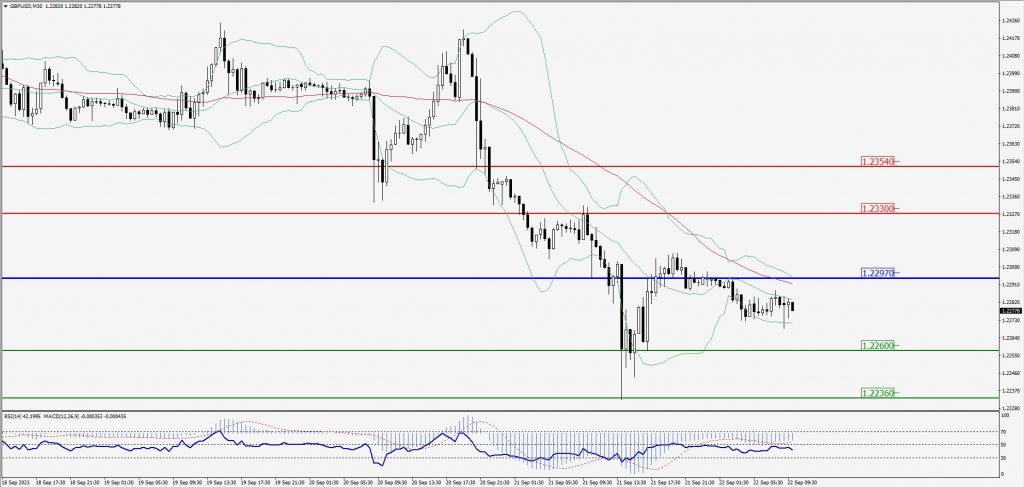
Green Lines Indicate Resistance Levels – Red Lines Indicate Support Levels
Light Blue is a Pivot Point – Black represents the price when the report was produced
USD/JPY Intraday: Major trend on the upside
Our pivot point is at 148.280
Preferable Price Action: Buy position above pivot with the target at 148.560 and 148.730 in extension.
Alternative Price Action: The downside breakout of the pivot would call for 148.040 and 147.860.
Comment: MACD is above 50 level and Pairs above its 20MA & 55MA.
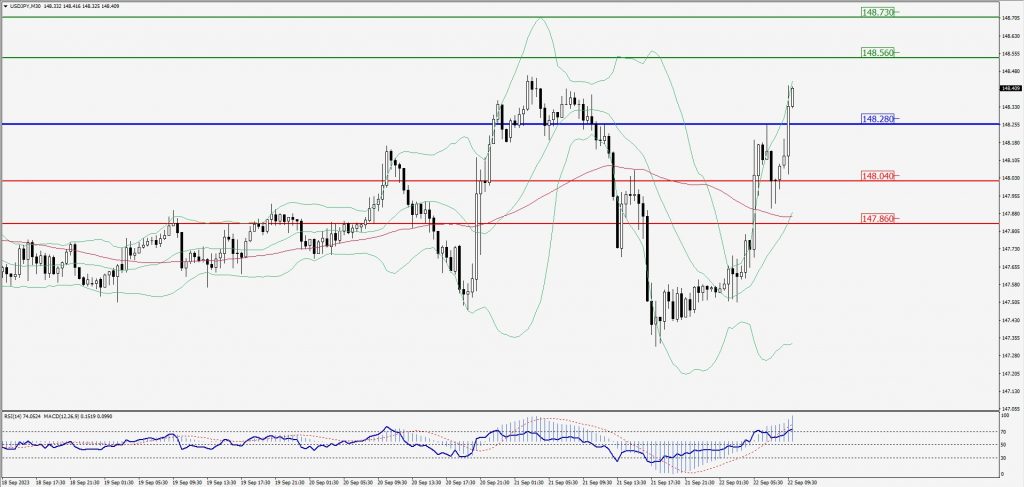
Green Lines Indicate Resistance Levels – Red Lines Indicate Support Levels
Light Blue is a Pivot Point – Black represents the price when the report was produced
AUD/USD Intraday: Support level at 0.64150
Our pivot point is at 0.64150
Preferable Price Action: Buy positions above pivot with targets at 0.64400 & 0.64570 in extension.
Alternative Price Action: Below pivot looks for a further downside with 0.63950 & 0.63800 as targets.
Comment: RSI is above 50 levels and Pairs above its 20MA & 55MA.
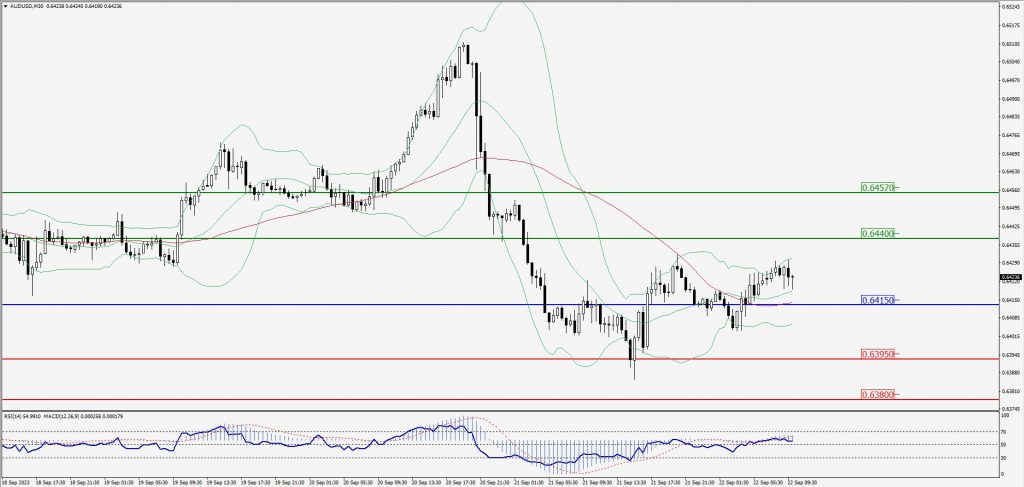
Green Lines Indicate Resistance Levels – Red Lines Indicate Support Levels
Light Blue is a Pivot Point – Black represents the price when the report was produced
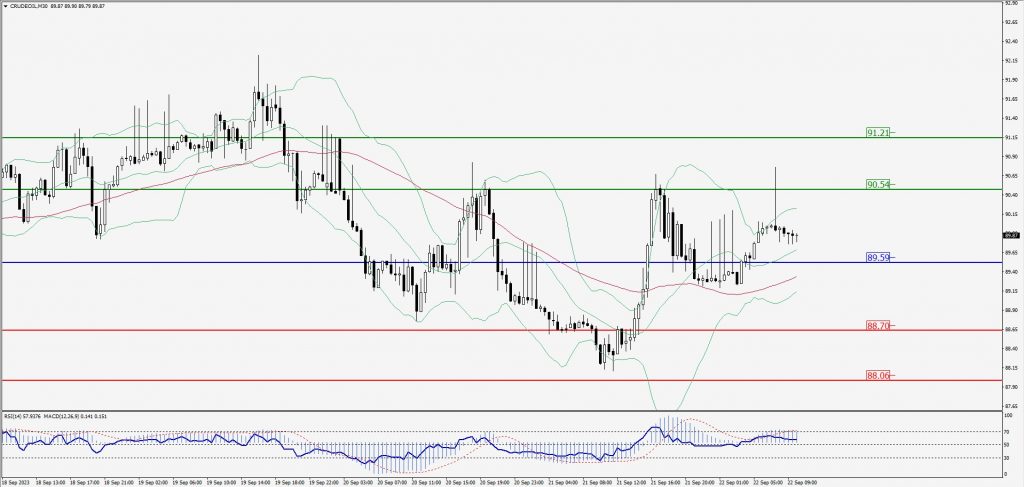
CRUDEOIL Intraday: Trend on the upside
Our pivot point is at 89.59
Preferable Price Action: Above pivot buy oil with 90.54 & 91.21 as targets.
Alternative Price Action: Sell crude below pivot with targets at 88.70 and 88.06 in extension.
Comment: MACD is positive territory and Pairs above its 20MA & 55MA.
Green Lines Indicate Resistance Levels – Red Lines Indicate Support Levels
Light Blue is a Pivot Point – Black represents the price when the report was produced
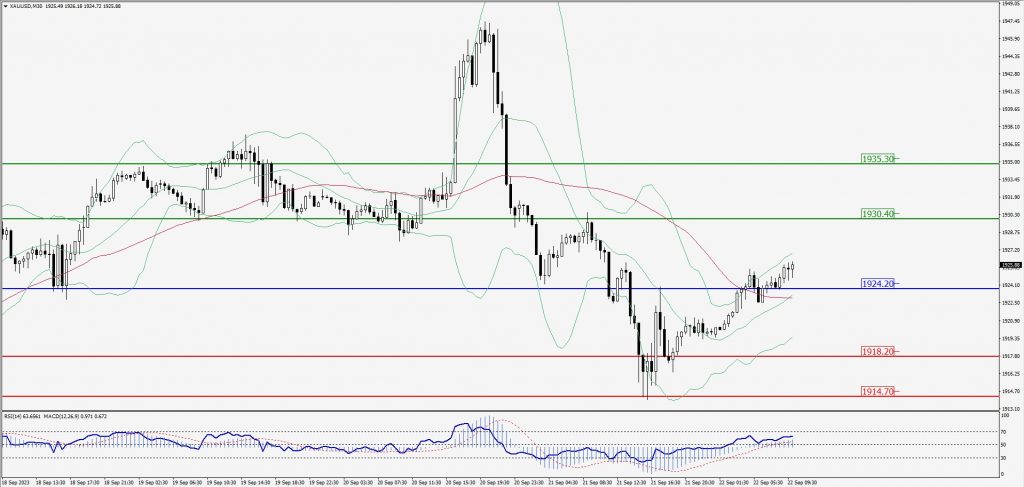
XAU/USD Intraday: Trend on the upside
Our pivot point is 1924.20
Preferable Price Action: Further upside to 1930.40 and 1935.30.
Alternative Price Action: If the price gives a downside breakout of a pivot, then the price extends to 1918.20 and 1914.70.
Comment: MACD is above 50 level and Pairs above its 20MA & 55MA.
Green Lines Indicate Resistance Levels – Red Lines Indicate Support Levels
Light Blue is a Pivot Point – Black represents the price when the report was produced
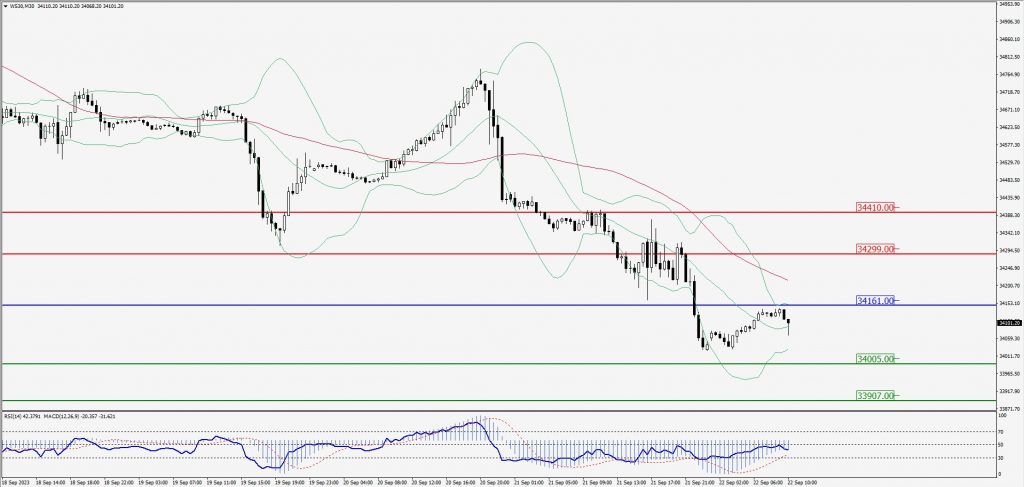
Dow Jones Intraday: Trend on the downside
Our pivot point is 34,161.00
Preferable Price Action: Take sell positions below the pivot with targets at 34,005.00 & 33,907.00.
Alternative Price Action: Above 34,161.00 looks for further upside to 34,299.00 & 34,410.00.
Comment: RSI is below 50 levels and Pairs below 55MA.
Green Lines Indicate Resistance Levels – Red Lines Indicate Support Levels
Light Blue is a Pivot Point – Black represents the price when the report was produced