Market Wrap: Stocks, Bonds, Commodities
Stock futures traded near the flat line Wednesday night as investors parsed through the Federal Reserve’s projections made earlier in the day.
The Dow Jones Industrial Average lose 76.85 points to 34,440.88, the S&P 500 fell 0.94% to 4,402.20 and the Nasdaq Composite subtract 209.06 points to 13,469.13.
MSCI’s index of Asia-Pacific stocks outside Japan is decline 1.35% to 605.83 levels. The Australian index was lower by 1.37% to 7,065.20. Japanese Nikkei Index drop 1.22% today.
European stocks were negative on Thursday, with the Stoxx Europe 50 Index fell 0.99% to 4,233.75, Germany’s DAX drop 0.82% to 15,650.55, and France’s CAC fell 1.14% to 7,247.20 and U.K.’s FTSE 100 subtract 0.54% to 7,689.42.
Benchmark 10-year U.S. Treasury fell as demand for safe assets ascend again, today 10-year bond yields positive 1.94% to 4.4310.
Oil prices fell on Wednesday ahead of the US Federal Reserve’s interest rate decision, with investors uncertain when peak rates will be hit and how much of an impact it will have on energy demand.
Spot Brent crude oil drop 1.25% to $92.36 per barrel. US West Texas Intermediate crude is down 1.27% to $88.52 a barrel.
The yellow metal gold is decline 1.12% to 1,945.05 dollars per ounce.
Market Wrap: Forex
The U.S. dollar edged higher against a basket of currencies on Wednesday, after the Federal Reserve held interest rates steady but stiffened its hawkish stance with a further rate increase projected by the end of the year.
Today, the U.S. dollar index measures the Greenback against a trade-weighted basket of six major currencies, which surged 0.38% to 105.180.
The Euro US Dollar (EUR/USD) is a widely traded pair that is down 0.05% today. This left the pair trading around $1.06550.
The Japanese yen was negative against the U.S. dollar on Thursday. Today USD/JPY is slipped 0.09% to the 148.200 level.
Another commodity-related currency negative against the U.S dollar, AUD/USD fell 0.59% to 0.64070, and NZD/USD slipped 0.25% to 0.59140 level.
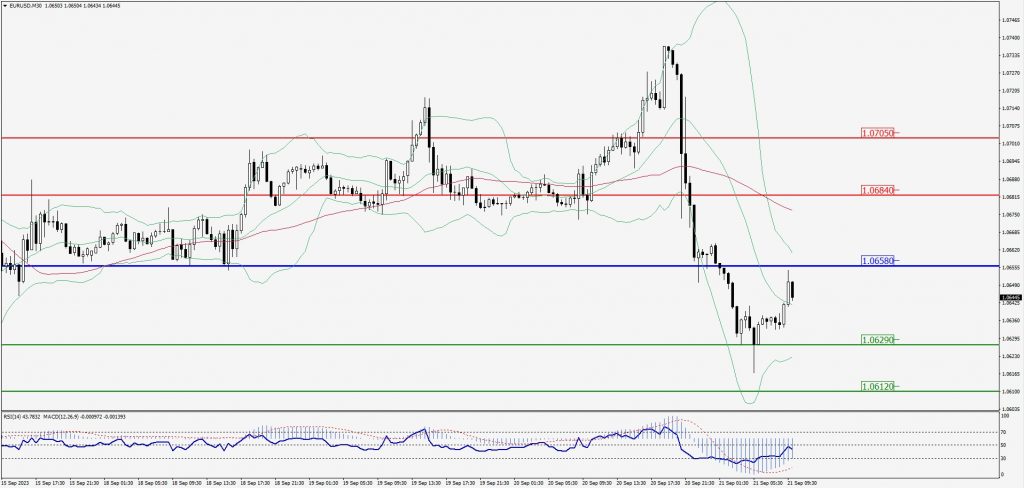
EUR/USD Intraday: Trend on the downside
Our pivot point is at 1.06580
Preferable Price Action: Take sell positions below pivot level with targets at 1.06290 & 1.06120 in extension.
Alternative Price Action: Above pivot looks for a further upside to 1.06840 & 1.07050.
Comment: RSI is below 50 levels and Pairs below 55MA.
Green Lines Indicate Resistance Levels – Red Lines Indicate Support Levels
Light Blue is a Pivot Point – Black represents the price when the report was produced
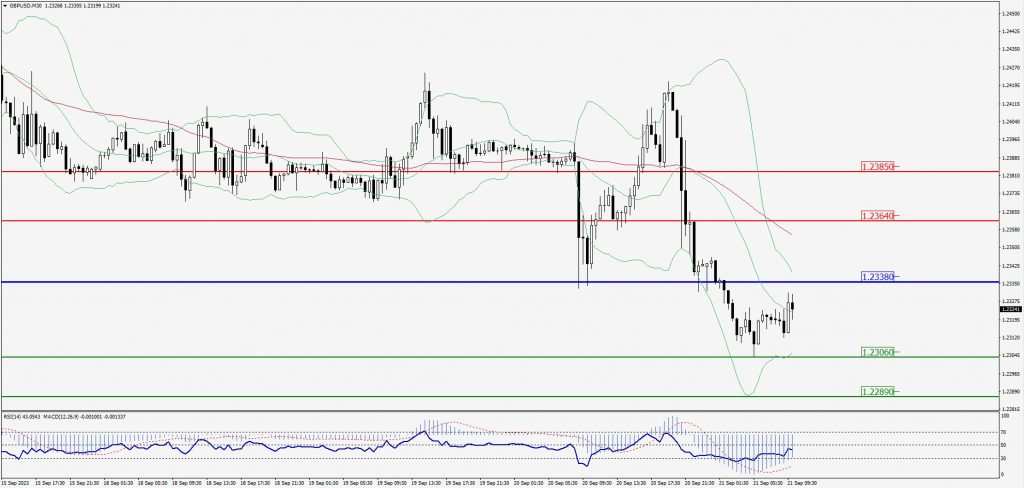
GBP/USD Intraday: Trend on the downside
Our pivot point is at 1.23380
Preferable Price Action: Sell positions below pivot with targets at 1.23060 & 1.22890 in extension.
Alternative Price Action: The price above pivot would call for further upside to 1.23640 & 1.23850.
Comment: RSI is below 50 levels and Pairs below 55MA.
Green Lines Indicate Resistance Levels – Red Lines Indicate Support Levels
Light Blue is a Pivot Point – Black represents the price when the report was produced
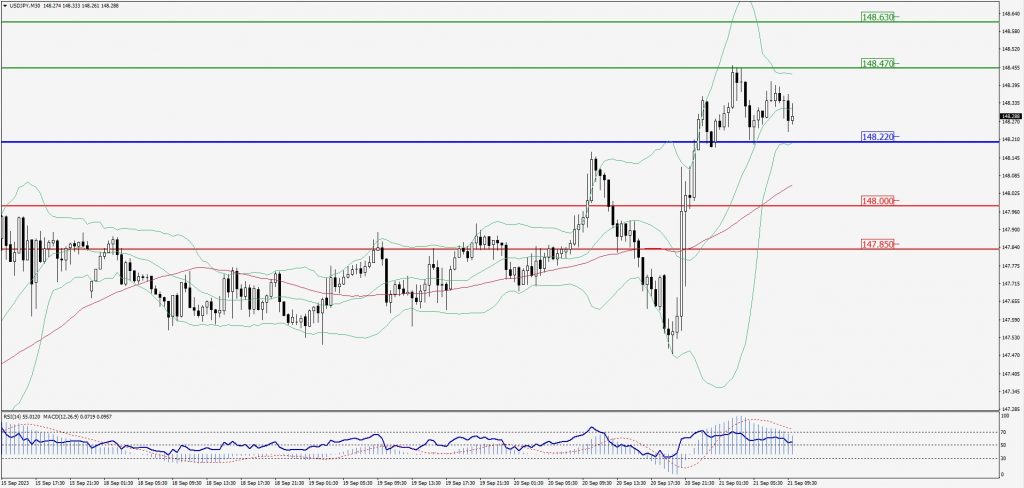
USD/JPY Intraday: Trend on the upside
Our pivot point is at 148.220
Preferable Price Action: Buy position above pivot with the target at 148.470 and 148.630 in extension.
Alternative Price Action: The downside breakout of the pivot would call for 148.000 and 147.850.
Comment: MACD is above 50 level and Pairs above 55MA.
Green Lines Indicate Resistance Levels – Red Lines Indicate Support Levels
Light Blue is a Pivot Point – Black represents the price when the report was produced
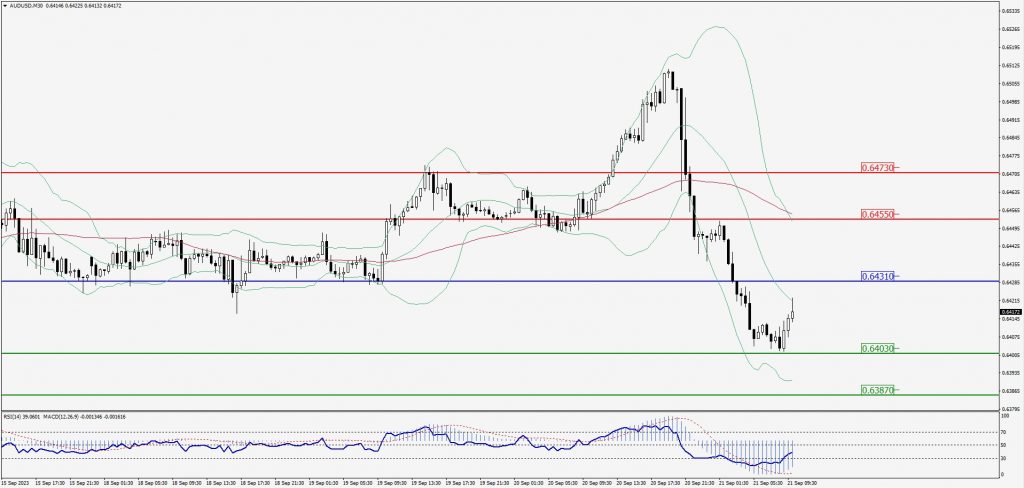
AUD/USD Intraday: Trend on the downside
Our pivot point is at 0.64310
Preferable Price Action: Sell positions below pivot with targets at 0.64030 & 0.63870 in extension.
Alternative Price Action: Above pivot looks for a further upside with 0.64550 & 0.64730 as targets.
Comment: RSI is below 50 levels and Pairs below 55MA.
Green Lines Indicate Resistance Levels – Red Lines Indicate Support Levels
Light Blue is a Pivot Point – Black represents the price when the report was produced
CRUDEOIL Intraday: Major trend on the downside
Our pivot point is at 88.98
Preferable Price Action: Below pivot sell oil with 87.81 & 87.05 as targets.
Alternative Price Action: Buy crude above pivot with targets at 89.96 and 90.80 in extension.
Comment: MACD is negative territory and Pairs below its 20MA & 55MA.
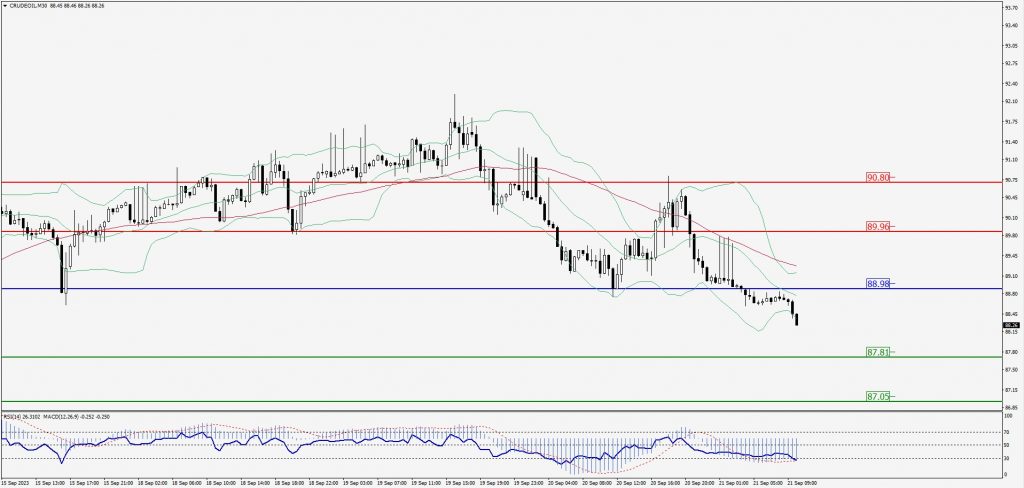
Green Lines Indicate Resistance Levels – Red Lines Indicate Support Levels
Light Blue is a Pivot Point – Black represents the price when the report was produced
XAU/USD Intraday: Resistance level at 1930.30
Our pivot point is 1930.30
Preferable Price Action: Further downside to 1922.70 and 1917.40.
Alternative Price Action: If the price gives an upside breakout of a pivot, then the price extends to 1937.20 and 1942.90.
Comment: MACD is below 50 level and Pairs below 55MA.
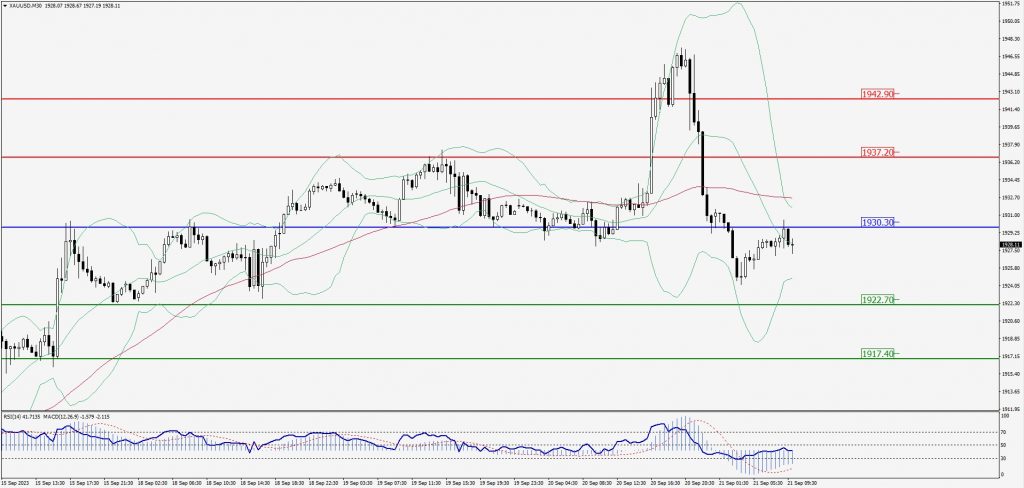
Green Lines Indicate Resistance Levels – Red Lines Indicate Support Levels
Light Blue is a Pivot Point – Black represents the price when the report was produced
Dow Jones Intraday: Trend on the downside
Our pivot point is 34,442.00
Preferable Price Action: Take sell positions below the pivot with targets at 34,289.00 & 34,202.00.
Alternative Price Action: Above 34,442.00 looks for further upside to 34,576.00 & 34,667.00.
Comment: RSI is below 50 levels and Pairs below 55MA.
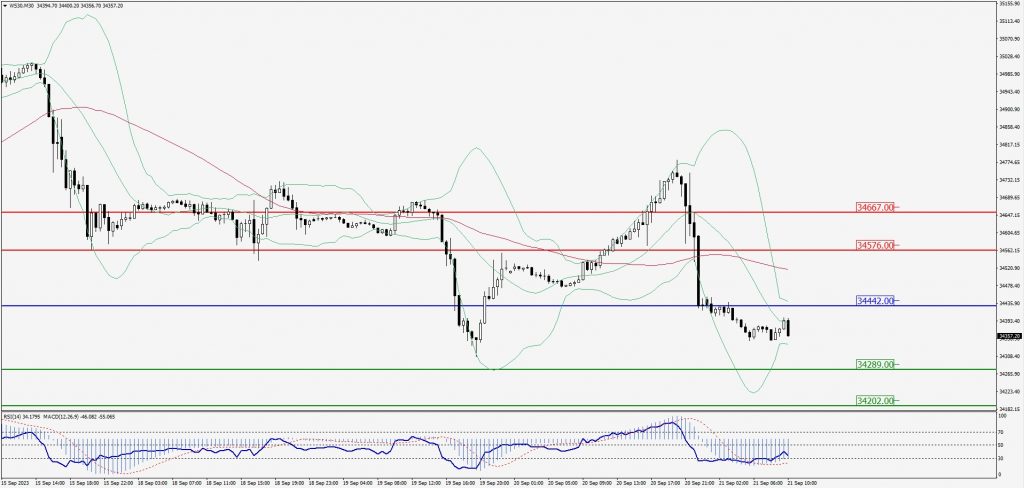
Green Lines Indicate Resistance Levels – Red Lines Indicate Support Levels
Light Blue is a Pivot Point – Black represents the price when the report was produced